

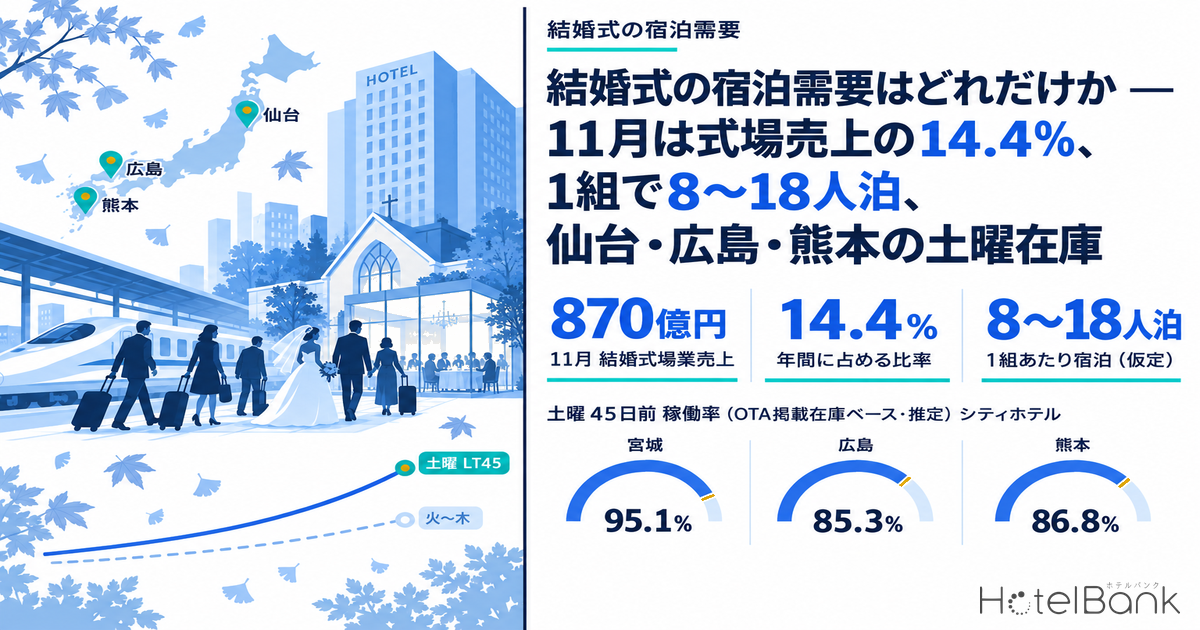
According to the reference tables of the Ministry of Internal Affairs and Communications (MIC)’s Current Survey on Service Industries, wedding venue sales in November 2025 came to ¥87.0 billion, or 14.4% of the annual total of ¥605.5 billion; together with October’s ¥65.3 billion, the two months accounted for 25.2%. This is the second peak of the year alongside spring (March–May, 27.7%), and this autumn the wedding high season again begins in October. Rather than weddings themselves, this article focuses on “the rooms that guests stay in.” After separating the seasonal pattern of ceremonies from the monthly count of marriage registrations, it uses published guest counts to estimate, as an assumption-based range, how many guest-nights one wedding generates, and then uses MetroEngines Research data to check when Saturday rooms fill up and how far rates diverge from weekdays in three metro areas with deep city-hotel supply: Sendai, Hiroshima and Kumamoto. The conclusions are a sense of scale for how much wedding-driven lodging can land on an autumn Saturday, and the room that lodging-only properties have to capture that demand through the nights before and after and through shuttle services.
Metric Definitions Used in This Article
- ADR (Average Daily Rate): an estimated transacted rate (tax-exclusive equivalent), calculated by applying category-specific adjustment factors to the lowest published plan level on OTAs (per room, two guests per room, tax included). Checked against property-level results disclosed by listed hotel REITs (91 properties, most recent three months), the median error is about 7%. It is an estimate and differs from each property’s actual transacted prices and accounting figures. Area-level ADR is the median of the covered properties (the level of a typical property in the area).
- OCC (Occupancy Rate): the share of rooms sold out of total rooms in the area (an estimate based on OTA sales inventory; consistency checks against monthly REIT disclosures confirm accuracy to within roughly a few points). The “occupancy rate (OTA-listed inventory basis, estimated)” in this article is an estimate based on how inventory sold on OTAs is being absorbed, and differs from the actual occupancy of the whole property. Coverage is a fixed set of properties that list 30% or more of their total rooms on OTAs.
- Listed price: the average across all plans of the per-room rate for two guests (tax included). Day-of-week comparisons use this listed-price basis and are averages of observation rows.
- LT (Lead Time): the number of days until check-in. A booking curve tracks remaining OTA inventory toward the stay date; this article uses only observations at LT45 or less.
- Data sources: MetroEngines Research (lodging data); statistics from the Ministry of Internal Affairs and Communications (MIC), the Ministry of Health, Labour and Welfare (MHLW) and the Ministry of Economy, Trade and Industry (METI); published figures from Recruit Bridal Research Institute.
- — November is 14.4% of wedding venue sales: of ¥605.5 billion in wedding venue sales in 2025, November accounted for ¥87.0 billion, and October–November for 25.2% — an autumn peak on par with March–May (27.7%). Monthly marriage registrations (highest in July and March) are not a proxy for when ceremonies take place.
- — 8–18 guest-nights per wedding (assumption): an estimate applying out-of-town ratios of 15%, 25% and 35% to 52.0 invited guests (2024 survey), equal to 3.9–9.1 rooms at two guests per room. In Kyushu (68.8 guests), a 25% out-of-town ratio gives 17.2 guest-nights.
- — Saturdays are 85–95% full 45 days out: for city hotels on stay dates from October 8 to November 21, 2026 (OTA-listed inventory basis, estimated), Miyagi was at 95.1%, Hiroshima 85.3% and Kumamoto 86.8%, 4–12pt above Tuesday–Thursday.
- — 20 weddings on one day mean 130–260 rooms: at a 25% out-of-town ratio that is 260 guest-nights. Saturday rooms remaining 45 days out are about 57 in Miyagi, about 166 in Kumamoto and about 247 in Hiroshima, so whatever does not fit in the venue hotels spills over to nearby properties.
- — Saturday listed prices are 1.4–1.7× Tuesday–Thursday (October–November 2025, 5 cities). The opening for lodging-only properties lies in Friday pre-stays and Sunday post-stays, combined with shuttles and a group-booking desk.
Two Wedding Peaks — November Is 14.4% of the Year, a Different Pattern from Marriage Registrations
First, we want to establish when ceremonies actually take place, from the sales side. METI’s Current Survey on Selected Service Industries ended with the December 2024 data and was merged into the Ministry of Internal Affairs and Communications (MIC)’s Current Survey on Service Industries from January 2025, but that survey’s reference tables (sales by detailed industry classification of business activity) continue to carry monthly sales for the wedding venue industry. Lining up the 2025 monthly sales, November is the largest at ¥87.0 billion, followed by October at ¥65.3 billion, May at ¥62.7 billion and March at ¥56.9 billion, with troughs in August (¥33.6 billion) and January (¥29.1 billion). As shares of the annual total, November is 14.4%, October 10.8%, May 10.4% and March 9.4%, giving a clear two-peak shape: 25.2% in the two months of October–November and 27.7% in the three months of March–May.
This pattern has held in 2026. In the same reference tables, January–July 2026 totaled ¥325.6 billion, 2.9% above the same period a year earlier (¥316.5 billion). The start of the year was strong (January +10.3%, February +9.4%, March +3.2%), while the spring peak was roughly flat year on year (April −4.1%, May −0.2%). Figures for September–November, heading into the autumn peak, have not yet been published, but with the spring peak intact it is highly likely that wedding venue sales will again reach their annual high in October–November. The same shape appears on a count basis: in the former survey (METI, based on surveyed companies), 2024 handled 63,190 weddings for the year, of which November had 8,274 (13.1%) and October 7,191 (11.4%) — again the largest peak in autumn.
Source: compiled by HotelBank Editorial Team from the reference tables of the Ministry of Internal Affairs and Communications (MIC)’s Current Survey on Service Industries (sales by detailed industry classification of business activity). The former survey was merged in January 2025, so care is needed when comparing with 2024 and earlier (MIC note).
Monthly marriage counts, on the other hand, do not reflect the seasonality of ceremonies. In MHLW’s Preliminary Vital Statistics, there were 505,656 marriages in 2025 (+1.1% year on year); by month, July (58,764, 11.6%) and March (55,762, 11.0%) stand out, while November had 49,489 (9.8%) and October 41,891 (8.3%). Registration dates cluster around anniversaries such as July 7 and November 22 (“Good Couples Day”) and around the turn of the fiscal year, so they move on a different logic from ceremony dates. As an indicator for reading lodging demand, the pattern of venue sales should be used, not the number of registrations.
Source: compiled by HotelBank Editorial Team from the reference tables of the Ministry of Internal Affairs and Communications (MIC)’s Current Survey on Service Industries and MHLW’s Preliminary Vital Statistics (January–December 2025)
That said, it is worth noting that surveys asking couples about their ceremony month produce a different ranking. In Recruit Bridal Research Institute’s ” Marriage Market Survey 2025,” ceremony months were led by spring to early summer — June 14.0%, May 13.1%, April 12.4%, March 10.4%, October 9.1%, November 8.0% — which does not match the autumn peak in the sales statistics. This reflects differences in the survey period and respondent composition; this article uses the months in which sales were actually booked on the venue side.
| Area | 2025 marriages (preliminary) | of which Oct–Nov | 2024 Oct–Nov by registration month (final) |
|---|---|---|---|
| Miyagi | 8,331 | — | 1,436 (580 + 856) |
| Ishikawa | 3,950 | — | 705 (266 + 439) |
| Hiroshima | 10,408 | — | 1,655 (637 + 1,018) |
| Kagawa | 3,266 | — | 566 (204 + 362) |
| Kumamoto | 6,082 | — | 999 (397 + 602) |
| Sendai / Hiroshima / Kumamoto cities | 5,225 / 5,424 / 3,514 | — | — |
Source: compiled by HotelBank Editorial Team from MHLW’s Preliminary Vital Statistics, December 2025 (by prefecture and designated city, cumulative January–December 2025) and the 2024 final Vital Statistics (marriages by prefecture and month of registration). Preliminary figures include foreigners in Japan and are approximate; they do not match final figures.
Guest-Nights per Wedding — Applying Out-of-Town Ratios of 15%, 25% and 35% to 52.0 Guests
Next, we estimate how many guest-nights a single wedding generates, with the assumptions stated explicitly. For published guest counts, Recruit’s ” Zexy Wedding Trend Survey 2024 ” puts the national estimate of guests invited to a reception or wedding party at an average of 52.0 (105.9% of the previous survey, +2.9 people). By region, Miyagi/Yamagata averaged 50.7, Okayama/Hiroshima/Yamaguchi/Tottori/Shimane 48.1, Shikoku 50.3, Toyama/Ishikawa/Fukui 45.0 and Kyushu 68.8 — Kyushu stands out. The same institute’s “Marriage Market Survey 2025” has been reported as giving a national average of 57.2 (in an article in Kodansha’s Gendai Business), and guest counts continue to recover from 42.8 during the pandemic (2021 survey).
We could not find any published nationally representative statistic on the share of guests traveling from afar. This article therefore sets the share of guests who need lodging at three scenarios: 15%, 25% and 35%. These are assumptions — the share is higher for urban weddings where the two families’ hometowns are far apart, and lower when both are local. Stays are one night, and rooms are converted at two guests per room; if more guests stay one to a room, the room count can be up to double. On these premises, using the national figure of 52.0 guests, lodging per wedding is 7.8 guest-nights at 15%, 13.0 at 25% and 18.2 at 35% — 3.9–9.1 rooms at two guests per room.
| Invited-guest baseline (2024 survey) | 15% out-of-town | 25% out-of-town | 35% out-of-town |
|---|---|---|---|
| National estimate: 52.0 guests | 7.8 guest-nights / 3.9 rooms | 13.0 guest-nights / 6.5 rooms | 18.2 guest-nights / 9.1 rooms |
| Miyagi/Yamagata: 50.7 guests | 7.6 guest-nights / 3.8 rooms | 12.7 guest-nights / 6.3 rooms | 17.7 guest-nights / 8.9 rooms |
| Okayama/Hiroshima/Yamaguchi/Tottori/Shimane: 48.1 guests | 7.2 guest-nights / 3.6 rooms | 12.0 guest-nights / 6.0 rooms | 16.8 guest-nights / 8.4 rooms |
| Shikoku: 50.3 guests | 7.5 guest-nights / 3.8 rooms | 12.6 guest-nights / 6.3 rooms | 17.6 guest-nights / 8.8 rooms |
| Toyama/Ishikawa/Fukui: 45.0 guests | 6.8 guest-nights / 3.4 rooms | 11.2 guest-nights / 5.6 rooms | 15.8 guest-nights / 7.9 rooms |
| Kyushu: 68.8 guests | 10.3 guest-nights / 5.2 rooms | 17.2 guest-nights / 8.6 rooms | 24.1 guest-nights / 12.0 rooms |
Source: estimated by HotelBank Editorial Team from the national estimate and regional averages in Recruit’s Zexy Wedding Trend Survey 2024. Out-of-town ratios are assumptions; one-night stays, converted at two guests per room (double the rooms at one guest per room).
To stack these per-wedding figures onto a city’s Saturday requires a second assumption: how many receptions overlap in the city on the same day. This article uses three levels: 10, 20 and 30 weddings. Using the national figure (25% out-of-town, 13.0 guest-nights), that is 130 guest-nights for 10 weddings (65–130 rooms), 260 for 20 weddings (130–260 rooms) and 390 for 30 weddings (195–390 rooms). Using Kyushu’s 68.8 guests, the same out-of-town ratio gives 17.2 guest-nights per wedding, swelling to 344 guest-nights (172–344 rooms) for 20 weddings. These are purely combinations of assumptions, but compared with the city-hotel room counts in each city examined below (1,100–1,700 rooms), wedding-driven lodging on a single Saturday could amount to 10–20% of the covered rooms.
City Hotels in Sendai, Hiroshima and Kumamoto: Saturdays at 85–95% Occupancy (Listed-Inventory Basis) 45 Days Out
So how does Saturday inventory at city hotels — the typical wedding venues — move during the autumn wedding season? Using MetroEngines Research booking curves (remaining OTA inventory toward the stay date), we averaged stay dates from October 8 to November 21, 2026 by day of week for the prefectures where a fixed city-hotel set of 10 or more properties could be formed: Miyagi (10 properties / 1,172 rooms, based on listings on major booking sites), Hiroshima (14 properties / 1,683 rooms) and Kumamoto (11 properties / 1,255 rooms). Ishikawa and Kagawa have fewer than 10 covered city hotels, so no curve can be drawn and they are not covered in this section.
In Miyagi, the Saturday occupancy rate (OTA-listed inventory basis, estimated) had already reached 95.1% at LT45 (45 days out), 12pt above Tuesday–Thursday’s 83.1%. In Hiroshima (Saturday 85.3% vs. Tuesday–Thursday 81.6%) and Kumamoto (86.8% vs. 81.3%), the gap at 45 days out was 4–6pt, but as the stay date approaches Saturday alone thins out first, filling to 89.3% in Hiroshima and 93.4% in Kumamoto at LT30, and 95.2% and 94.9% respectively at LT14 (the LT14 Saturday figure covers two dates, October 10 and 17). In all three prefectures Friday sits between Saturday and Tuesday–Thursday (84–90% at LT45), leaving room for pre-stay demand. Actual results point the same way: Miyagi city hotels reached 98.3% on Saturday, September 12, and Kumamoto 97.1% on Saturday, September 26 — over 97% on ordinary, non-holiday Saturdays — so autumn Saturdays are structurally close to full. How Miyagi’s Saturday curve changes shape on an event date is traced from 45 days out in Sendai Tanabata 2026: Aug 8 Starts at 80.8% at T-45, Climbs Fastest.
Source: compiled by MetroEngines Research and HotelBank Editorial Team. Miyagi 10 properties / 1,172 rooms, Hiroshima 14 / 1,683, Kumamoto 11 / 1,255 (fixed sets of properties listing 30% or more of total rooms on OTAs, based on listings on major booking sites). Observations at LT45 or less only. Around LT14 the Saturday line averages two dates.
| Prefecture (coverage) | Day | LT45 | LT30 | LT14 | Listed price at LT45 |
|---|---|---|---|---|---|
| Miyagi (10 properties / 1,172 rooms) | Saturday | 95.1% | 94.7% | 95.0% | ¥36,323 |
| Friday | 89.6% | 92.1% | 90.4% | ¥24,237 | |
| Tue–Thu | 83.1% | 85.5% | 85.1% | ¥15,425 | |
| Sunday | 86.6% | 87.9% | 87.4% | ¥15,931 | |
| Hiroshima (14 properties / 1,683 rooms) | Saturday | 85.3% | 89.3% | 95.2% | ¥40,914 |
| Friday | 84.3% | 86.5% | 86.1% | ¥27,922 | |
| Tue–Thu | 81.6% | 83.6% | 86.3% | ¥26,020 | |
| Sunday | 82.3% | 84.5% | 85.2% | ¥26,439 | |
| Kumamoto (11 properties / 1,255 rooms) | Saturday | 86.8% | 93.4% | 94.9% | ¥28,825 |
| Friday | 86.6% | 89.6% | 87.2% | ¥22,311 | |
| Tue–Thu | 81.3% | 82.9% | 87.5% | ¥18,657 | |
| Sunday | 79.0% | 82.7% | 92.5% | ¥18,152 |
Source: compiled by MetroEngines Research and HotelBank Editorial Team. Occupancy is an estimate on an OTA-listed-inventory basis and differs from the property’s actual occupancy. Listed prices are two guests per room, tax included, average of all plans (estimates based on listing levels at the time of the survey). Averages of stay dates at LT45: 6 Saturdays, 7 Fridays, 19 Tuesday–Thursdays and 6 Sundays.
Rates — Saturday Listed Prices Are 1.4–1.7× Tuesday–Thursday; Estimated Transacted ADR Rises in Autumn in Kanazawa and Hiroshima
Saturdays, whose inventory thins first, also diverge sharply from weekdays on rates. For last year’s wedding season (October–November 2025), we averaged listed prices (two guests per room, tax included, all-plan average) by day of week for city hotels in five cities (at municipal level: 7 properties in Aoba Ward, Sendai; 4 in Kanazawa; 9 in Naka Ward, Hiroshima; 5 in Takamatsu; 8 in Chuo Ward, Kumamoto). Saturday was ¥40,100 in Aoba Ward, Sendai — 1.42× the Tuesday–Thursday average (¥28,100) — ¥48,200 (1.40×) in Naka Ward, Hiroshima and ¥38,200 (1.38×) in Chuo Ward, Kumamoto. Kanazawa reached ¥65,800 on Saturday (1.68×) and Takamatsu ¥47,200 (1.62×): the more a city overlaps with tourism demand, the higher the multiple. Friday was ¥31,200 in Sendai, ¥35,200 in Hiroshima and ¥29,200 in Kumamoto, 2–11% above Tuesday–Thursday. The Saturday on which wedding guests stay is one of the highest-rate nights of the year. Day-by-day prices on wedding dates themselves, tracked within 1km of wedding venues and overlaid with the rokuyo calendar and holidays, are analyzed in Japan Wedding Peak Nov 2026: Taian Saturdays Flat, Holidays +89%.
Source: compiled by MetroEngines Research and HotelBank Editorial Team. City hotels within each municipality (Aoba Ward, Sendai N=7; Kanazawa N=4; Naka Ward, Hiroshima N=9; Takamatsu N=5; Chuo Ward, Kumamoto N=8); average of observation rows from October 1 to November 30, 2025. Kanazawa has few properties and is for reference only.
Estimated transacted ADR (an estimate, tax-exclusive equivalent, applying category adjustments to the lowest plan level; monthly median) also rises in autumn in many cities. In 2025, Aoba Ward, Sendai was ¥12,400 in October and ¥13,100 in November (N=8); Kanazawa ¥18,100 and ¥20,600 (N=8); Naka Ward, Hiroshima ¥16,100 and ¥16,500 (N=7); Takamatsu ¥17,400 and ¥14,100 (N=5); and Chuo Ward, Kumamoto ¥9,200 and ¥9,500 (N=9). In September 2026, the most recent settled month, the figures were Sendai ¥14,500, Kanazawa ¥14,800, Hiroshima ¥14,700, Takamatsu ¥11,400 and Kumamoto ¥11,200; Kanazawa has a seasonal pattern of rising sharply from September into October–November, as in past years. October–November 2026 are estimates based on listing levels at the time of the survey (the two right-hand columns of the table below) and are on a different basis from settled months, so year-on-year changes are not shown.
| Ward / city (city hotels) | Oct 2025 | Nov 2025 | Sep 2026 | Oct 2026* | Nov 2026* |
|---|---|---|---|---|---|
| Aoba Ward, Sendai (N=8–9) | ¥12,419 | ¥13,076 | ¥14,469 | ¥15,478 | ¥14,762 |
| Kanazawa (N=8) | ¥18,124 | ¥20,574 | ¥14,762 | ¥18,011 | ¥19,586 |
| Naka Ward, Hiroshima (N=7) | ¥16,122 | ¥16,512 | ¥14,652 | ¥23,324 | ¥19,320 |
| Takamatsu (N=5–6) | ¥17,394 | ¥14,096 | ¥11,392 | ¥13,124 | ¥12,444 |
| Chuo Ward, Kumamoto (N=9) | ¥9,168 | ¥9,460 | ¥11,194 | ¥14,801 | ¥14,912 |
Source: compiled by MetroEngines Research and HotelBank Editorial Team. Estimated transacted ADR (tax-exclusive equivalent, monthly median). *October–November 2026 are estimates based on listing levels at the time of the survey and are on a different basis from settled months.
How Much Wedding-Driven Lodging Can Land on an Autumn Saturday?
To sum up so far: a quarter of the year’s ceremonies are concentrated in October–November, each wedding generates 8–18 guest-nights (assumption), and Saturdays at city hotels — the typical venues — are already 85–95% full 45 days out. Putting these three together gives a sense of scale for how much wedding-driven lodging can land on a Saturday. Converting Saturday availability at LT45 into rooms, the Miyagi city-hotel set (1,172 rooms) has about 57 rooms left, Hiroshima (1,683 rooms) about 247 and Kumamoto (1,255 rooms) about 166. Meanwhile, if 20 receptions were held in a city on the same day and each generated 13.0 guest-nights at the national 25% out-of-town ratio, that would be 260 guest-nights — demand for 130 rooms at two guests per room, or 260 rooms if most stay one to a room.
Sensitivity — Wedding-Driven Lodging on One Saturday by Number of Weddings × Out-of-Town Ratio
Moving the two assumptions — number of weddings and out-of-town ratio — at the same time gives the nine cases of wedding-driven lodging on one Saturday shown below. Invited guests are the national 52.0, stays are one night, and rooms are shown as a range from two guests per room to one guest per room.
| Receptions on the same day | 15% out-of-town | 25% out-of-town | 35% out-of-town |
|---|---|---|---|
| 10 weddings | 78 guest-nights (39–78 rooms) | 130 guest-nights (65–130 rooms) | 182 guest-nights (91–182 rooms) |
| 20 weddings | 156 guest-nights (78–156 rooms) | 260 guest-nights (130–260 rooms) | 364 guest-nights (182–364 rooms) |
| 30 weddings | 234 guest-nights (117–234 rooms) | 390 guest-nights (195–390 rooms) | 546 guest-nights (273–546 rooms) |
Source: estimated by HotelBank Editorial Team from the invited-guest count in Recruit’s Zexy Wedding Trend Survey 2024 (national estimate 52.0). Number of weddings and out-of-town ratios are assumptions; one-night stays; rooms converted at two guests per room to one guest per room.
At two guests per room, compared with Saturday availability 45 days out, 8 of the 9 cases exceed Miyagi’s remaining rooms (about 57); only one — 10 weddings at 15% out-of-town (39 rooms) — fits. In Kumamoto (about 166 rooms), three cases exceed availability: 20 weddings at 35%, and 30 weddings at 25% or more. In Hiroshima (about 247 rooms), one case does: 30 weddings at 35%. If many guests stay one to a room, the rooms needed can be up to double, and more combinations exceed availability.
In other words, in Miyagi the Saturday rooms left at city hotels 45 days out (about 57) cannot by this calculation hold the guest lodging of 20 weddings (130–260 rooms), and in Hiroshima and Kumamoto too, availability falls to around 60–80 rooms as the stay date nears (at LT14, about 81 in Hiroshima and about 64 in Kumamoto). So many guests who start looking for a room only after replying to the invitation one to two months before the ceremony will end up staying somewhere other than the venue hotel. This volume depends heavily on the two assumptions — number of weddings and out-of-town ratio — but even the conservative combination of 10 weddings at 15% out-of-town is 78 guest-nights (39–78 rooms), roughly the same scale as Miyagi’s Saturday availability. Wedding-driven lodging can be read as having a structure in which whatever does not fit in the venue hotels spills over to nearby lodging-focused properties.
In addition, with Saturday listed prices reaching 1.4–1.7× Tuesday–Thursday, the cost of staying at the venue hotel is a burden guests cannot ignore. In a Zexy survey of wedding guests, nearly 90% said they would want to attend without hesitation if consideration such as covering lodging costs or arranging hotels were offered, so there is also ample room for the couple to be involved in recommending where to stay. For nearby properties going after this demand, the key points will be distance from the venue, shuttles, and pricing designed for wedding guests.
The Opening for Lodging-Only Properties — Pre- and Post-Stays, Shuttles and a Group Desk
For lodging-focused business hotels and nearby ryokan, autumn Saturdays are already high-occupancy nights, so wedding demand is better understood not as “filling Saturdays anew” but as an opportunity to “extend length of stay around Saturday and lock in high-certainty bookings early on the highest-rate nights.” The data point to three openings. The first is Friday pre-stays: city hotels in the three prefectures are at 84–90% on Fridays at LT45, 0.2–5.5pt below Saturday, so inventory remains to match out-of-town guests arriving the day before. The second is Sunday post-stays: at 79–87%, Sunday is one of the days with the most headroom in the week, and can capture guests who combine sightseeing the next day. The third is that wedding bookings are confirmed two to three months before the ceremony, so high-certainty group bookings come in at the LT60–90 stage, letting properties build a Saturday base earlier than last-minute individual bookings.
Concrete measures include pre- and post-stay plans for wedding guests that state the distance and travel time from the venue, guidance on shuttles to the venue or taxi arrangements, timing set around early-morning kimono dressing and hair styling, and a group-booking desk that takes bulk inquiries from couples or venues. If a tie-up with a venue gets lodging information enclosed with the invitations, a property can be on guests’ list before they start looking. The higher Saturday rates are in a city, the more valuable the position of “more affordable than the venue hotel and close to the venue” becomes; in a market like Miyagi, where venue-hotel Saturday inventory thins 45 days out, whether a property is ready to absorb that spillover can change its autumn Saturday revenue.
There are caveats, however. The number of weddings and out-of-town ratios in this article are assumptions, and even within the same city the lodging ratio varies with the venue’s location (station-front or suburban) and the age mix of guests. Occupancy on a listed-inventory basis also counts unlisted rooms as sold, so it runs higher than actual occupancy. When considering how to capture wedding demand, the realistic approach is to confirm directly with venues the number of venues in the property’s catchment area and their ceremony calendar, and to apply the scale shown here to the property’s own room count.
Summary
Wedding venue sales in 2025 were 14.4% in November and 25.2% in October–November, and January–July 2026 held the spring peak, 2.9% above the same period a year earlier. Monthly marriage registrations cluster in July and March and are not a proxy for ceremonies; the indicator for reading lodging demand is the pattern of venue sales. Applying out-of-town ratios of 15–35% to 52.0 invited guests (2024 survey) gives 8–18 guest-nights per wedding, which on a Saturday with 20 overlapping weddings could equal 130–260 rooms. City hotels in Sendai, Hiroshima and Kumamoto are 85–95% full on Saturdays 45 days out, and listed prices open up to 1.4–1.7× Tuesday–Thursday, so wedding-driven lodging has a structure in which whatever does not fit in the venue hotels spills over to the surrounding area. For lodging-only properties, there remains an opening to capture that spillover early and with high certainty by combining Friday pre-stays and Sunday post-stays with shuttles and a group desk.
Frequently Asked Questions
Q. When are weddings most common?
Measured by venue sales, in autumn. In MIC statistics, November 2025 was the largest month for wedding venue sales at 14.4% of the year, and October–November together accounted for 25.2%, forming two peaks alongside March–May (27.7%). Marriage registrations are highest in July and March and move differently from ceremony dates.
Q. How much lodging does one wedding generate?
Taking the national average of 52.0 invited guests (Zexy Wedding Trend Survey 2024) and assuming 15%, 25% or 35% of guests travel from afar and need lodging, one wedding generates 7.8–18.2 guest-nights, or 3.9–9.1 rooms at two guests per room. In Kyushu, where invited guests are higher at 68.8, a 25% out-of-town ratio gives 17.2 guest-nights.
Q. How far ahead do city hotels fill up on autumn Saturdays?
Averaging stays from October 8 to November 21, 2026, Saturdays 45 days out had reached 95.1% in Miyagi, 85.3% in Hiroshima and 86.8% in Kumamoto (OTA-listed inventory basis, estimated), 4–12pt above Tuesday–Thursday. Hiroshima and Kumamoto fill to around 95% by 14 days out.
Q. How much higher are Saturday room rates than weekdays?
On city-hotel listed prices for October–November 2025 (two guests per room, tax included, all-plan average), Saturday was 1.38–1.68× Tuesday–Thursday: 1.42× in Aoba Ward, Sendai, 1.40× in Naka Ward, Hiroshima and 1.38× in Chuo Ward, Kumamoto, versus 1.68× in Kanazawa and 1.62× in Takamatsu, where tourism demand overlaps.
Q. How can lodging-focused properties capture wedding lodging demand?
The realistic approach is to offer wedding guests Friday pre-stays (84–90% at 45 days out) and Sunday post-stays (79–87%), which have more inventory headroom than Saturday, combined with guidance on distance and shuttles to the venue, timing set around early-morning kimono dressing, and a group-booking desk that takes bulk inquiries from couples or venues.
Related Articles
⚠ Note on data for future dates: The October–November 2026 occupancy rates (OTA-listed inventory basis, estimated), listed prices and estimated transacted ADR in this article are estimates based on sales status published on OTAs at the time of the survey (October 7, 2026), and will change as inventory is added and prices are adjusted closer to the stay dates. Guest-nights per wedding and the number of weddings are assumptions, not measurements.
References and Sources
■ Data sources
Monthly wedding venue sales are from the Ministry of Internal Affairs and Communications (MIC)’s Current Survey on Service Industries reference tables (January 2024 – July 2026); wedding counts from METI’s Current Survey on Selected Service Industries (2024); marriage counts from MHLW’s Preliminary Vital Statistics (2025) and final Vital Statistics (2024); invited-guest counts from Recruit’s Zexy Wedding Trend Survey 2024. Booking curves, day-of-week listed prices and estimated transacted ADR are from MetroEngines Research (city hotels).
■ Estimation assumptions
Guest-nights per wedding = invited guests × out-of-town ratio (assumed at 15%, 25% and 35%), one-night stays, rooms converted at two guests per room (up to double at one guest per room). The number of receptions overlapping in a city on the same Saturday (10, 20, 30) is also an assumption. Saturday availability = total rooms in each prefecture’s city-hotel set × (1 − estimated occupancy at 45 days out). Estimated transacted ADR is the property median of a tax-exclusive-equivalent estimate applying category adjustments to the lowest plan level; listed price is the all-plan average for two guests per room, tax included (average of observation rows).
■ Limitations
Out-of-town ratios and the number of weddings are set as assumptions because no nationally representative published statistics exist, and they vary greatly with venue location and guest composition. Estimated occupancy is on an OTA-listed-inventory basis and counts unlisted rooms as sold, so it runs higher than actual occupancy. October–November 2026 values are estimates as of the survey date (October 7, 2026) and will change before the stay dates. Ishikawa and Kagawa have fewer than 10 covered city hotels, so no booking curves are shown, and Kanazawa’s day-of-week prices are reference values from 4 properties.
- MIC Statistics Bureau, Current Survey on Service Industries — summary of results and reference tables (sales by detailed industry classification of business activity; through the July 2026 preliminary release)
- e-Stat: Current Survey on Service Industries — list of statistical tables
- e-Stat: Current Survey on Selected Service Industries, long-term time series — wedding venue industry sales, number of weddings handled, employees and establishments, monthly, actual values (table ID: 0004027639; METI; through December 2024)
- MHLW, Preliminary Vital Statistics (January–December 2025) / December 2025 (annual cumulative by prefecture and designated city)
- e-Stat: Vital Statistics, 2024 final data — Vol. 1, marriages and percentages by year and month of registration (table ID: 0003411836); Vol. 2, marriages by prefecture (special wards and designated cities restated) and month of registration (table ID: 0003411852)
- Recruit, Zexy Wedding Trend Survey 2024 (released October 25, 2024) / National estimate report PDF (invited guests, national and by region)
- Zexy article on the most popular wedding months — ceremony-month shares from Recruit Bridal Research Institute’s Marriage Market Survey 2025
- Gendai Business — report on the Marriage Market Survey 2025 national average of 57.2 invited guests (Kodansha)
- Zexy — article on a survey of out-of-town guests’ travel and lodging costs and willingness to attend
- MetroEngines Research — estimated transacted ADR (municipality × city hotels, April 2025 – November 2026); day-of-week listed prices (October–November 2025, city hotels in 5 municipalities, N=4–9); booking curves and occupancy (OTA-listed inventory basis, estimated; Miyagi 10 properties / Hiroshima 14 / Kumamoto 11; stays October 8 – November 21, 2026)