

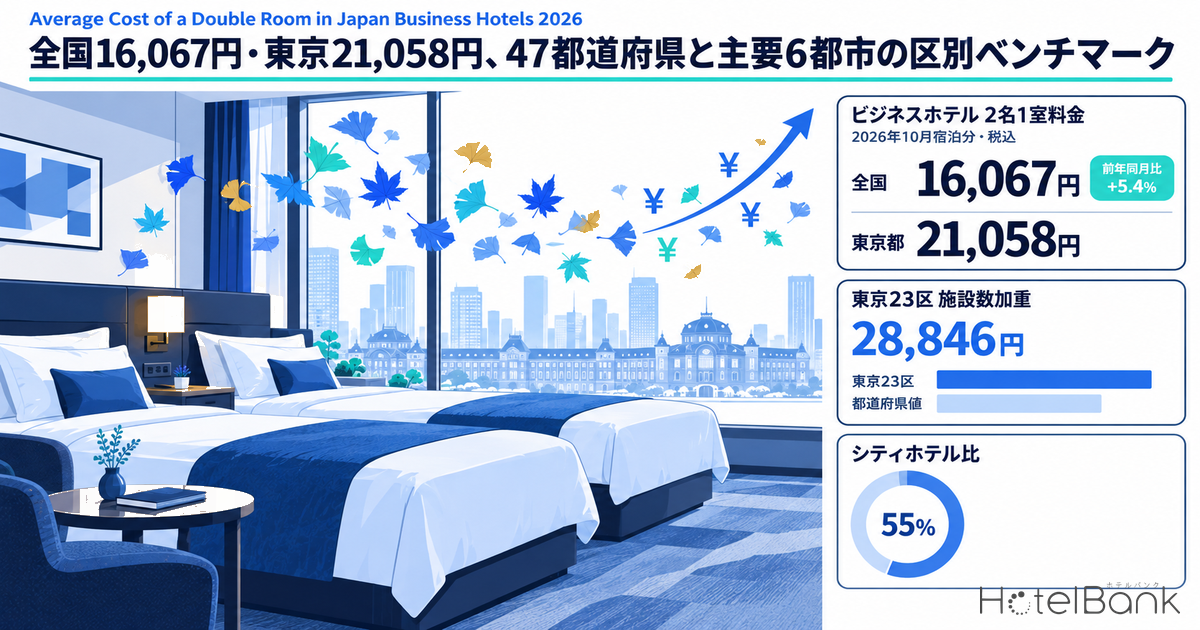
English-language searches for “average cost of a double room in Japan business hotels 2026” are rising, and this article answers that question directly with domestic data. In listed prices for stays in October 2026 compiled by the HotelBank Editorial Team, the business hotel rate for two guests in one room was ¥16,067 nationwide (7,666 properties) and ¥21,058 in Tokyo (959 properties). Prefecture figures, however, are equal-weighted averages of the municipalities within each prefecture, so the level actually sold around central terminal stations is higher: a simple average of the 21 Tokyo wards with listings comes to ¥26,001, and a property-weighted average comes to ¥28,846. This article breaks the two-guest room rate down into the 47-prefecture ranking, ward-level figures for Tokyo, Osaka, Nagoya, Fukuoka, Sapporo and Kyoto, its position relative to city hotels and capsule hotels, and the mark-up from one-guest to two-guest occupancy within the same property, as input for pricing aimed at two-guest demand.
Metric Definitions Used in This Article
- Two-guest room rate (double room equivalent): the listed price per room (tax included) for two guests sharing one room. Our aggregation does not distinguish room types (double / twin / semi-double), so the two-guest room rate is treated as a double room equivalent. It is the average across all plans, from room-only to meal-inclusive, aggregated at municipality level from each property’s daily listed prices; prefecture values are equal-weighted averages of those municipalities. Taxes collected separately by local governments, such as accommodation tax and bathing tax, are not included.
- One-guest rate: used only in the section on the one-guest → two-guest mark-up. It is the lowest listed price (tax included, per room) for property/stay-date combinations that list both one-guest and two-guest occupancy, so it is on a different basis from the all-plan averages used elsewhere in this article.
- Listed prices vs. estimated settled ADR: every figure in this article is a listed price publicly displayed on OTAs and similar channels. It is a different metric from the estimated settled ADR used in other HotelBank articles (an estimate on a tax-excluded basis, derived from the cheapest-plan level with a segment-specific adjustment). The two are not mixed here.
- Coverage: of the roughly 168,000 properties in Japan tracked by MetroEngines Research, the roughly 27,000 confirmed as active on OTAs. October 2026 figures reflect listings as of the survey date (October 7, 2026) and will shift as stay dates approach.
- Data source: HotelBank Editorial Team research (MetroEngines Research)
- — ¥16,067 nationwide, ¥21,058 in Tokyo: listed business hotel price for two guests in one room for October 2026 stays (tax included, per room, N=7,666 properties). The national figure is +5.4% year on year.
- — A 2.1x spread across the 47 prefectures: Nara leads at ¥24,049 (32 properties) and Tokushima is lowest at ¥11,489. Only 19 prefectures exceed the national figure, and the median is ¥15,503.
- — Prefecture values are equal-weighted municipal averages: the property-weighted figure for Tokyo’s 23 wards (21 wards with listings, 877 properties) is ¥28,846, 1.37x the prefecture value. Fukuoka City’s Hakata and Chuo wards run at 1.8x the prefecture value.
- — Business hotels sit at 55% of city hotels nationally: by prefecture the ratio ranges from 21% (Okinawa) to 114% (Kochi), so national benchmarks need to be re-applied city by city.
- — The median one-guest → two-guest mark-up is +13.9% in Tokyo, +19.6% in Kyoto and +20.2% in Osaka, versus +28.1% in Fukuoka, +30.8% in Aichi and +32.1% in Hokkaido (same-property comparison, October 14–20).
¥16,067 Nationwide, ¥21,058 in Tokyo: The Direct Answer and How to Read It
First, the basis. The “two-guest room rate” in this article is the listed price per room (tax included) when two people share one room. Because the aggregation does not separate doubles from twins, this per-room amount is the figure that corresponds to the “average price of a double room” English-language readers are looking for. Split per person, it works out to about ¥8,030 nationwide and about ¥10,530 in Tokyo.
The national figure of ¥16,067 is +5.4% against ¥15,244 for the same month a year earlier (October 2025 stays). The number of properties covered grew from 6,896 to 7,666, so the increase comes even after new openings and wider listing coverage were added to the sample. October 2026 figures reflect listings as of the survey date, however, and will move with inventory added and prices adjusted close to the stay date. This forward-month caveat applies to every October figure in this article.
For general travelers, we cover the business hotel two-guest rate and how to choose a room type on the same basis in a separate article. This article is its counterpart for operators and investors, focusing on the breakdown needed for pricing: the full 47-prefecture ranking, ward-level figures for major cities, positioning across categories, and the one-guest → two-guest mark-up. ADR on a one-guest basis is covered in Business Hotel Price Surge: National ADR Analysis & 10 Cost-Effective Prefectures, but because the basis differs, those figures cannot be compared directly with the ones here.
47-Prefecture Ranking: Nara, Kyoto and Tokyo at the Top; Tokushima, Miyazaki and Kagoshima at the Bottom
Ranking the 47 prefectures by business hotel two-guest room rate, Nara leads at ¥24,049 (32 properties), followed by Kyoto at ¥21,942 (348 properties), Tokyo at ¥21,058 (959 properties), Kochi at ¥20,219 (62 properties) and Nagano at ¥19,724 (165 properties). At the bottom are Tokushima at ¥11,489 (72 properties), Miyazaki at ¥12,297 and Kagoshima at ¥12,655, giving a 2.1x gap between top and bottom. Only 19 prefectures exceed the national figure of ¥16,067, and the 47-prefecture median of ¥15,503 sits below the national figure. Urban areas with many properties are pulling the national figure up.
Nara’s sample is small at 32 properties, so its value can move on a single property’s pricing and should be read with that in mind. The three largest metro areas, meanwhile, look strikingly different from one another. Kyoto and Tokyo are above ¥20,000, while Osaka is at ¥14,411 (529 properties), Fukuoka at ¥14,510 (347 properties) and Aichi at ¥16,683 (311 properties), around or below the national figure. This largely reflects the fact that prefecture values are equal-weighted municipal averages; as the next section shows, central wards look quite different.
Source: HotelBank Editorial Team research (MetroEngines Research)
The year-on-year column is shown alongside. Against +5.4% nationally, Aomori is up a large +35.2%, which can be read as lodging demand for the 80th National Sports Festival (Aomori National Sports Festival “Ao no Kirameki”), whose main session runs October 10–20, 2026, being reflected in listed prices. Aichi (+15.9%) and Nagano (+17.7%) also rose by double digits. Osaka, by contrast, is the only prefecture with a double-digit decline at -20.5%, but its comparison month of October 2025 included the closing days of Expo 2025 Osaka, Kansai (closed October 13), so it is reasonable to view last year’s level as exceptional. There are also small declines, such as Hokkaido at -3.8% and Shiga at -6.1%.
| Rank | Prefecture | Business hotel 2 guests / room (tax incl.) | Properties | YoY | City hotel 2 guests / room (properties) | Business ÷ city | Capsule 2 guests (properties) |
|---|---|---|---|---|---|---|---|
| — | Nationwide | ¥16,067 | 7666 | +5.4% | ¥29,118 (1293) | 55% | ¥17,737 (103) |
| 1 | Nara | ¥24,049 | 32 | +53.5% | ¥31,869 (8) | 75% | — |
| 2 | Kyoto | ¥21,942 | 348 | +5.4% | ¥44,146 (65) | 50% | ¥21,115 (5) |
| 3 | Tokyo | ¥21,058 | 959 | +8.3% | ¥57,870 (117) | 36% | ¥15,433 (33) |
| 4 | Kochi | ¥20,219 | 62 | +3.4% | ¥17,715 (6) | 114% | — |
| 5 | Nagano | ¥19,724 | 165 | +17.7% | ¥27,245 (17) | 72% | — |
| 6 | Aomori | ¥19,526 | 79 | +35.2% | ¥26,904 (13) | 73% | — |
| 7 | Hokkaido | ¥17,797 | 409 | -3.8% | ¥24,637 (76) | 72% | ¥29,633 (6) |
| 8 | Okinawa | ¥17,641 | 205 | +10.2% | ¥83,902 (16) | 21% | ¥14,412 (4) |
| 9 | Ishikawa | ¥17,495 | 114 | +12.5% | ¥22,834 (10) | 77% | — |
| 10 | Kanagawa | ¥17,281 | 211 | +4.6% | ¥32,780 (42) | 53% | ¥12,142 (3) |
| 11 | Okayama | ¥16,962 | 99 | +5.2% | ¥29,719 (17) | 57% | — |
| 12 | Gifu | ¥16,769 | 119 | -3.2% | ¥27,712 (12) | 61% | — |
| 13 | Aichi | ¥16,683 | 311 | +15.9% | ¥49,081 (28) | 34% | ¥26,544 (4) |
| 14 | Iwate | ¥16,662 | 80 | +16.8% | ¥18,694 (19) | 89% | — |
| 15 | Akita | ¥16,594 | 56 | +6.8% | ¥31,421 (16) | 53% | — |
| 16 | Fukui | ¥16,419 | 45 | -0.2% | ¥28,142 (15) | 58% | — |
| 17 | Chiba | ¥16,321 | 165 | +8.2% | ¥23,588 (53) | 69% | ¥14,423 (4) |
| 18 | Yamagata | ¥16,312 | 65 | +0.7% | ¥22,525 (11) | 72% | — |
| 19 | Hiroshima | ¥16,266 | 181 | +8.9% | ¥28,301 (31) | 57% | — |
| 20 | Kagawa | ¥15,941 | 95 | +8.5% | ¥25,852 (12) | 62% | ¥17,217 (3) |
| 21 | Shimane | ¥15,928 | 54 | +9.9% | ¥20,527 (10) | 78% | — |
| 22 | Tottori | ¥15,801 | 48 | +4.5% | ¥23,397 (8) | 68% | — |
| 23 | Gunma | ¥15,592 | 96 | +11.0% | ¥22,936 (13) | 68% | — |
| 24 | Yamanashi | ¥15,503 | 76 | -0.4% | ¥50,349 (3) | 31% | — |
| 25 | Oita | ¥15,124 | 85 | +2.8% | ¥23,484 (15) | 64% | — |
| 26 | Hyogo | ¥15,068 | 167 | +3.7% | ¥25,824 (50) | 58% | — |
| 27 | Niigata | ¥15,028 | 121 | +6.5% | ¥21,324 (18) | 70% | — |
| 28 | Wakayama | ¥15,011 | 70 | +3.9% | ¥19,760 (7) | 76% | — |
| 29 | Miyagi | ¥14,990 | 138 | +7.2% | ¥20,494 (21) | 73% | — |
| 30 | Fukushima | ¥14,769 | 136 | +3.0% | ¥23,167 (16) | 64% | — |
| 31 | Shizuoka | ¥14,709 | 227 | +6.6% | ¥39,125 (31) | 38% | ¥10,418 (3) |
| 32 | Ibaraki | ¥14,682 | 179 | -0.7% | ¥21,481 (18) | 68% | — |
| 33 | Fukuoka | ¥14,510 | 347 | +7.7% | ¥33,203 (43) | 44% | ¥18,399 (7) |
| 34 | Shiga | ¥14,442 | 78 | -6.1% | ¥28,638 (11) | 50% | — |
| 35 | Osaka | ¥14,411 | 529 | -20.5% | ¥26,101 (97) | 55% | ¥14,504 (8) |
| 36 | Kumamoto | ¥14,272 | 122 | +7.3% | ¥27,065 (19) | 53% | ¥13,351 (3) |
| 37 | Nagasaki | ¥14,060 | 123 | +6.0% | ¥29,701 (25) | 47% | — |
| 38 | Saitama | ¥14,048 | 147 | +1.6% | ¥21,013 (12) | 67% | — |
| 39 | Toyama | ¥13,986 | 68 | +1.0% | ¥15,702 (16) | 89% | — |
| 40 | Saga | ¥13,545 | 48 | +2.9% | ¥23,782 (9) | 57% | — |
| 41 | Mie | ¥13,473 | 89 | +7.1% | ¥21,758 (15) | 62% | — |
| 42 | Yamaguchi | ¥13,271 | 94 | +4.2% | ¥17,622 (10) | 75% | — |
| 43 | Tochigi | ¥13,151 | 132 | +0.2% | ¥27,693 (15) | 47% | — |
| 44 | Ehime | ¥12,794 | 101 | +4.4% | ¥16,670 (23) | 77% | — |
| 45 | Kagoshima | ¥12,655 | 149 | +2.4% | ¥24,970 (25) | 51% | — |
| 46 | Miyazaki | ¥12,297 | 83 | +4.9% | ¥19,872 (16) | 62% | — |
| 47 | Tokushima | ¥11,489 | 72 | +0.7% | ¥16,222 (10) | 71% | — |
October 2026 stays; listed price per room for two guests in one room (tax included). Prefecture value = equal-weighted average of the aggregated values for each municipality in the prefecture. Year-on-year change compares with October 2025 stays on the same basis; October 2026 is based on listings as of the survey date (October 7, 2026). Capsule hotel two-guest rates include cases where berths/cabins for two people are listed as a single item.
Source: HotelBank Editorial Team research (MetroEngines Research)
Prefecture Values Are Equal-Weighted Municipal Averages: Tokyo’s 23 Wards Average ¥26,001, Central Wards Exceed ¥30,000
To avoid misreading prefecture values, we line up ward-level figures for six major cities on the same basis. Tokyo’s figure of ¥21,058 is an equal-weighted average that includes not only the 23 wards but also the cities and towns of the Tama area. Narrowing to the 21 of the 23 wards with listings from at least 3 properties (877 properties in total), the simple average is ¥26,001, rising to ¥28,846 when weighted by property count. The highest is Shibuya at ¥47,746 (26 properties), followed by Chuo at ¥33,337 (132 properties) and Minato at ¥32,721 (101 properties); Taito, which has the most properties (180), is at ¥28,342. On this calculation the central wards line up in a band of 1.4x to 2.3x the prefecture value. On a different basis from this article (estimated settled ADR), Tokyo Business Hotel ADR 12-Month Trend: 30% Central vs Outer Ward Gap tracks how the price gap between the five central wards and the 18 outer wards moved over 12 months.
Source: HotelBank Editorial Team research (MetroEngines Research)
The same thing happens in other cities. Against Fukuoka Prefecture’s value of ¥14,510, Hakata Ward is at ¥26,231 and Fukuoka City’s Chuo Ward at ¥26,328, 1.8x the prefecture level, while Kitakyushu’s Kokurakita Ward at ¥13,411 pulls the prefecture value down. Osaka City’s Chuo Ward is at ¥20,488 against Osaka Prefecture’s ¥14,411; Nagoya’s Nakamura Ward is at ¥23,786 against Aichi’s ¥16,683; and Kyoto’s Higashiyama Ward is at ¥38,372 against Kyoto Prefecture’s ¥21,942. If you use a prefecture value as a benchmark, always set the value for your own ward beside it; looking only at the prefecture value leads centrally located properties to underestimate their position.
Weighting ward values by property count gives the “effective city level”: Kyoto ¥31,464, Tokyo ¥28,846, Fukuoka ¥24,298, Nagoya ¥22,690, Sapporo ¥20,740 and Osaka ¥17,241 (each combines the wards in the tables below; Fukuoka includes Kitakyushu’s wards and Osaka includes Sakai Ward in Sakai City). The most practically useful difference in this aggregation is that Fukuoka (¥14,510), below the national figure on a prefecture basis, and Aichi (¥16,683), at about the national level, move well above the national figure on a ward basis.
| Ward | Business hotel, 2 guests / room | Properties | vs. prefecture value | City hotels in same ward (properties) |
|---|---|---|---|---|
| Shibuya | ¥47,746 | 26 | 2.27x | ¥71,154 (4) |
| Chuo | ¥33,337 | 132 | 1.58x | ¥72,840 (22) |
| Minato | ¥32,721 | 101 | 1.55x | ¥80,529 (27) |
| Sumida | ¥29,758 | 24 | 1.41x | ¥44,060 (5) |
| Chiyoda | ¥29,591 | 66 | 1.41x | ¥62,411 (12) |
| Shinjuku | ¥29,412 | 85 | 1.40x | ¥59,515 (12) |
| Setagaya | ¥28,901 | 4 | 1.37x | — |
| Taito | ¥28,342 | 180 | 1.35x | — |
| Meguro | ¥27,658 | 10 | 1.31x | — |
| Koto | ¥27,486 | 30 | 1.31x | ¥35,759 (7) |
| Shinagawa | ¥24,667 | 29 | 1.17x | ¥32,840 (3) |
| Bunkyo | ¥24,160 | 14 | 1.15x | — |
| Ota | ¥22,733 | 50 | 1.08x | ¥38,050 (6) |
| Arakawa | ¥22,646 | 11 | 1.08x | — |
| Toshima | ¥22,459 | 57 | 1.07x | ¥43,329 (4) |
| Edogawa | ¥21,352 | 17 | 1.01x | — |
| Suginami | ¥21,343 | 5 | 1.01x | — |
| Adachi | ¥21,174 | 6 | 1.01x | — |
| Kita | ¥19,614 | 20 | 0.93x | — |
| Katsushika | ¥16,663 | 6 | 0.79x | — |
| Itabashi | ¥14,248 | 4 | 0.68x | — |
| Ward | Business hotel, 2 guests / room | Properties | vs. prefecture value | City hotels in same ward (properties) |
|---|---|---|---|---|
| Chuo | ¥20,488 | 163 | 1.42x | ¥27,448 (25) |
| Fukushima | ¥19,967 | 5 | 1.39x | — |
| Konohana | ¥19,231 | 5 | 1.33x | ¥49,349 (5) |
| Suminoe | ¥18,185 | 5 | 1.26x | — |
| Naniwa | ¥17,701 | 57 | 1.23x | ¥40,506 (5) |
| Kita | ¥17,451 | 58 | 1.21x | ¥40,421 (19) |
| Higashiyodogawa | ¥17,185 | 8 | 1.19x | — |
| Miyakojima | ¥15,902 | 9 | 1.10x | — |
| Nishi | ¥15,745 | 29 | 1.09x | — |
| Minato | ¥15,521 | 10 | 1.08x | — |
| Yodogawa | ¥14,369 | 31 | 1.00x | ¥17,234 (8) |
| Tennoji | ¥13,478 | 23 | 0.94x | ¥42,418 (3) |
| Sakai | ¥11,042 | 12 | 0.77x | ¥14,688 (4) |
| Abeno | ¥10,393 | 3 | 0.72x | ¥29,395 (3) |
| Nishinari | ¥9,100 | 31 | 0.63x | — |
| Ward | Business hotel, 2 guests / room | Properties | vs. prefecture value | City hotels in same ward (properties) |
|---|---|---|---|---|
| Nakamura | ¥23,786 | 63 | 1.43x | ¥37,339 (5) |
| Naka | ¥22,381 | 75 | 1.34x | ¥62,873 (8) |
| Atsuta | ¥19,644 | 3 | 1.18x | — |
| Higashi | ¥18,659 | 4 | 1.12x | — |
| Nakagawa | ¥17,555 | 4 | 1.05x | — |
| Ward | Business hotel, 2 guests / room | Properties | vs. prefecture value | City hotels in same ward (properties) |
|---|---|---|---|---|
| Chuo | ¥26,328 | 73 | 1.81x | ¥49,695 (12) |
| Hakata | ¥26,231 | 138 | 1.81x | ¥51,176 (10) |
| Higashi | ¥22,883 | 4 | 1.58x | — |
| Moji | ¥14,032 | 5 | 0.97x | — |
| Kokurakita | ¥13,411 | 23 | 0.92x | ¥28,231 (4) |
| Wakamatsu | ¥11,070 | 3 | 0.76x | — |
| Yahatanishi | ¥10,749 | 5 | 0.74x | — |
| Ward | Business hotel, 2 guests / room | Properties | vs. prefecture value | City hotels in same ward (properties) |
|---|---|---|---|---|
| Kita | ¥21,081 | 18 | 1.18x | ¥23,538 (3) |
| Chuo | ¥21,001 | 107 | 1.18x | ¥31,626 (27) |
| Nishi | ¥16,079 | 3 | 0.90x | — |
| Shiroishi | ¥14,045 | 3 | 0.79x | — |
| Ward | Business hotel, 2 guests / room | Properties | vs. prefecture value | City hotels in same ward (properties) |
|---|---|---|---|---|
| Higashiyama | ¥38,372 | 28 | 1.75x | ¥72,756 (7) |
| Nakagyo | ¥32,404 | 84 | 1.48x | ¥64,804 (11) |
| Shimogyo | ¥31,359 | 126 | 1.43x | ¥53,856 (23) |
| Minami | ¥29,111 | 53 | 1.33x | ¥38,214 (5) |
| Sakyo | ¥28,567 | 5 | 1.30x | — |
| Kamigyo | ¥27,110 | 4 | 1.24x | — |
| Ukyo | ¥22,887 | 3 | 1.04x | ¥38,066 (4) |
| Fushimi | ¥16,097 | 5 | 0.73x | — |
October 2026 stays; listed price per room for two guests in one room (tax included). Wards with fewer than 3 properties are excluded.
Source: HotelBank Editorial Team research (MetroEngines Research)
Positioning Against City and Capsule Hotels: Business Hotels Sit at 55% of City Hotels Nationally
We place city hotels and capsule hotels for the same month alongside, on the same two-guest-per-room basis. Nationally, business hotels sit at 55% of city hotels at ¥29,118 (1,293 properties), while capsule hotels at ¥17,737 (103 properties) come in above business hotels. Capsule two-guest rates include cases where berths or cabins for two people are listed as a single item, so they are better read as a guide to “the total for two people to stay” than compared directly as a per-room rate.
The business ÷ city ratio varies widely by prefecture. Tokyo is ¥21,058 ÷ ¥57,870 = 36%, Kyoto 50% and Okinawa 21%: the more a region’s city hotels sit in a resort or luxury price band, the wider their distance from business hotels. Kochi, by contrast, is at 114%, with business hotels above city hotels, showing that in some regions location and actual room product, rather than the category label, set the price. Across all 47 prefectures the ratio is scattered from 21% to 114%, so the national rule of thumb that “business hotels are a little over half of city hotels” needs to be re-applied city by city.
Source: HotelBank Editorial Team research (MetroEngines Research)
From an operating perspective, the higher this ratio, the closer business hotel two-guest rates come to the lower end of city hotels, putting both categories on the same shortlist for two-guest travelers. In regions with a low ratio, such as Fukuoka (44%) and Aichi (34%), business hotels can be read as having relatively more room to raise prices on rooms for two.
One-Guest → Two-Guest Mark-up: Tokyo Median +14%, Hokkaido and Aichi in the +30% Range
The practical question in designing a two-guest room rate is “the difference between selling the same room to one guest and to two.” For this section only we switch basis, pairing the lowest listed prices of business hotels that listed both one-guest and two-guest occupancy for the same property and stay date, for stays from October 14 to 20, 2026 (paired comparison). This is a separate aggregation from the all-plan averages in the previous sections, so please do not compare the amounts directly.
The results split clearly by region. In Tokyo (594 properties, 4,101 pairs) the median mark-up is +13.9%, with Kyoto at +19.6% and Osaka at +20.2%: in the centers of the three largest metro areas, the typical design adds 10–20% to the one-guest rate. Hokkaido at +32.1%, Aichi at +30.8% and Fukuoka at +28.1%, by contrast, have a median design that adds around 30% for two guests. The small mark-up in Tokyo likely reflects a one-guest median that is already high at ¥13,500, and the many properties that sell double-bed rooms at a flat room rate whether occupied by one or two guests.
Source: Metro Engines, Inc.; compiled by the HotelBank Editorial Team
Looking at the distribution, 26% of combinations in Tokyo have a mark-up of +5% or less, meaning they sell at almost the same room rate for one or two guests. In Hokkaido and Aichi this share is only 11% and 10%, and the +20–50% band is the thickest. Combinations where the two-guest price is at least 1.5x the one-guest price account for 30% in Hokkaido and 28% in Aichi, suggesting a regional mix of twin-led properties that price each room type separately and properties that sell singles and doubles at a single room rate.
| Prefecture | 1 guest, lowest (median) | 2 guests, lowest (median) | 1 → 2 guests median mark-up | ≤+5% | +5–20% | +20–50% | ≥+50% | Sample |
|---|---|---|---|---|---|---|---|---|
| Tokyo | ¥13,500 | ¥15,800 | +13.9% | 26% | 36% | 26% | 11% | 594 properties / 4101 pairs |
| Kyoto | ¥13,380 | ¥16,200 | +19.6% | 31% | 19% | 24% | 26% | 140 properties / 941 pairs |
| Osaka | ¥7,509 | ¥9,112 | +20.2% | 22% | 27% | 34% | 16% | 284 properties / 1953 pairs |
| Fukuoka | ¥8,500 | ¥11,100 | +28.1% | 15% | 21% | 44% | 21% | 223 properties / 1547 pairs |
| Aichi | ¥8,400 | ¥12,000 | +30.8% | 10% | 22% | 40% | 28% | 213 properties / 1437 pairs |
| Hokkaido | ¥7,994 | ¥11,000 | +32.1% | 11% | 20% | 38% | 30% | 280 properties / 1936 pairs |
October 14–20, 2026 stays; only business hotel combinations of property and stay date with listings for both one-guest and two-guest occupancy (paired comparison). Prices are the lowest listed price for each combination (tax included, per room). Mark-up = lowest two-guest price ÷ lowest one-guest price − 1. The four distribution bands are shares of the number of combinations. This table uses a different basis from the prefecture and ward tables in this article (all-plan averages), so the amounts should not be compared directly.
Source: Metro Engines, Inc.; compiled by the HotelBank Editorial Team
Implications for Operators: Pricing in Areas with Strong Two-Guest Demand
Let us organize these figures as input for pricing aimed at two-guest demand. First, hold benchmarks at ward level, not prefecture level. In locations such as Fukuoka’s Hakata Ward or Nagoya’s Nakamura Ward, which look below or near the national figure on a prefecture basis but sit in the ¥23,000–26,000 range on a ward basis, using the prefecture value as the reference sets the two-guest rate too low. It is effective to place your own ward’s value next to the value for city hotels in the same ward, and to set price bands with an eye to which category two-guest travelers are comparing you against.
Second, the one-guest → two-guest mark-up has more room to be set “to match the make-up of your own two-guest demand” than “to match the regional market.” Independent inbound travel and domestic couples and friends traveling together are basically two-guest demand. In the Japan Tourism Agency’s Overnight Travel Statistics Survey (first preliminary figures for August 2026), foreign guest nights were 12.64 million, and the Japan National Tourism Organization estimates about 3.1 million international visitors in the same month, with Korea, Taiwan and Hong Kong growing even as the China market shrinks. In cities with such strong two-guest demand, a design that sells to one or two guests at the same room rate (Tokyo’s median +14%) has an advantage in capturing occupancy, while a design that sells larger twin or double rooms at +20–30% for two guests (the Hokkaido and Aichi medians) is structured to raise per-room revenue from two-guest travelers without losing one-guest business demand. Rather than one being right, the largest revenue opportunity probably lies in moving the mark-up on days of the week and stay dates when the two-guest share rises.
Table 9 restates this second point in numbers. Setting the one-guest rate at 100, it shows average revenue per room sold as an index on two axes: the two-guest share of rooms sold on a stay date and the one-guest → two-guest mark-up (average revenue per room sold = 100 × (1 + two-guest share × mark-up)). Raising the mark-up from +14% to +30% on a day with a 20% two-guest share moves the index only 3.2 points, from 102.8 to 106.0, but on a day with an 80% two-guest share it moves 12.8 points, from 111.2 to 124.0. Leaving the mark-up at +14%, even an 80% two-guest share yields only 111.2, short of the 115.0 for a +30% design at a 50% two-guest share. The relationship shows that revising the mark-up has a larger effect the more it is concentrated on days with a high two-guest share.
| Two-guest share \ mark-up | +5% | +14% (Tokyo) | +20% | +30% (Hokkaido / Aichi) | +50% |
|---|---|---|---|---|---|
| 20% | 101.0 | 102.8 | 104.0 | 106.0 | 110.0 |
| 35% | 101.8 | 104.9 | 107.0 | 110.5 | 117.5 |
| 50% | 102.5 | 107.0 | 110.0 | 115.0 | 125.0 |
| 65% | 103.2 | 109.1 | 113.0 | 119.5 | 132.5 |
| 80% | 104.0 | 111.2 | 116.0 | 124.0 | 140.0 |
Estimate. Index with the one-guest rate = 100; average revenue per room sold = 100 × (1 + two-guest share × mark-up). The mark-up columns include rounded levels of the Table 8 medians (Tokyo +13.9%, Hokkaido +32.1%, Aichi +30.8%). Occupancy and two-guest share are assumed not to change when the mark-up changes; price elasticity is not modeled.
Third, how the two-guest room rate is displayed. English-language searchers look for “the price of a double room” per room and tax included. Stating clearly on English rate pages that accommodation tax is charged separately and that plans differ by whether breakfast is included makes prices less likely to be misread when two-guest travelers compare options. In Kyoto City, accommodation tax moved to five tiers from ¥200 to ¥10,000 per person per night in March 2026, so even a business hotel at ¥20,000-plus for two guests in one room incurs a separate ¥800 tax per room. Tokyo currently charges ¥100 or ¥200 per person per night (exempt below ¥10,000), with a shift to a flat 3% rate scheduled from April 2027. The higher a city’s two-guest room rate, the more the tax-inclusive total affects how it looks in international comparisons, which is worth keeping in mind.
Frequently Asked Questions
Q. Is the “two-guest room rate” in this article the price of a double room or a twin room?
Both. The aggregation does not distinguish room types and averages the listed prices of rooms bookable for two guests, so the value is a “double room equivalent” that mixes doubles, semi-doubles and twins. In general, semi-doubles form the lower end of the price range and twins and larger doubles the upper end.
Q. Are taxes and service charges included?
Consumption tax is included (tax-inclusive listed prices). Taxes collected separately by local governments, such as accommodation tax and bathing tax, are not included. Business hotels rarely charge a separate service charge; it is generally included in the listed price.
Q. How much accommodation tax is added?
It varies by municipality. In Tokyo it is ¥100 when the room charge per person per night is ¥10,000 or more but less than ¥15,000, and ¥200 at ¥15,000 or more (exempt below ¥10,000), with a shift to a flat 3% rate scheduled from April 2027. Kyoto City has five tiers from ¥200 to ¥10,000 per person per night since March 2026. Osaka Prefecture, Fukuoka Prefecture and Hokkaido (Kutchan Town), among others, also levy accommodation tax, and for two guests in one room it is added for each person.
Q. Should I use the prefecture value or the ward value?
Use ward values to compare properties near central terminal stations. Prefecture values are equal-weighted averages of the municipalities in the prefecture and include suburbs and regional cities, so they come out lower than the actual central level.
Q. Can I find the rate for a single traveler from these tables?
No. Only the paired comparison in the one-guest → two-guest mark-up section deals with lowest listed prices for one guest; all other tables are all-plan averages for two guests in one room. Because the bases differ, avoid comparing amounts across tables.
Summary
The business hotel rate for two guests in one room for October 2026 stays was ¥16,067 nationwide and ¥21,058 in Tokyo, up +5.4% year on year nationally. In the 47-prefecture ranking, Nara, Kyoto and Tokyo are at the top and Tokushima, Miyazaki and Kagoshima at the bottom, with a 2.1x gap. Because prefecture values are equal-weighted municipal averages, the central level needs to be read separately: Tokyo’s 23 wards come to ¥28,846 weighted by property count, and Fukuoka’s Hakata Ward and Nagoya’s Nakamura Ward are 1.4–1.8x their prefecture values. Business hotels are at 55% of city hotels nationally, but the ratio ranges from 21% to 114% by prefecture, and the one-guest → two-guest mark-up within the same property varies by region, from a median of +14% in Tokyo to +32% in Hokkaido. In pricing for two-guest demand, the opportunity lies in benchmarking against ward values and moving the mark-up according to the two-guest share on each stay date.
⚠ Note on listed prices for future dates: October 2026 figures in this article are averages of listed prices publicly displayed on OTAs and similar channels as of the survey date (October 7, 2026), and will change as inventory is added and prices are adjusted closer to the stay date. Please note that the year-on-year comparison is between finalized October 2025 data and October 2026, a forward month.
Related Articles
- Business Hotel Price Surge: National ADR Analysis & 10 Cost-Effective Prefectures
- Tokyo Business Hotel ADR 12-Month Trend: 30% Central vs Outer Ward Gap
- Intra-Prefecture ADR Gaps 2026: Median 2.74x, Okinawa Widest at 5.86x
References and Sources
■ Data source
HotelBank Editorial Team research (MetroEngines Research). Listed prices by category for October 2026 and October 2025 stays (two guests in one room, per room, tax included), aggregated for the 47 prefectures and for wards in six major cities (60 wards with at least 3 properties). The one-guest vs. two-guest comparison covers October 14–20, 2026 stays and pairs the lowest listed prices for combinations of the same property and stay date that listed both one-guest and two-guest occupancy (6 prefectures, 1,734 properties, 11,915 pairs in total).
■ Estimation assumptions
All amounts in the body are measured listed prices; the only estimate is Table 9. Table 9 is an index with the one-guest rate = 100, where average revenue per room sold = 100 × (1 + two-guest share × mark-up). Occupancy and two-guest share are assumed not to change when the mark-up changes, and price elasticity is not modeled. Year-on-year changes compare the same month on the same basis; month-on-month changes spanning the seam between finalized and forward months are not calculated.
■ Limitations
October 2026 figures reflect listings as of the survey date (October 7, 2026) and will change with inventory added and prices adjusted before the stay date. Room types (double / twin / semi-double) are not distinguished, and because figures are all-plan averages, the level also moves with the mix of meal-inclusive plans. Prefecture values are equal-weighted municipal averages. Nara (32 properties) and wards with 3–5 properties can move on a single property’s pricing. Capsule hotel two-guest rates include the price of two berths. This is a different metric from estimated settled ADR and excludes accommodation and bathing taxes.
■ References
- HotelBank Editorial Team research (MetroEngines Research) — listed prices by category for October 2026 and October 2025 stays (two guests in one room, per room, tax included; business hotels N=7,666 properties), ward-level aggregation for six major cities, and one-guest vs. two-guest paired comparison for October 14–20, 2026 stays (6 prefectures, 1,734 properties in total)
- Japan Tourism Agency, Overnight Travel Statistics Survey, August 2026 first preliminary figures (published September 30, 2026) (Japanese)
- Japan National Tourism Organization (JNTO) international visitor arrivals, August 2026 estimate (Travel Voice, September 16, 2026) (Japanese)
- Kyoto City, “Revision of accommodation tax rates (effective March 1, 2026)” (Japanese)
- Tokyo Metropolitan Government Bureau of Taxation, “Accommodation Tax” (Japanese)
- 80th National Sports Festival “Ao no Kirameki Aomori Kokusupo” main session schedule (Fukuoka Prefecture release) (Japanese)