

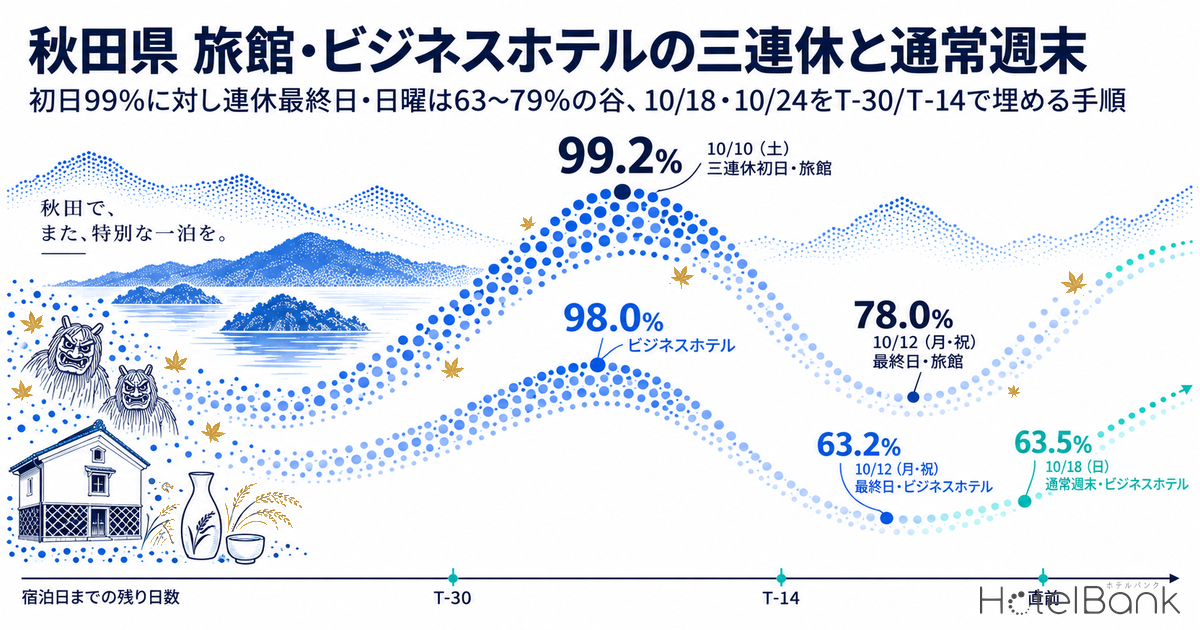
We lined up estimated OCC (based on OTA-listed inventory) for 49 ryokan (1,647 rooms) and 23 business hotels (1,910 rooms) in Akita Prefecture across October’s three-day weekend (October 10–12), a regular weekend (October 17–18) and the autumn-foliage peak weekend (October 24), and the “peaks” and “troughs” of demand fell in clearly different places. On Saturday, October 10, the first day of the three-day weekend, ryokan had climbed to 99.2% and business hotels to 98.0% as observed the day before arrival. On the final day, Monday, October 12 (a public holiday), ryokan stood at only 78.0% and business hotels at 63.2% as observed two days before arrival, a drop of 21–35pt within the same holiday weekend. The regular-weekend Saturday, October 17, was tracking at 82.2% for ryokan and 82.8% for business hotels seven days before arrival, 13–15pt below the first day of the three-day weekend at the same point (97.6% and 95.5%), and the following day, Sunday the 18th, fell back into a trough for business hotels at 63.5% (eight days before arrival). This article follows the booking curves for these three weekends from 45 days before arrival to the latest observation, and sets out, as a practical procedure for revenue managers running ryokan and business hotels in Akita, how to fill the trough days in three stages: T-30, T-14 and the final days.
Coverage: ryokan in Akita Prefecture N=49 properties (1,647 rooms); business hotels N=23 properties (1,910 rooms). Both are fixed cohorts based on listings on major booking sites. The price metric in this article is estimated settled ADR (the settled price level estimated from OTA and other sales data, tax-excluded equivalent), and occupancy is an estimate based on OTA-listed inventory. Definitions are given at the end of the article. Data as of: October 11, 2026 (latest observation October 9–10 depending on the stay date).
- — On day 1 of the three-day weekend, ryokan hit 99.2% and business hotels 98.0% (October 10, observed the day before arrival). The final day, October 12, reached only 78.0% and 63.2%, a 21–35pt gap within the same holiday weekend.
- — The trough days were already troughs 45 days out. At 45 days before arrival, the gap between day 1 and the final day was already 17.0pt for ryokan and 24.3pt for business hotels, so the fix has to be designed at T-30 or earlier.
- — Day 1 of the three-day weekend runs 13–15pt above a regular Saturday at the same lead time (7 days before arrival: ryokan 97.6% vs. 82.2%, business hotels 95.5% vs. 82.8%).
- — For business hotels, Sunday is a day when the whole market is holding inventory at once. On October 18 the sold-out property rate was 0.0%, and the median remaining allotment per property was 40.0%.
- — Estimated settled ADR in the final September 2026 figures was +6.3% for ryokan and +4.6% for business hotels (year on year). Fill the troughs not with across-the-board price cuts but with inventory design built around multi-night stays and weekday extensions.
Booking curves for the three days of the holiday weekend — demand concentrates on day 1, and the final day becomes the trough
First, let’s line up the three days of the holiday weekend itself. For ryokan (N=49 properties / 1,647 rooms), Saturday, October 10 was already at 85.4% 45 days before arrival, then 90.3% at 30 days, 95.7% at 14 days and 99.2% the day before: a curve that “starts high early and keeps rising to the end.” How to handle a stay date that is already this high 45 days out is set out with the same yardstick in our analysis of the event held on August 29, 2026, Omagari Fireworks: Akita 97.8% OCC 45 Days Out, Only 2.2pt Headroom. The sold-out property rate (the estimated share of properties with no listed inventory visible on OTAs and other channels) also went from 71.4% at 14 days out to 87.8% the day before, meaning nearly 90% of ryokan in the prefecture had let go of their inventory for day 1 of the holiday weekend. The middle day, Sunday, October 11, also built from 80.4% at 45 days out to 98.7% the day before, reaching almost the same height as day 1.
The final day, Monday, October 12 (holiday), looks different. It went from 68.4% at 45 days out to 69.3% at 30 days, 72.7% at 14 days and 78.0% two days before arrival: just 9.6pt of build over 45 days, arriving at the final stretch 21pt below day 1. The sold-out property rate was 44.9%, roughly half that of day 1. If you assume “it’s a three-day weekend, so it will fill” and apply the same price and inventory settings to all three days, only the final day is left unsold.
Source: MetroEngines Research; compiled by the HotelBank Editorial Team
Business hotels (N=23 properties / 1,910 rooms) start their curve later than ryokan, and the gap is even wider. Saturday, October 10 went from 66.5% at 45 days out to 79.6% at 30 days, 93.8% at 14 days and 98.0% the day before, adding 31.5pt over 45 days. Monday, October 12 (holiday), by contrast, went from 42.2% at 45 days out to 46.4% at 30 days, 56.1% at 14 days and 63.2% two days before arrival; it added 21.0pt over the same 45 days, but ended 35pt below day 1, with a sold-out property rate of just 13.0%. The middle day, Sunday, October 11, was also 12pt below day 1 at 85.7% the day before. For business hotels, the three-day weekend can be described as “demand concentrated on the first night, with day 2 and day 3 progressively thinner.”
Source: MetroEngines Research; compiled by the HotelBank Editorial Team
To sum up so far, the trough of the three-day weekend is the “final day,” and it runs about 21pt deep for ryokan and about 35pt for business hotels. Moreover, this gap did not appear suddenly at the last minute: there was already a 17.0pt gap for ryokan and 24.3pt for business hotels at 45 days out, and it remained because the curves rose in parallel. The fix for the trough has to be designed at T-30 or earlier, not applied as a last-minute discount.
Where regular and foliage weekends stand now — Saturday peaks, Sunday troughs, repeated
Next, we line up the progress of the regular weekend after the holiday (October 17–18) and the autumn-foliage peak weekend (October 23–25) on the same yardstick. The table below shows four fixed points — 45, 30 and 14 days before arrival and the latest observation — and because the lead time (LT) of the latest observation differs by stay date, it is shown in the column.
| Stay date | Segment | 45 days out | 30 days out | 14 days out | Latest observation (LT) | Sold-out property rate (latest) |
|---|---|---|---|---|---|---|
| Oct 10 (Sat) Day 1 of 3-day weekend | Ryokan | 85.4% | 90.3% | 95.7% | 99.2% (LT1) | 87.8% |
| Business | 66.5% | 79.6% | 93.8% | 98.0% (LT1) | 73.9% | |
| Oct 11 (Sun) Middle day | Ryokan | 80.4% | 84.2% | 88.3% | 98.7% (LT1) | 87.8% |
| Business | 52.5% | 59.5% | 70.6% | 85.7% (LT1) | 30.4% | |
| Oct 12 (Mon, holiday) Final day | Ryokan | 68.4% | 69.3% | 72.7% | 78.0% (LT2) | 44.9% |
| Business | 42.2% | 46.4% | 56.1% | 63.2% (LT2) | 13.0% | |
| Oct 17 (Sat) Regular weekend | Ryokan | 76.8% | 79.6% | 80.5% | 82.2% (LT7) | 44.9% |
| Business | 58.7% | 67.0% | 79.8% | 82.8% (LT7) | 30.4% | |
| Oct 18 (Sun) Regular weekend | Ryokan | 76.3% | 74.7% | 78.0% | 78.9% (LT8) | 26.5% |
| Business | 50.9% | 50.9% | 60.7% | 63.5% (LT8) | 0.0% | |
| Oct 23 (Fri) Eve of foliage weekend | Ryokan | 82.0% | 85.1% | 86.8% | 87.1% (LT13) | 44.0% |
| Business | 58.0% | 67.3% | 81.0% | 81.2% (LT13) | 17.4% | |
| Oct 24 (Sat) Foliage peak weekend | Ryokan | 85.7% | 88.4% | 92.7% | 92.7% (LT14) | 58.3% |
| Business | 59.4% | 71.4% | 83.5% | 83.5% (LT14) | 30.4% | |
| Oct 25 (Sun) Foliage peak weekend | Ryokan | 81.1% | 82.3% | — | 84.8% (LT15) | 34.7% |
| Business | 51.0% | 55.1% | — | 63.2% (LT15) | 13.0% |
Source: MetroEngines Research; compiled by the HotelBank Editorial Team
On the regular-weekend Saturday (October 17), ryokan were at 82.2% and business hotels at 82.8% seven days before arrival. Day 1 of the three-day weekend stood at 97.6% for ryokan and 95.5% for business hotels at the same seven-day point, so the gap at the same lead time is 15.4pt for ryokan and 12.7pt for business hotels, making “13–15pt between day 1 of a three-day weekend and a regular Saturday” the benchmark for Akita this October (in neighboring Fukushima, a 15.1pt gap was observed at the same lead time, showing the same pattern). However, the ryokan curve for the regular Saturday moved only 5.4pt, from 76.8% at 45 days out to 82.2% at 7 days out; compared with 24.1pt for business hotels, the late build is thin. For ryokan, a regular Saturday reads less as a date with room to build and more as one that “ends with what was booked early.”
The trough is Sunday. On Sunday, October 18, ryokan were at 78.9% and business hotels at 63.5% eight days before arrival, 3pt and 19pt below the preceding Saturday, respectively. For business hotels, Sunday stood at 50.9% at both 30 and 45 days out, so progress stalled for those 15 days. The sold-out property rate was also 0.0%: none of the 23 business hotels in the prefecture had let go of their Sunday inventory. The foliage peak weekend follows the same pattern: Saturday, October 24 is at 92.7% for ryokan and 83.5% for business hotels (both 14 days before arrival), close to the level of day 1 of the three-day weekend, while the following day, Sunday the 25th, stands at only 84.8% for ryokan and 63.2% for business hotels (15 days before arrival). Demand gravitating to Saturday and Sunday being left over has repeated three weeks in a row.
Ryokan on Saturday, October 24 had already reached 92.7% with a sold-out property rate of 58.3% 14 days before arrival, a pace approaching day 1 of the three-day weekend at the same point (95.7% and 71.4%). Autumn foliage around the samurai residences of Kakunodate typically peaks from late October to mid-November, and Dakigaeri Gorge also begins to turn in late October (see References). The curves confirm that ryokan demand is gathering early on the first Saturday that coincides with the start of peak foliage.
Estimated OCC by day of week — September actuals show “two troughs, Friday and Sunday”
To check whether the weekend peaks and troughs are an October-only phenomenon, we averaged the daily actuals for the previous month, September 2026, by day of week. For ryokan (N=34–54 properties, varying by day), Saturday was highest at 91.8%, followed by Monday at 84.5% and Sunday at 84.2%, with Friday lowest at 78.4%. For business hotels (N=22–23 properties / 1,797–1,857 rooms), Saturday at 93.7%, Thursday at 92.8% and Tuesday at 90.0% were high, while Sunday at 76.2% and Friday at 80.5% were the troughs. September had a holiday run from Saturday the 19th to Tuesday the 22nd including Respect for the Aged Day (the 21st), and ryokan on the 19th–22nd ran at 98.5%, 99.8%, 99.8% and 96.1%, essentially full. Because this holiday run lifts the Monday average, ryokan on non-holiday weekdays can be taken to be roughly around 80%.
Source: MetroEngines Research; compiled by the HotelBank Editorial Team
September’s pattern of Sunday being the lowest day of the week for business hotels is consistent with October’s figures: 63.2% on October 12 (Monday holiday, effectively playing the role of a Sunday), 63.5% on Sunday, October 18 and 63.2% on Sunday, October 25. In other words, the Sunday trough is structural for business hotels in Akita, and the final day of a three-day weekend can be read as the same trough simply shifted onto the holiday. On the ryokan side, the Sunday dip is shallow (September average 84.2%, October 18 at 78.9%); instead, Friday is notably low, and the question becomes whether the starting point for multi-night stays can be placed on “the night before Saturday.”
Checking which properties are holding the inventory on trough days, using property-level inventory sell-through data (only properties listing 30% or more of total rooms; anonymized distribution), shows differences in how inventory remains as well. The table below shows, for each stay date, the distribution of remaining allotment (listed rooms remaining ÷ total rooms) at the time of observation.
| Stay date | Segment | Properties covered | 0% remaining | Up to 10% | 10–30% | 30–50% | Over 50% | Median remaining |
|---|---|---|---|---|---|---|---|---|
| Oct 12 (Mon, holiday) | Ryokan | 40 properties / 1,063 rooms | 13 | 1 | 12 | 10 | 4 | 19.1% |
| Business | 28 properties / 2,250 rooms | 1 | 1 | 7 | 10 | 9 | 37.0% | |
| Oct 17 (Sat) | Ryokan | 36 properties / 932 rooms | 8 | 5 | 10 | 10 | 3 | 21.1% |
| Business | 26 properties / 2,279 rooms | 7 | 6 | 8 | 4 | 1 | 9.2% | |
| Oct 18 (Sun) | Ryokan | 37 properties / 878 rooms | 5 | 1 | 12 | 12 | 7 | 31.2% |
| Business | 26 properties / 2,215 rooms | 0 | 1 | 8 | 12 | 5 | 40.0% | |
| Oct 24 (Sat) | Ryokan | 31 properties / 476 rooms | 13 | 5 | 5 | 5 | 3 | 6.5% |
| Business | 26 properties / 2,127 rooms | 7 | 9 | 5 | 3 | 2 | 7.1% |
Source: MetroEngines Research; compiled by the HotelBank Editorial Team
On the regular Saturday, October 17, 13 of 26 business hotels had sold down to 10% or less remaining, with a median of 9.2%. The next day, Sunday the 18th, no property was at 0% remaining, the median was 40.0%, and more than half (17 properties) still had over 30% left. Ryokan on October 18 likewise had 19 properties, more than half, with over 30% remaining. A trough day is not one where “only a few properties are left unsold” but one where most properties in the prefecture are holding inventory at the same time, and individual properties competing for demand with discounts will not fill the market-wide trough. This is why the action plan below centers on promotions built around multi-night stays and weekday combinations.
Price context — estimated settled ADR is up year on year in finalized months
Before translating the occupancy peaks and troughs into pricing, it is worth pinning down the market price level with finalized months. Estimated settled ADR for ryokan in Akita (N=90 properties) was about ¥9,200 in September 2026, +6.3% from about ¥8,600 in September last year. Business hotels (N=59 properties) were at about ¥8,000, +4.6% from about ¥7,600 a year earlier. July was also above the previous year, at +3.5% for ryokan and +9.9% for business hotels; in August, ryokan fell −6.8% to about ¥9,700 from about ¥10,400 a year earlier, while business hotels grew +3.2% to about ¥8,700. Last year’s October and November went from about ¥8,900 to about ¥9,800 for ryokan and from about ¥7,700 to about ¥7,300 for business hotels: ryokan rates rose toward the foliage season, while business hotels placed their autumn peak in September–October. By the time the July figures were finalized, the direction of YoY change had already diverged by segment.
| Month | Ryokan (N) | Same month prior year | YoY | Business hotels (N) | Same month prior year | YoY |
|---|---|---|---|---|---|---|
| July 2026 | ¥8,932 (91) | ¥8,626 (95) | +3.5% | ¥8,348 (59) | ¥7,596 (57) | +9.9% |
| August 2026 | ¥9,695 (90) | ¥10,407 (93) | −6.8% | ¥8,694 (59) | ¥8,421 (58) | +3.2% |
| September 2026 | ¥9,163 (90) | ¥8,616 (92) | +6.3% | ¥7,993 (59) | ¥7,640 (58) | +4.6% |
| (Reference) October 2025 | ¥8,894 (90) | — | — | ¥7,695 (58) | — | — |
| (Reference) November 2025 | ¥9,826 (87) | — | — | ¥7,320 (58) | — | — |
Source: MetroEngines Research; compiled by the HotelBank Editorial Team
What these figures show is that while the Akita lodging market has large swings in occupancy, rates in finalized months are holding above the previous year. Handling trough days with “across-the-board price cuts” would therefore undermine monthly rates that are running ahead of last year. Filling trough days not with price but with how inventory is released (multi-night conditions, allotments tied to weekdays) and the timing of promotions is the path to gaining occupancy while protecting monthly ADR.
For revenue managers running ryokan and business hotels in Akita — implications and action plan
Operational insights
1. Split your own three-day-weekend curve into “day 1, middle day and final day” and compare it with the market. In the market, ryokan stood at 85.4% at 45 days out and 90.3% at 30 days out for day 1, and at 68.4% and 69.3% for the final day: a 17pt gap already at 45 days out. Look at your own booking pace by day; if the final day is lagging well behind day 1, you are in the same pattern as the market, which justifies selling the final day alone with a different product design (multi-night conditions, weekday extensions). Conversely, if your final day is ahead of the market, consider room to bring final-day pricing closer to day 1.
2. The Sunday trough is structural and hard to fill with last-minute discounts. Business hotels averaged 76.2% on Sundays in September, and October 18 stood at 63.5% eight days before arrival with zero sold-out properties. On a day when the whole market holds inventory at once, taking demand through price competition does not increase the total. The core of the practice is not pricing Sunday on its own but inventory design that bundles Sunday with other days, such as “Saturday–Sunday two-night stays” or “Sunday–Monday weekday extensions.”
3. Ryokan regular Saturdays build little late, and foliage weekends close early. Ryokan on the regular Saturday (October 17) moved only 5.4pt between 45 and 7 days out. The foliage peak weekend of October 24, meanwhile, was at 92.7% with a 58.3% sold-out property rate 14 days out, approaching day 1 of the three-day weekend. For Saturday inventory, a design that sells out by T-30, without assuming it “will sell at the last minute,” fits better; for foliage weekends, there is room to decide early on repricing the remaining inventory.
4. Rates are up YoY in finalized months — handle the troughs with something other than price. Given the finalized September figures of +6.3% for ryokan and +4.6% for business hotels, lowering the overall price level to deal with trough days is not advisable. If you do move price, limit it to trough days and attach multi-night or weekday-extension conditions, building occupancy while protecting monthly estimated settled ADR.
Put on a timeline, the measures for Sunday, October 18, Sunday, October 25 and the final days of holiday weekends from November onward fall into the following three stages. The decision triggers are tied to the market figures shown in this article.
| Timing | Action | Decision trigger (comparison with market figures) | Aim |
|---|---|---|---|
| T-30 (up to 30 days before arrival) | Design multi-night conditions that include the trough day | Your Sunday / holiday-final-day pace has not reached the market’s 30-days-out level (ryokan 69.3% / business 46.4%–50.9%) | Extend Saturday demand into Sunday and reduce standalone Sunday inventory |
| T-30 | Design Saturday inventory to sell out | Your ryokan Saturday is running ahead of the market’s 30-days-out level (regular Saturday 79.6%, foliage Saturday 88.4%) | Lock in ryokan Saturdays, which build little late, early, and create capacity to steer guests toward Sunday |
| T-14 (up to 14 days before arrival) | Release weekday-extension allotments for Sundays / final days | Your Sunday / final day remains below the market’s 14-days-out level (ryokan 72.7%–78.0% / business 56.1%–60.7%) | Capture extension demand from Sunday into Monday and from the holiday’s final day into the next weekday (e.g. business travelers arriving the night before) |
| T-14 | Review pricing of remaining inventory for foliage weekends | On a foliage Saturday like October 24, your pace is close to the market’s 14-days-out level (ryokan 92.7%, sold-out property rate 58.3%) | Check whether there is room to recover on rate rather than releasing remaining inventory early |
| Final days (7 days before arrival to the day of stay) | Release conditional allotments limited to trough days | Your Sunday / final day is below the market’s latest level (ryokan 78.9% / business 63.5%) | Build occupancy on trough days only, without touching the overall price level |
| Final days | Switch to preparing the following weekend | Once trough-day pace has caught up with the market’s latest level | Don’t let last-minute discounts linger; turn back to multi-night design for the next weekend |
For all of these measures, the market figures are “a yardstick for measuring your own pace,” not targets. The appropriate pace differs with each property’s location, guest mix and channel composition, so look at the direction of the gap with the market (ahead or behind) before deciding how strongly to act.
Summary — three yardsticks for reading Akita weekends
In October, ryokan and business hotels in Akita showed a pattern of peaks on day 1 of the three-day weekend and the foliage peak Saturday, and troughs on the final day of the holiday weekend and on Sundays, with a spread of about 21pt for ryokan and about 35pt for business hotels. The figures in this article boil down to three points. First, day 1 of a three-day weekend runs 13–15pt above a regular Saturday at the same lead time (7 days out: ryokan 97.6% vs. 82.2%, business hotels 95.5% vs. 82.8%), which is no basis for carrying holiday pricing over to regular weekends. Second, trough days are already troughs 45 days out (the final day at 45 days out: ryokan 68.4%, business hotels 42.2%), so the design to fill them must be set at T-30 or earlier. Third, for business hotels, Sunday is a day when the whole market holds inventory at once (October 18: zero sold-out properties, median remaining allotment 40.0%), so handling it with inventory design built on multi-night stays and weekday extensions, rather than price, protects monthly estimated settled ADR that is running above last year.
Frequently Asked Questions (FAQ)
Q. Which day is the demand trough of Akita’s October three-day weekend?
A. The final day, Monday, October 12 (holiday). In observations for October 2026, ryokan were at 78.0% and business hotels at 63.2% (both two days before arrival; estimated OCC based on OTA-listed inventory), 21–35pt below the 99.2% and 98.0% of day 1, October 10.
Q. How big is the gap between day 1 of a three-day weekend and a regular Saturday?
A. In Akita in October 2026, at the same point seven days before arrival, the gap was 15.4pt for ryokan (97.6% vs. 82.2%) and 12.7pt for business hotels (95.5% vs. 82.8%). A gap of 13–15pt between day 1 of a three-day weekend and a regular Saturday is a reasonable benchmark.
Q. Can the Sunday trough be filled with last-minute discounts?
A. Probably not easily. On Sunday, October 18, business hotels had a sold-out property rate of 0.0%, a median remaining allotment of 40.0%, and 17 of 26 properties had more than 30% left. On a day when the whole market holds inventory at once, competing for demand with discounts does little to increase the total, so inventory design such as Saturday–Sunday multi-night stays or Sunday-to-Monday weekday extensions becomes the core.
Q. When should work on trough days begin?
A. Before 30 days out. The gap between day 1 and the final day was already 17.0pt for ryokan and 24.3pt for business hotels at 45 days out; it did not appear at the last minute. It can be organized in three stages: design multi-night conditions by T-30, release weekday-extension allotments at T-14, and in the final days build with conditional allotments limited to trough days.
Q. Is estimated OCC (based on OTA-listed inventory) the same as actual room occupancy?
A. No. It is an estimate calculated as 100 − 100 × OTA-listed rooms remaining ÷ total rooms, covering properties that list 30% or more of their total rooms. Because unlisted rooms are counted as sold, it comes out higher than actual room occupancy.
About the Data
| Item | Details |
|---|---|
| Definition of estimated OCC (based on OTA-listed inventory) | Occupancy based on OTA-listed inventory = 100 − 100 × OTA-listed rooms remaining ÷ total rooms. Coverage is a fixed cohort of properties listing 30% or more of their total rooms on OTAs (the same set of properties for each stay date; the property counts shown in this article are that set). It is an estimate based on the sell-through of inventory sold on OTAs and is defined differently from actual room occupancy (it comes out higher because unlisted rooms are counted as sold). |
| Booking curve | Based on observations from 45 days before arrival to the latest. The lead time of the latest observation differs by stay date and is shown in the tables. |
| Definition of estimated settled ADR | The settled price level (tax-excluded equivalent) estimated from OTA and other sales data (lowest-plan level × segment coefficient; an ensemble across multiple channels). Past months are finalized values; current and future months are estimates based on current sales. Median error against published operating results is 6.6%. This article uses finalized months only. |
| Sold-out property rate | The estimated share of properties with no listed inventory visible on OTAs and other channels. |
| Distribution of remaining allotment by property | An anonymized distribution of listed rooms remaining ÷ total rooms at the time of observation, covering only properties that list 30% or more of their total rooms on major booking sites. The number of properties varies with listing status for each stay date. |
| Coverage N | Estimated OCC: ryokan N=48–50 properties / 1,625–1,652 rooms (each October stay date); September actuals N=34–54 properties / 1,356–1,730 rooms. Business hotels N=23 properties / 1,910 rooms (October); September actuals N=22–23 properties / 1,797–1,857 rooms. Estimated settled ADR: ryokan N=87–95 properties, business hotels N=57–59 properties (varies by month). |
| Data as of | October 11, 2026. The latest booking-curve observation is October 9–10, 2026 depending on the stay date. Sales and inventory change daily, so the figures in this article are a snapshot at the time of retrieval. |
Source: MetroEngines Research; compiled by the HotelBank Editorial Team
References and Sources
■ Data Sources
Estimated OCC for Akita compiled by MetroEngines Research from listed inventory and sales data on major booking sites (ryokan N=48–50 properties / 1,625–1,652 rooms; business hotels N=23 properties / 1,910 rooms), the distribution of remaining allotment by property, and estimated settled ADR (ryokan N=87–95 properties; business hotels N=57–59 properties). Data as of October 11, 2026, with the latest booking-curve observation on October 9–10, 2026. Peak foliage timing is from the external sources below.
■ Calculation Assumptions
Booking curves cover 45 days before arrival through the latest observation and are compared at fixed points of 45, 30 and 14 days out and the latest. The comparison of day 1 of the three-day weekend with a regular Saturday is aligned at 7 days before arrival, where both have observations. Day-of-week values are the daily actuals for September 2026 averaged by day of week and include the holiday run (September 19–22). Estimated settled ADR uses finalized months only. The decision triggers in the action plan use market figures as a yardstick for measuring your own pace, not as targets.
■ Limitations and Caveats
Estimated OCC is an estimate based on the sell-through of OTA-listed inventory; it is defined differently from actual room occupancy and comes out higher. Stay dates from October 17 onward are interim readings 7–15 days before arrival, not final outcomes. The distribution of remaining allotment by property covers a set of properties that varies by stay date and does not match the estimated-OCC cohort. Sales and inventory change daily, so the figures are a snapshot at the time of retrieval.
■ External Sources
• Kakunodate autumn foliage peak timing (Koyo Meisho Guide, in Japanese): https://koyo.walkerplus.com/detail/ar0205e13019/data.html
• Akita Prefecture autumn foliage peak information (Koyo Meisho Guide, in Japanese): https://koyo.walkerplus.com/report/garden/ar0205/