

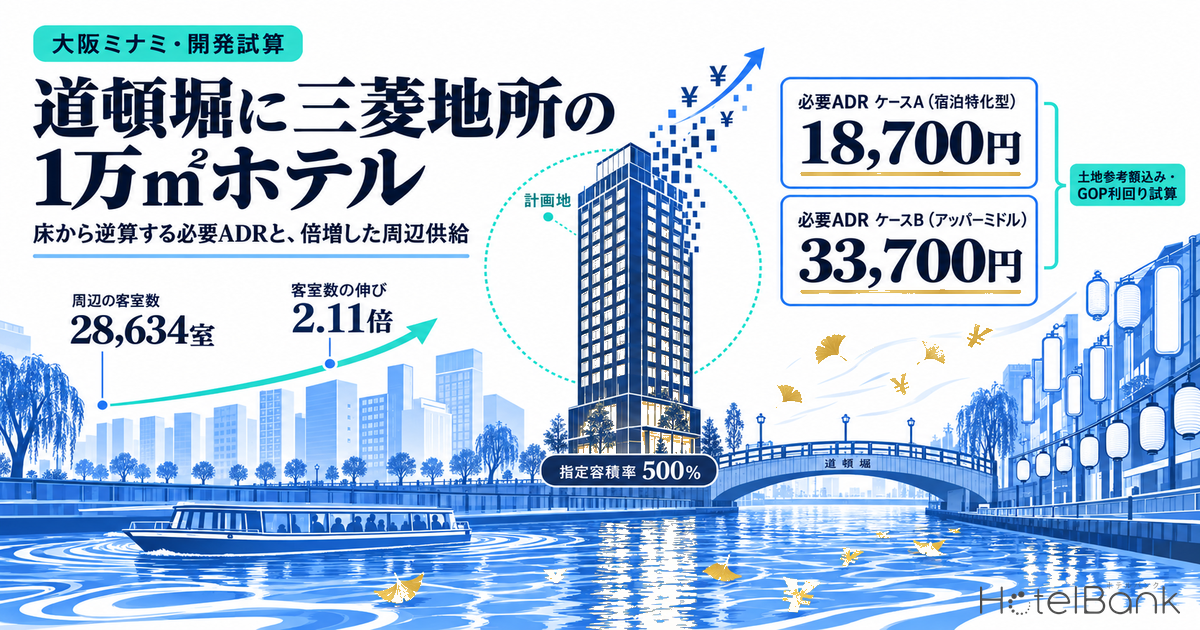
Mitsubishi Estate is set to start construction of a 13-storey hotel building with a gross floor area (GFA) of 10,630 m² in Dotonbori 2-chome, Chuo Ward, Osaka, the Nikkei Real Estate Market Report (日経不動産マーケット情報) reported on October 5, 2026. Within a 1 km radius of the site, the room stock has grown 2.1-fold over ten years to 28,634 rooms, and a major diversified developer is now putting a standalone hotel building of roughly 10,000 m² at the center of it. Because the room count, brand and operator have not been disclosed, this article confines itself to what can be back-calculated from the floor area, and estimates which price band the project would need to reach under different assumptions for GFA per room.
Earlier coverage of Osaka’s Minami district has dealt with listed-REIT deal structures, transaction prices for existing properties and the prefecture-wide supply timeline. This article looks at something different: the “floor” and the “required rate” of a single development project in Dotonbori. It first sets out the publicly available project outline, then moves on to the designated floor area ratio and land prices, supply and price bands within the 1 km radius, and finally how to set a rate assumption on either side of the Expo period.
Metric Definitions Used in This Article
*Metric definitions used in this article: ADR (average daily rate) = an estimated settled rate (tax-exclusive equivalent), calculated by applying a correction factor by hotel type to the lowest plan price each property publishes on OTAs (two guests per room, price per room, tax included). When checked against the property-level ADR disclosed by Invincible Investment Corporation (インヴィンシブル投資法人) (184 property-months, April–May 2026), the median error was approximately 7.5%. These are estimates and differ from each property’s actual settled prices and accounting figures. Area-level ADR is the median of the properties covered (the level of a typical property in the area). OCC (occupancy) = rooms sold as a share of total rooms in the area (an estimate based on inventory sold on OTAs; consistency checks against monthly REIT disclosures indicate accuracy within roughly a few percentage points). Where listed prices are mentioned, they are per-room prices for two guests per room (tax included). Occupancy (estimated, based on OTA-listed inventory) is an estimate derived from the sell-through of inventory offered on OTAs and differs from the actual occupancy of a whole property. Data source: MetroEngines Research & Consulting.
- — GFA of 10,630 m², 13 storeys above ground; room count, brand and operator are undisclosed. Dividing by 40–80 m² per room gives a range of roughly 132–265 rooms (estimate)
- — Rooms within 1 km have grown 2.11-fold in ten years to 290 properties and 28,634 rooms. This project would add only 0.5–0.9%, so the question is price band rather than volume
- — Including the reference land value and at a 5% GOP yield, the required ADR is ¥18,700 in Case A (40 m², 265 rooms) and ¥33,700 in Case B (55 m², 193 rooms)
- — Chuo Ward’s estimated settled ADR ran 41.3% above 2024 during the Expo period; January–September 2026 averaged about ¥10,900, back in line with the same period of 2024
- — Within 1 km, rooms with an estimated settled ADR of ¥30,000 or more account for 9.9%. Case B’s price band has few precedents, and the issue is whether product design can create the rate
Project Outline — Floor Area and Storeys Are Public, Room Count Is Not
What can be confirmed from the building plan is shown in the table below. The project name is the “(Tentative) Dotonbori 2-chome Hotel Project, Chuo Ward, Osaka”; the building owner is Mitsubishi Estate, with construction scheduled to start in December 2026 and complete in December 2028. The site is a two-minute walk from Namba Station on the Osaka Metro and was previously occupied by the New Japan Namba Building (ニュージャパンなんばビル), which housed a sauna and restaurants and ceased operations at the end of March 2019. According to MetroEngines Research, two capsule hotels with a combined 100 rooms that operated in the same building also closed around that time.
| Item | Details | Disclosure status |
|---|---|---|
| Location | 12-1 Dotonbori 2-chome, Chuo Ward, Osaka, and seven other lots | Building plan outline |
| Building owner | Mitsubishi Estate Co., Ltd. | Building plan outline, press reports |
| Site area / building area | 1,996 m² / 1,278 m² | Building plan outline |
| Gross floor area | 10,630 m² | Building plan outline, press reports |
| Scale | 13 storeys above ground, approx. 53 m high | Building plan outline |
| Construction period | Start December 2026 – completion December 2028 (planned) | Building plan outline |
| Room count, brand, operator | — | Undisclosed |
The point to note here is that the room count has not been disclosed. Third-party sites carry projected room numbers, but this article does not adopt them. Instead, it treats the range of roughly 132–265 rooms, obtained by dividing the 10,630 m² GFA by 40–80 m² of GFA per room, strictly as an estimate. Dividing the GFA evenly across 13 storeys gives about 818 m² per floor, enough for around 20 rooms per floor in a limited-service format.
Site Assessment — The 500% Designated FAR Is Almost Fully Used; the Nearest Official Land Price Is Up 2.6x in 10 Years
Looking up the zoning of the site in the Real Estate Information Library of the Ministry of Land, Infrastructure, Transport and Tourism (MLIT) shows a commercial zone with a designated floor area ratio (FAR) of 500% and a building coverage ratio of 80%. Dividing the 10,630 m² GFA by the 1,996 m² site gives about 5.3x. Gross floor area includes portions not counted toward FAR, so a simple comparison is not possible, but the plan can be read as using nearly all of the designated capacity. The building area of 1,278 m² equals 64.0% of the site, leaving headroom against the 80% coverage ratio.
Designated FAR in the surrounding area, however, is not uniform. Within a 300 m radius of the site on an area basis, the 1,000% zone centered on Midosuji accounts for 39.2%, the 500% zone for 35.8%, the 600% zone for 20.5% and the 800% zone for 4.5%. In other words, the site sits in the middle of the entertainment district but in a 500% block one step back from the high-FAR Midosuji frontage. The scale of about 53 m and 13 storeys is likely a product of this FAR envelope.
| Official land price point (distance from site) | 2026 (¥ million/m²) | YoY | Designated FAR |
|---|---|---|---|
| Namba 2-chome (approx. 120 m) | 3.15 | +18.0% | 1,000% |
| Namba 1-chome (approx. 230 m) | 11.70 | +17.0% | 1,000% |
| Soemoncho (approx. 250 m) | 25.00 | +6.4% | 500% |
| Namba 3-chome (approx. 290 m) | 10.60 | +12.8% | 1,000% |
| Dotonbori 1-chome (approx. 300 m) | 9.50 | +25.0% | 500% |
| Nishi-Shinsaibashi 2-chome (approx. 360 m) | 4.60 | +19.5% | 1,000% |
| Shinsaibashisuji 2-chome (approx. 370 m) | 19.90 | +13.1% | 1,000% |
| Minami-Horie 1-chome (approx. 380 m) | 3.49 | +16.7% | 800% |
What about the level of land prices? Lining up the eight commercial official land price points within 400 m of the site, 2026 prices range from ¥3.15 million to ¥25.0 million per m², a spread of about eight times, and all eight points rose year on year. The nearest point, in Namba 2-chome, stands at ¥3.15 million, up 18.0% YoY and 2.6 times its 2016 level of ¥1.20 million. The Dotonbori 1-chome point near Ebisubashi Bridge is ¥9.50 million (+25.0% YoY) — about three times the nearest point (designated 1,000%), even though it carries the same 500% designation as the site. Since the acquisition price has not been disclosed, this article’s estimate uses a “reference land value” of approximately ¥6.29 billion, obtained by multiplying the nearest point’s ¥3.15 million/m² by the site area. This is a mechanical multiplication of an official land price and does not indicate the actual acquisition price; actual transaction prices can diverge from official land prices in either direction.
Supply Within 1 km — 2.11x in 10 Years, With Nearly 60% of the Increase Concentrated in 2016–2019
Counting the lodging properties operating at each year-end within a 1 km radius of the site (34.6686°N, 135.4990°E), the 157 properties and 13,546 rooms at the end of 2016 had become 290 properties and 28,634 rooms as of October 2026. Rooms grew 2.11-fold in ten years, a net increase of 15,088. Of this, 8,671 rooms were added in the three years from the end of 2016 to the end of 2019, or 57% of the total increase.
The decade was not, however, a one-way build-up. While 175 properties with 19,279 rooms opened from 2017 onward, 42 properties with 4,191 rooms ceased operations over the same period. Room counts were almost flat in 2020–2021, and a large opening of around 2,000 rooms in 2024 lifted the total into the 28,000 range. It is closer to the reality to see this as a market whose total stock doubled amid considerable turnover.
On the map, properties opened since 2016 are spread widely on both sides of Midosuji and to the south of Namba Station. Within just a 500 m radius of the site, 90 properties with 10,556 rooms are operating, meaning 37% of the rooms in the 1 km area fall inside that inner ring. If this project opens with roughly 132–265 rooms, it would add only 0.5–0.9% to the rooms within 1 km. In volume terms it is not large enough to move the market; the question is which price band it is placed in.
Surrounding Population and Employment — A Commercial Cluster With 150,000 Workers and an 18.5% Office Share
The demand base is also worth checking. According to the Economic Census by the Ministry of Internal Affairs and Communications and the Ministry of Economy, Trade and Industry, there are 11,590 establishments within a 1 km radius of the site, with 152,738 employees. Of these, office-type employees number 28,287, a share of only 18.5%. The figures indicate a commercial district thick with food and beverage, retail and services, with a different composition from business districts such as Marunouchi or Yodoyabashi. It is natural to assume that lodging demand, too, centers on tourism and leisure rather than business travel.
As for resident population, the MLIT National Land Numerical Information (future population estimates by 250 m mesh) puts the 1 km radius at 46,801 in 2020 and 49,907 in 2025, with a projection of 50,455 in 2040 (+7.8% vs 2020). The working-age share was 75.6% and the senior share 15.3%. Note that this is resident population (census-based), not visitor or pass-through population.
GFA per Room — Median of 28.2 m² Across 62 Nearby Building Plans, and Three Cases for This Project
Estimating a room count from gross floor area requires deciding how many square meters of floor to allocate per room. We therefore aggregated 62 building plans within a 1 km radius of the site for which both GFA and room count could be confirmed (mostly completed in 2017 or later). The median GFA per room is 28.2 m², and 46 plans (74%) are below 40 m². Eleven fall in the 40–80 m² range and five are 80 m² or more, the latter mainly mixed-use buildings that include retail, banquet halls and the like. GFA per room also varies widely with the number of storeys and the mix of uses.
| GFA per room | Plans | Main type | Rooms if applied to 10,630 m² GFA |
|---|---|---|---|
| Under 20 m² | 10 | High-density limited-service, capsule | More than 531 |
| 20–30 m² | 26 | Limited-service (the 28.2 m² median falls in this band) | Approx. 354–531 |
| 30–40 m² | 10 | Limited-service with larger rooms | Approx. 266–354 |
| 40–80 m² | 11 | Upper-midscale, apartment-style, with F&B | Approx. 132–265 |
| 80 m² or more | 5 | Mixed-use, full-service | 132 or fewer |
Applying the area’s 28.2 m² median as it stands, 10,630 m² would hold about 377 rooms. The 40–80 m² range used in this article’s estimates corresponds to a “generous floor allocation” type that is in the minority locally. Below, we set three cases: a limited-service hotel at 40 m² of GFA per room (Case A, 265 rooms), an upper-midscale hotel at 55 m² (Case B, 193 rooms), and a hotel with F&B and a large public bath at 80 m² (Case C, 132 rooms). To repeat, none of these are disclosed figures for the project; they are estimation assumptions back-calculated from the floor area.
Development Scenario Estimates — Required ADR of About ¥19,000 in Case A and About ¥34,000 in Case B
Building construction cost was estimated in two steps. The first step is at 2025 price levels: ¥2.30 million per tsubo (approx. 3.3 m²) for Case A, ¥2.50 million for Case B and ¥3.20 million for Case C. In MLIT’s Building Starts Statistics, the planned construction cost of lodging-industry buildings averaged about ¥591,000 per m² nationwide in 2024 (about ¥1.95 million per tsubo), and for Osaka Prefecture alone — 18 buildings totaling 143,401 m² — about ¥3.20 million per tsubo. By structure in 2025, steel-frame construction is put at ¥2.405 million per tsubo and reinforced concrete at ¥2.026 million; Cases A and B refer to these levels, and Case C to Osaka Prefecture’s 2024 result.
The second step factors in cost escalation during the construction period. With a start in December 2026 and completion in December 2028, the midpoint of construction is the end of 2027. Compounding Turner & Townsend’s construction cost escalation outlook (+5.3% in 2026, +5.0% in 2027) gives a factor of about 1.106, bringing building construction cost to approximately ¥8.18 billion in Case A, ¥8.89 billion in Case B and ¥11.38 billion in Case C. For the GOP margin, we set 50% for Case A, which assumes a limited-service format; 40% for Case B, close to the 38.9% actual (fiscal period ended December 2024) across 91 operated properties disclosed by Invincible Investment Corporation (インヴィンシブル投資法人); and 30% for Case C, with F&B and a large public bath. Occupancy is set at 80%, slightly below Chuo Ward’s July–September 2026 average occupancy (estimated, based on OTA-listed inventory) of 83.0% (127–130 properties / 19,287–19,720 rooms, based on listings on major booking sites).
| Item | A. Limited-service | B. Upper-midscale | C. With F&B and large bath |
|---|---|---|---|
| GFA per room (assumption) | 40 m² | 55 m² | 80 m² |
| Estimated rooms (10,630 m² GFA ÷ assumption) | 265 | 193 | 132 |
| Construction unit cost (assumed, 2025 level) | ¥2.30M/tsubo | ¥2.50M/tsubo | ¥3.20M/tsubo |
| Building construction cost (2025 level) | Approx. ¥7.40B | Approx. ¥8.04B | Approx. ¥10.29B |
| Building construction cost (incl. escalation during construction) | Approx. ¥8.18B | Approx. ¥8.89B | Approx. ¥11.38B |
| Building cost per room (same basis) | Approx. ¥30.86M | Approx. ¥46.05M | Approx. ¥86.19M |
| Reference land value (nearest official land price × site area) | Approx. ¥6.29B | Approx. ¥6.29B | Approx. ¥6.29B |
| Total (building + reference land value) | Approx. ¥14.46B | Approx. ¥15.18B | Approx. ¥17.66B |
| Total per room | Approx. ¥54.58M | Approx. ¥78.63M | Approx. ¥133.82M |
| GOP margin (assumption) | 50% | 40% | 30% |
| Revenue scope (assumption) | Room revenue only | Room revenue only | Room revenue × 1.5 (assumes F&B and ancillary) |
| Required ADR: building only, 5% GOP yield | ¥10,600 | ¥19,700 | ¥32,800 |
| Required ADR: incl. reference land value, 4% GOP yield | ¥15,000 | ¥26,900 | ¥40,700 |
| Required ADR: incl. reference land value, 5% GOP yield | ¥18,700 | ¥33,700 | ¥50,900 |
| Required ADR: incl. reference land value, 6% GOP yield | ¥22,400 | ¥40,400 | ¥61,100 |
| Yield at ADR ¥10,860 (Jan–Sep 2026 average) | 2.9% | 1.6% | 1.1% |
| Yield at ADR ¥15,611 (7-month Expo-period average) | 4.2% | 2.3% | 1.5% |
| Yield at ADR ¥20,000 | 5.3% | 3.0% | 2.0% |
| Yield at ADR ¥30,000 | 8.0% | 4.5% | 2.9% |
To summarize the results, the required ADR to secure a 5% GOP yield on the total including the reference land value is ¥18,700 in Case A, ¥33,700 in Case B and ¥50,900 in Case C. With the building alone as the denominator, it falls to ¥10,600 in Case A and ¥19,700 in Case B. Since Chuo Ward’s estimated settled ADR averaged about ¥10,900 in January–September 2026, Case A sits in a position where “the building alone would work at the current ward average, but once land is included a rate 1.7 times the ward average is needed.” The more floor allocated per room, the heavier the cost each room carries: total cost per room is about ¥54.58 million in Case A, against about ¥78.63 million in Case B and about ¥133.82 million in Case C.
Sensitivity is also worth a look. In Case A with an ADR of ¥20,000 and 80% occupancy, GOP is about ¥774 million and the yield on the total is 5.35%. From there, a 10% fall in ADR takes it to 4.81%, a 5-point fall in occupancy to 5.02%, and both together to 4.51%. A 10% move in rate has more effect than a 5-point move in occupancy, so in this project the rate assumption is what drives the economics.
| Case A sensitivity | GOP | Yield (incl. reference land value) |
|---|---|---|
| Base (ADR ¥20,000, occupancy 80%) | ¥774M | 5.35% |
| ADR −10% (¥18,000) | ¥696M | 4.81% |
| Occupancy −5 pt (75%) | ¥725M | 5.02% |
| Both | ¥653M | 4.51% |
It is also worth checking what happens when rate and occupancy move together. The two tables below vary ADR and occupancy across five levels each for Case A and Case B, and show the yield on the total including the reference land value. Case A yields 4.8% at an ADR of ¥18,000 and 80% occupancy and 5.0% at ¥20,000 and 75%, crossing the 5% line at a rate of around ¥20,000. Even if occupancy rises to 90%, an ADR of ¥16,000 yields only 4.8%; reaching 5% through occupancy gains alone is difficult. In Case B, the yield exceeds 5% at 80% occupancy or above with an ADR of ¥34,000, or 75% or above with ¥38,000; at an ADR of ¥30,000 it only just reaches 5.0% at 90% occupancy. Seen on two axes, it becomes clearer that the more generous the floor allocation, the more the project needs product strength that lifts the rate itself rather than occupancy.
| ADR \ Occupancy (assumed) | 70% | 75% | 80% | 85% | 90% |
|---|---|---|---|---|---|
| ¥16,000 | 3.7% | 4.0% | 4.3% | 4.5% | 4.8% |
| ¥18,000 | 4.2% | 4.5% | 4.8% | 5.1% | 5.4% |
| ¥20,000 | 4.7% | 5.0% | 5.3% | 5.7% | 6.0% |
| ¥22,000 | 5.1% | 5.5% | 5.9% | 6.3% | 6.6% |
| ¥24,000 | 5.6% | 6.0% | 6.4% | 6.8% | 7.2% |
| ADR \ Occupancy (assumed) | 70% | 75% | 80% | 85% | 90% |
|---|---|---|---|---|---|
| ¥26,000 | 3.4% | 3.6% | 3.9% | 4.1% | 4.3% |
| ¥30,000 | 3.9% | 4.2% | 4.5% | 4.7% | 5.0% |
| ¥34,000 | 4.4% | 4.7% | 5.1% | 5.4% | 5.7% |
| ¥38,000 | 4.9% | 5.3% | 5.6% | 6.0% | 6.4% |
| ¥42,000 | 5.5% | 5.8% | 6.2% | 6.6% | 7.0% |
Note that the reference land value is a conservative, lower-end assumption based on the official land price of the nearest point. Applying the level of the Dotonbori 1-chome point (¥9.50 million/m²) would put the land alone at about ¥19.0 billion, pushing the required ADR higher still. Conversely, rising construction costs also work to restrain new supply, which is an upside for projects already under way in that competition is less likely to increase after completion.
Price Band Distribution — 48% of Rooms Are in the ¥10,000–15,000 Band, 10% at ¥30,000 or More
So where does the required ADR fall among the surrounding price bands? Of the existing properties within 1 km, the 124 properties and 21,596 rooms for which an estimated settled ADR could be calculated for at least six of the twelve months from September 2025 to August 2026 were divided into five bands by 12-month average rate. On a room-count basis, the ¥10,000–15,000 band is the thickest at 48.3%; adding the 16.2% under ¥10,000, 64.5% of rooms are clustered below ¥15,000. Rooms at ¥20,000 or more account for 22.4%, and those at ¥30,000 or more for 9.9%.
| Estimated settled ADR band (12-month average) | Properties | Rooms | Room share |
|---|---|---|---|
| Under ¥10,000 | 25 | 3,508 | 16.2% |
| ¥10,000–15,000 | 52 | 10,422 | 48.3% |
| ¥15,000–20,000 | 22 | 2,818 | 13.0% |
| ¥20,000–30,000 | 14 | 2,701 | 12.5% |
| ¥30,000 or more | 11 | 2,147 | 9.9% |
Properties selling at or above Case A’s required ADR of ¥18,700 number 28, with 5,235 rooms, a room share of 24.2%. At or above Case B’s ¥33,700, the field narrows to seven properties with 1,167 rooms, a 5.4% share. The numbers confirm a structure that is “thick in the low ¥10,000s and thin in the upper bands.” Put another way, few products in the area compete in the ¥30,000 range, which can also be read as leaving room for a new build with generous floor space.
The same tendency shows when crossed with property size. There are 46 properties with 130–270 rooms, close to this project’s estimated room count, and their median estimated settled ADR was about ¥13,000. Of these, nine are at ¥19,700 or more and three at ¥33,700 or more. Only a handful of properties in the area achieve rates in the ¥30,000 range at a scale of around 200 rooms; Case B’s band has few precedents, yet it is also a band where properties that achieve it do exist.
The Expo Period and After — January–September 2026 Is Back to Almost the Same Level as 2024
An unavoidable question in setting a rate assumption is how to treat the period of Expo 2025 Osaka, Kansai (April 13–October 13, 2025). Overlaying Chuo Ward’s estimated settled ADR by month, the April–October 2025 average was about ¥15,600, 41.3% above the roughly ¥11,000 of the same period in 2024. After the Expo closed, the level declined month by month, and June 2026 stood at about ¥9,300, down 35.8% YoY and down 8.8% even against the same month two years earlier. Year-on-year figures in the year after the Expo need careful reading, which is why comparisons with two years earlier are shown alongside them here.
Organizing the above by year, the 2024 annual average was about ¥11,200, 2025 including the Expo about ¥14,400, and the latest 12 months (September 2025–August 2026) about ¥12,300. The latest 12 months include September 2025 (about ¥16,000) and October 2025 (about ¥16,500) from the Expo period, so they are somewhat high as a normal-period level. The January–September 2026 average, which excludes the Expo effect, was about ¥10,900, almost identical (−0.2%) to the roughly ¥10,900 of the same period in 2024. Neighboring Naniwa Ward is in the same band, with a latest-12-month average of about ¥11,600 (N=48–56 properties).
Looking ahead to completion at the end of 2028, it would be prudent to anchor the rate assumption not on the ¥15,000–16,000 range of the Expo period but on the normal level of around ¥10,900–11,200. Estimates based on listed price levels at the time of the survey put October 2026 at about ¥13,300 (+13.7% vs the same month two years earlier) and November at about ¥13,200 (+6.2% on the same basis), so autumn is tracking above 2024. How long the uplift over the normal level continues remains to be confirmed with final figures.
Building Plans Within 1 km — This Project Is Among the Largest Standalone Hotel Buildings
The supply outlook also deserves attention. On a building-plan filing basis, within a 1 km radius of the site there are, besides this project, 18 hotel-use plans scheduled for completion from October 2026 onward, with a combined GFA of about 39,500 m². The largest single plan has a GFA of about 6,640 m², and this project’s 10,630 m² is 1.6 times that. Separately, a mixed-use redevelopment in Namba-Sennichimae comprising hotel, retail and office space with a GFA of about 49,600 m² (completion planned for March 2031) has been filed.
The 18 plans are scheduled for completion mostly between 2027 and the first half of 2028, and are mainly small to mid-sized, with GFA in the 1,000–4,000 m² range. Divided by the area’s median GFA per room of 28.2 m², they equate to roughly 1,400 rooms in total. It would be sensible to frame the competitive environment on the premise that these will already be open when this project completes at the end of 2028.
Issues for Investment Decisions — Can Floor Space Be Converted Into Rate?
Based on the above, the issues for this project can be organized into three. First, the supply impact is small. The addition to rooms within 1 km is less than 1%, not a scale that would sway the occupancy of existing hotels. Second, floor allocation determines the price band. Dividing by the local standard of around 28 m² produces a limited-service hotel of about 377 rooms; allocating 40 m² or more means the hotel needs to sit in the upper band that holds just over 20% of the area’s room share. Third is the starting point for the rate assumption. The ward’s normal level excluding the Expo period is around ¥11,000, a gap of about ¥7,800 to Case A’s required ADR of ¥18,700 and about ¥23,000 to Case B’s ¥33,700.
| Perspective | Confirmed facts | Implications from the estimates |
|---|---|---|
| Market (supply) | 290 properties and 28,634 rooms within 1 km, plus 18 hotel plans | Adds 0.5–0.9%. Choice of price band matters more than volume |
| Market (rate) | Chuo Ward’s normal level is about ¥11,000; rooms at ¥30,000 or more are 9.9% | The upper band has few precedents; distinctive product design underpins the rate |
| Regulation | Commercial zone; the 500% designated FAR is almost fully used | Little room to add floor space; allocation of the 10,630 m² GFA is decisive |
| Construction | Lodging-industry buildings in Osaka Prefecture cost about ¥3.20M per tsubo in 2024 | Allow for escalation of around 5% a year during construction and fix cost per room early |
| Demand | 153,000 workers, 18.5% office-type; resident population edging up through 2040 | Tourism- and leisure-led. Room configurations suited to multi-guest use and multi-night stays look effective |
For operators of existing hotels in Minami, the band in which a new build of roughly 10,000 m² opens will be a prompt to review their own positioning. If the upper band thickens, the rate ceiling for the area as a whole may rise. Properties considering renovation or a reorganization of room types may want to align their value-add plans with the end of 2028 as a reference point. For developers, once the room count and brand are disclosed, mapping the project to whichever of this article’s three cases it is closest to should give a sense of the required rate.
Summary
Mitsubishi Estate’s Dotonbori 2-chome hotel project is a standalone hotel building with a GFA of 10,630 m² that uses nearly all of the envelope of a 1,996 m² site and a 500% designated FAR. Rooms within a 1 km radius have grown 2.11-fold in ten years to 28,634, but 64.5% of them are clustered in the band with an estimated settled ADR below ¥15,000, and only 9.9% are at ¥30,000 or more. This article’s estimate is that at 40 m² of GFA per room the project would have 265 rooms and a required ADR of about ¥19,000, and at 55 m² it would have 193 rooms and about ¥34,000.
Chuo Ward’s rate rose by about 40% over 2024 during the Expo period and returned to almost the same level as 2024 in January–September 2026. For a project opening at the end of 2028, the rate assumption should start from the normal level, and the project is at the stage of working out through product design how far floor space can be converted into rate. Disclosure of the room count, brand and operator will be the next checkpoint.
⚠ Note on ADR for future dates: ADR figures in this article for October 2026 onward are estimates based on the level of selling prices published on OTAs at the time of the survey, and will change as the check-in date approaches. Please note that prices currently set high may come down through last-minute adjustments. In the Kansai area, year-on-year comparisons against the Expo period (April–October 2025) show large level differences, so we recommend also referring to comparisons with the same month two years earlier.
References and Sources
■ Data sources
The project outline is based on the Nikkei Real Estate Market Report (October 5, 2026) and a summary of the building plan outline. Rates, occupancy and property counts are from MetroEngines Research & Consulting’s OTA listing data (estimated settled ADR = lowest plan price level with a correction by hotel type; two guests per room, per room, tax-exclusive equivalent). Zoning and official land prices are based on the MLIT Real Estate Information Library, resident population on the National Land Numerical Information, establishments and employees on the Economic Census for Business Activity, construction cost on the Building Starts Statistics, and surrounding building plans on the Survey of Building Dynamics.
■ Estimation assumptions
Rooms = 10,630 m² GFA ÷ GFA per room (40 m² / 55 m² / 80 m²). Building construction cost = GFA (approx. 3,216 tsubo) × unit cost per tsubo (¥2.30M / ¥2.50M / ¥3.20M) × escalation during construction of 1.106 (+5.3% in 2026 and +5.0% in 2027, compounded). Reference land value = nearest official land price of ¥3.15 million/m² × 1,996 m² site = approx. ¥6.29 billion. Occupancy is 80% (an assumed value for the estimate, full-year), GOP margin 50% / 40% / 30%, and for Case C revenue = room revenue × 1.5. Yield = GOP ÷ (building construction cost + reference land value).
■ Limitations and caveats
The room count, brand, operator and acquisition price are undisclosed, and the three cases are no more than assumptions back-calculated from the floor area. GOP is before deduction of operator fees, rent, property tax, insurance and repair reserves, and differs from NOI and investment yield. The reference land value is a mechanical multiplication of an official land price and may diverge from the actual transaction price. Estimated settled ADR and occupancy are estimates based on OTA listing data, and from October 2026 onward reflect listed levels at the time of the survey. The number of properties within the 1 km radius is based on confirmed listings, and properties about to open may add to it.
■ Market data
| MetroEngines Research & Consulting — estimated settled ADR (Chuo Ward, Osaka, N=183–194 properties each month; Naniwa Ward, N=48–56 properties), properties and rooms within the 1 km radius (N=290 properties, 28,634 rooms), price band distribution (N=124 properties, 21,596 rooms), occupancy (estimated, based on OTA-listed inventory; 127–130 properties) |
■ Government statistics and public data
■ REIT and industry reports
| Invincible Investment Corporation (インヴィンシブル投資法人, 8963) hotel operating results (GOP margin 38.9%, fiscal period ended December 2024, 91 properties) |
| archi-book, “Construction unit costs by structure in the Building Starts Statistics (2025 edition)” (in Japanese) |
| Turner & Townsend construction cost escalation outlook (+5.3% in 2026, +5.0% in 2027) |
■ News and project outline