

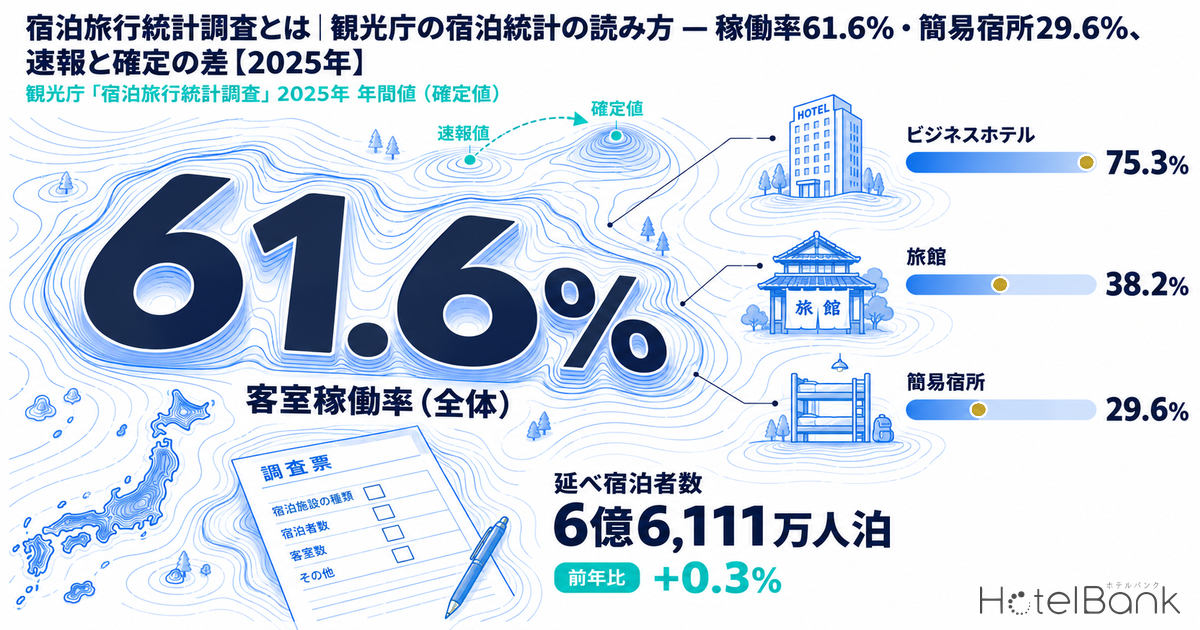
The Japan Tourism Agency’s monthly Overnight Travel Statistics Survey (宿泊旅行統計調査) is the only official statistic that reports total guest nights and room occupancy rates nationwide, by prefecture and by property type. Lodging properties receive its questionnaires, and investors and analysts use it as the market’s reference benchmark. The 2025 annual figures (final) were released on July 6, 2026: total guest nights came to 661.11 million (+0.3% YoY), and the room occupancy rate was 61.6% overall, with business hotels at 75.3%, ryokan at 38.2% and simple lodging at 29.6%. Working from the agency’s original documents, this article sets out where the survey stands under the Statistics Act, who is surveyed, what is published and when, how far the preliminary figures move by the time they are finalized, and where to get prefecture- and municipality-level numbers.
Metric Definitions Used in This Article
- Total guest nights (person-nights): the number of guests staying each day, summed over the month. One person staying two nights counts as two person-nights.
- Number of guests (persons): the number of people who stayed. One person staying two nights counts as one.
- Room occupancy rate: the number of rooms used in the month (the sum of rooms used for stays on each day) divided by total room-nights, i.e. the number of rooms multiplied by the days in the month. Refers to the aggregate figures of the JTA Overnight Travel Statistics Survey.
- Capacity occupancy rate: total guest nights divided by guest capacity multiplied by the days in the month.
- Preliminary / final figures: monthly figures are published as a first preliminary release (end of the following month) and then a second preliminary release (end of the month after that); annual figures are published as preliminary figures (end of February of the following year) and then final figures (end of June to July of the following year). Final figures are re-tabulated to reflect questionnaires collected after the preliminary release.
- OCC (occupancy rate): used only where the end of this article refers to our own estimates; it means rooms sold as a share of total rooms in an area (an estimate based on OTA sales inventory). Its population and definition differ from the JTA room occupancy rate.
- Data source: Japan Tourism Agency, Overnight Travel Statistics Survey (all figures not otherwise attributed come from the agency’s original press releases and survey overview).
- — The Overnight Travel Statistics Survey is a general statistical survey under the Statistics Act, so the reporting obligation in Article 13 and the penalties in Article 61, which apply only to fundamental statistical surveys, do not apply. The number of responses determines the precision of the official prefecture × property-type benchmark.
- — From the January 2026 survey, the stratification basis changed from number of employees to number of rooms: properties with 20 or more rooms are now fully enumerated, and those with 1–19 rooms are sampled at rates set by prefecture. 2026 YoY comparisons may contain a structural break.
- — The 2025 annual final figures (released July 6, 2026) put total guest nights at 661.11 million, with a room occupancy rate of 61.6% overall, 75.3% for business hotels, 38.2% for ryokan and 29.6% for simple lodging.
- — From preliminary to final, total guest nights were revised up by +7.63 million (+1.2%), flipping the YoY change from −0.8% to +0.3%. Annual conclusions should be drawn from the final figures.
- — At the municipal level, from January 2026 data the monthly release carries actual-count tabulations for major municipalities (185 municipalities in the July 2026 data). Take the latest prefecture-level figures from the JTA results (Excel); the e-Stat API only goes up to 2016.
What the Overnight Travel Statistics Survey Is — A General Statistical Survey Under the Statistics Act
The Overnight Travel Statistics Survey is conducted by the Japan Tourism Agency (Tourism Statistics Office, Tourism Strategy Division) under the Ministry of Land, Infrastructure, Transport and Tourism, and the agency’s survey overview defines its purpose as “to grasp the actual state of overnight travel in Japan on a nationwide scale.” It began in 2007 and moved to monthly surveys and releases from the April 2015 survey. Its government statistics code is 00601020, and e-Stat lists its statistics type as “general statistics.” The filling-in guide enclosed with the questionnaire also states plainly that “this survey is a general statistical survey based on the Statistics Act, and your responses will never be used for any purpose other than statistics or disclosed externally.” In other words, it is not a fundamental statistical survey like the national census or the Economic Census, but a general statistical survey conducted with the approval of the Minister of Internal Affairs and Communications under Article 19 of the Statistics Act. The most recent survey plan was approved on December 24, 2025 and has applied since the January 2026 survey.
What operators care about most here is likely whether they are required to respond. Going to the text of the Statistics Act, both the reporting obligation in Article 13 and the penalty in Article 61 (a fine of up to ¥500,000) are defined only for refusals to report in a “fundamental statistical survey.” As a general statistical survey, the Overnight Travel Statistics Survey is not subject to this penalty-backed reporting obligation. The JTA itself sends the questionnaire with a cover letter framed as a “request for cooperation,” so it is designed as a request, not a legal requirement.
Even so, deciding whether to respond purely on whether there is a penalty is not in operators’ own best interest, for two reasons. First, the survey publishes room occupancy rates in fine-grained prefecture × property-type cells, making it the only official benchmark against which a property can set its own occupancy beside the average for the same property type in the same prefecture. The more properties respond in a prefecture, the more precise that benchmark becomes, and the more reliable a property’s reading of its own position. Second, the valid response rate published by the JTA for July 2026 was only 32.9% at the first preliminary release and 45.1% at the second. Each single response carries real weight, especially in prefectures with few properties and in the ryokan and simple-lodging categories. By size, the first-preliminary valid response rate was 40.1% for properties with 20 or more rooms versus 20.4% for those with fewer than 20 (July 2026 data, JTA press release of August 31, 2026) — a gap of nearly two to one, which is one reason the preliminary figures get revised. Since the filling-in guide guarantees that, under the Statistics Act, responses are not used for anything other than statistics and are not disclosed externally, the rational view is to treat responding as an investment in a property’s own market data.
Who Is Surveyed and How — From “Employees” to “Rooms” in January 2026
The survey covers hotels, ryokan, simple lodging and company/organization lodging facilities nationwide. According to the JTA’s request-for-cooperation letter (April 2026), the population is about 76,000 properties, from which about 23,000 are selected for the survey based on sampling theory. The stratification basis for sampling changed significantly with the January 2026 survey. From Q2 2010 through 2025 it was based on number of employees: establishments with 10 or more employees were fully enumerated, those with 5–9 were randomly sampled at one in three, and those with 0–4 at one in nine. From the January 2026 survey the basis is number of rooms: establishments with 20 or more rooms are fully enumerated, and those with 1–19 rooms are sampled at rates set for each prefecture.
| Category (from the January 2026 survey) | Population (approx.) | Sampling method | Questionnaire form |
|---|---|---|---|
| 1–9 rooms | Approx. 51,000 properties | Random sampling at rates set for each prefecture | Form No. 1 (1–19 rooms) |
| 10–19 rooms | Approx. 10,000 properties | Same as above (about 9,000 sampled from roughly 61,000 properties with fewer than 20 rooms) | Form No. 1 (1–19 rooms) |
| 20–199 rooms | Approx. 15,000 properties (total with 20+ rooms) | All properties surveyed (complete enumeration) | Form No. 2 (20–199 rooms) |
| 200 or more rooms | Form No. 3 (200+ rooms) |
Source: Compiled by the HotelBank Editorial Team from the JTA’s “Conducting the Overnight Travel Statistics Survey (April, May and June 2026) (Request for Cooperation)” and “Overview of the Overnight Travel Statistics Survey”
In practice, questionnaires are mailed once a quarter covering three months at a time, and the deadline is set at around the 10th of the month after the survey month (May 11 for April 2026, June 10 for May and July 10 for June). Besides mail, responses can be submitted by email using the Excel form available on the JTA website, or online through the government’s e-Survey portal; from April 2026 the survey secretariat has been contracted to Survey Research Center Co., Ltd. Surveyed properties are rotated periodically, with a maximum of about three years assumed for statistical precision and stability, so a property that receives the questionnaire should set up its internal tabulation workflow on the assumption that it will keep responding for that period.
Readers should note that the change in stratification basis may affect 2026 year-on-year comparisons. In its 2026 monthly press releases the JTA notes that “because the stratification basis was changed from ‘number of employees’ to ‘number of rooms,’ year-on-year (same-month) ratios and differences may include the effect of the revision.” When connecting 2026 prefecture- or property-type-level YoY figures to a long-run series, this break has to be taken as a given. How the room-count stratification axis actually divides up the property distribution is visualized with our own property population data in JTA Lodging Survey Switches Stratification from Staff to Room Count: A Data Read.
What Is Asked — What the Questionnaire Covers and What Gets Tabulated
The questionnaire (Form No. 2) consists of nine questions. Q1–Q3 cover the property’s name, location and property type; Q4 the number of rooms and guest capacity as of January 1; Q5 the number of employees; Q6 the breakdown of stay purposes over the most recent year (tourism/recreation versus business travel); Q7 the month’s total guest nights and number of guests, the total guest nights and number of guests among international visitors, and rooms used; Q8 the breakdown of total guest nights by residence (in-prefecture/out-of-prefecture); and Q9 the breakdown of international guest nights by nationality (place of origin). Rooms used may also be reported as a room occupancy rate (%). The “main survey items” listed in the JTA’s survey overview are the same three — monthly total guest nights and number of guests for all and for international visitors, total guest nights by residence (in-prefecture/out-of-prefecture), and international guest nights by nationality — and the published tables mirror this question structure directly.
There are six property types, defined in the JTA survey overview as follows. Because every “by property type” breakdown in the tables is based on these categories, knowing which category your property reports under makes comparisons with the published figures more accurate.
| Property type | JTA definition (summary) |
|---|---|
| Ryokan | A business that accommodates guests for a fee in facilities mainly of Japanese-style structure and equipment, other than simple lodging |
| Resort hotels | Hotels (facilities mainly of Western-style structure and equipment) built in leisure or resort areas, mainly serving tourists |
| Business hotels | Hotels mainly serving business travelers |
| City hotels | Hotels located in urban areas other than resort hotels and business hotels |
| Simple lodging | Facilities mainly with structures and equipment in which lodging space is shared by many people (bed houses, mountain huts, capsule hotels, etc.) |
| Company/organization lodging facilities | Businesses that accommodate specific people such as members of a company or organization (members’ lodges, mutual-aid association lodges, corporate retreats, youth hostels, etc.) |
Source: Compiled by the HotelBank Editorial Team from the JTA’s “Overview of the Overnight Travel Statistics Survey”
The filling-in guide also instructs that private lodging (minpaku), pensions, youth centers, children’s nature centers and similar facilities, if licensed under the Inns and Hotels Act, should report as either a hotel/ryokan or simple lodging. Now that the room-count stratification from January 2026 is designed to include properties with few rooms in the sample, the accuracy of this classification can be said to determine the quality of the published figures by property type.
Release Schedule — Two Stages Monthly, and Preliminary → Final for Annual Figures
Figures are published on two tracks, monthly and annual, and both come in two stages. For monthly data, the “first preliminary” release comes at the end of the month after the survey month, and the “second preliminary” at the end of the month after that. For annual data, “preliminary figures” come at the end of February of the following year and “final figures” around the end of June of the following year; the JTA’s release-schedule page notes that figures are “finalized with the calendar-year final report.” In other words, each month’s second preliminary release is not final either — each month’s value is finalized when the following year’s annual final figures are published. For 2025, the annual preliminary figures were released on February 27, 2026 and the annual final figures on July 6, 2026 (the schedule page had listed June 30).
Release schedule (example: stays in July 2025)
Source: Compiled by the HotelBank Editorial Team from the JTA’s “Tourism Statistics Release Schedule” and Overnight Travel Statistics Survey press releases
An excerpt of the 2026 release schedule (JTA release-schedule page, updated March 31, 2026) follows, and it shows that the end-of-month rhythm is fixed. If you use this statistic for market analysis, it is enough to remember that at the end of every month, the second preliminary figures for two months earlier and the first preliminary figures for the previous month come out together.
| Period covered | First preliminary | Second preliminary | Final |
|---|---|---|---|
| Calendar year 2025 | Preliminary: Feb 27, 2026 | — | Final: scheduled Jun 30, 2026 (actually released Jul 6) |
| January 2026 | Feb 27, 2026 | Mar 31, 2026 | Jun 30, 2027 (finalized with the calendar-year final report) |
| July 2026 | Aug 31, 2026 | Sep 30, 2026 | |
| August 2026 | Sep 30, 2026 | Oct 30, 2026 | |
| September 2026 | Oct 30, 2026 | Nov 30, 2026 | |
| December 2026 | Jan 29, 2027 | Feb 26, 2027 | |
| Calendar year 2026 | Preliminary: Feb 26, 2027 | — | Final: Jun 30, 2027 |
Source: Compiled by the HotelBank Editorial Team from the JTA’s “Tourism Statistics Release Schedule” (updated March 31, 2026). Release dates are subject to change
Key 2025 Final Figures — 61.6% Occupancy Is Still 1.1pt Short of 2019
According to the final figures released on July 6, 2026, total guest nights in 2025 came to 661.11 million (+0.3% YoY; +10.9% vs 2019), of which Japanese guests accounted for 481.18 million (−2.7% YoY; +0.2% vs 2019) and international guests for 179.92 million (+9.4% YoY; +55.6% vs 2019). Japanese guest nights fell for a second straight year, while international guest nights grew to nearly 180 million for the first time and lifted the total. The overall room occupancy rate was 61.6%, +2.0pt YoY and −1.1pt versus 2019 — one step short of pre-pandemic levels. By property type, ryokan were at 38.2% (+2.1pt YoY), resort hotels 56.9% (+2.8pt), business hotels 75.3% (+1.6pt), city hotels 74.1% (+1.8pt) and simple lodging 29.6% (+0.6pt). Business-hotel room occupancy exceeded 80% in three prefectures (two in 2024), and the prefecture with the highest overall occupancy was Osaka at 78.6%.
Source: Compiled by the HotelBank Editorial Team from the JTA’s “Overnight Travel Statistics Survey (2025 annual figures, final)” (July 6, 2026)
The point to grasp in reading these numbers is that each property type sits at a different distance from 2019. Business hotels, at −0.5pt versus 2019, have almost fully recovered, while city hotels (−5.4pt), simple lodging (−3.8pt), resort hotels (−1.6pt) and ryokan (−1.4pt) still show a gap in occupancy terms. For city hotels this reads as rate taking priority over adding occupancy at a time when room rates rose sharply, so judging demand strength by occupancy alone would be misleading. Another point: levels such as 38.2% for ryokan and 29.6% for simple lodging reflect the structure of those property types — for ryokan with high per-room capacity and dormitory-style simple lodging, the capacity occupancy rate is closer to reality than the room occupancy rate. The JTA’s results (Excel) also include a capacity occupancy table (Table 6), so when analyzing ryokan or simple lodging we recommend setting the two side by side.
Source: Compiled by the HotelBank Editorial Team from the JTA’s “Overnight Travel Statistics Survey (2025 annual figures, final)” (July 6, 2026). Unit: million guest nights
Detailed 2025 results — the breakdown by nationality, total guest nights by prefecture and the regional spread of the international share — are covered on this site in JTA 2025 Annual Stats Deep Dive: Japanese -3.8%, Foreign +8.2% Structural Shift, so we do not repeat them here. The role of this article is to pin down how those numbers are produced, how they are revised and where they can be obtained.
How Much Preliminary and Final Figures Differ — In 2025 the Sign of the YoY Change Flipped
The most practical issue in using this statistic is how far the preliminary figures move by the time they are final. Checking the 2025 data against the JTA’s original documents, the annual preliminary figures released on February 27, 2026 put total guest nights at 653.48 million overall (−0.8% YoY), 475.61 million for Japanese guests (−3.8%) and 177.87 million for international guests (+8.2%). The final figures of July 6 revised these to 661.11 million (+0.3%), 481.18 million (−2.7%) and 179.92 million (+9.4%) respectively — upward revisions of +7.63 million overall, +5.57 million for Japanese guests and +2.05 million for international guests, each +1.2%. What was “2025 total guest nights below the previous year” at the preliminary stage became “above the previous year” in the final figures, so care is needed before drawing conclusions directly from the sign of the YoY change in preliminary figures.
| Metric (January–December 2025) | Preliminary (Feb 27, 2026) | Final (Jul 6, 2026) | Revision |
|---|---|---|---|
| Total guest nights, all (millions) | 653.48 (YoY −0.8%) | 661.11 (YoY +0.3%) | +7.63 (+1.2%) |
| Total guest nights, Japanese (millions) | 475.61 (−3.8%) | 481.18 (−2.7%) | +5.57 (+1.2%) |
| Total guest nights, international (millions) | 177.87 (+8.2%) | 179.92 (+9.4%) | +2.05 (+1.2%) |
| Room occupancy rate, overall | 61.8% | 61.6% | −0.2pt |
| Room occupancy rate, ryokan | 38.4% | 38.2% | −0.2pt |
| Room occupancy rate, resort hotels | 56.9% | 56.9% | 0.0pt |
| Room occupancy rate, business hotels | 75.3% | 75.3% | 0.0pt |
| Room occupancy rate, city hotels | 74.2% | 74.1% | −0.1pt |
| Room occupancy rate, simple lodging | 29.6% | 29.6% | 0.0pt |
Source: Compiled by the HotelBank Editorial Team from the JTA’s “Overnight Travel Statistics Survey (2025 annual figures, preliminary)” (February 27, 2026) and “(2025 annual figures, final) — changes from the preliminary figures released February 27” (July 6, 2026). Revision rates calculated by the HotelBank Editorial Team
Source: Difference between the preliminary (February 27, 2026) and final (July 6, 2026) 2025 annual figures of the JTA Overnight Travel Statistics Survey, calculated by the HotelBank Editorial Team
The direction of revisions follows a pattern. Total guest nights tend to build upward as a level, because questionnaires received after the preliminary release are added. The room occupancy rate, being a ratio, can move either way depending on the composition of the added questionnaires; in 2025 it was revised down slightly, by −0.2pt overall. The same thing happens monthly. Room occupancy for July 2026 was 60.8% overall, 40.6% for ryokan, 59.6% for resort hotels, 74.2% for business hotels, 71.9% for city hotels and 30.9% for simple lodging in the first preliminary release published August 31 (valid response rate 32.9%), and was revised to 61.0% overall, 40.2% for ryokan, 59.0% for resort hotels, 74.6% for business hotels, 71.9% for city hotels and 30.0% for simple lodging in the second preliminary release published September 30 (valid response rate 45.1%). The overall change was +0.2pt, but simple lodging moved −0.9pt, resort hotels −0.6pt and business hotels +0.4pt — at the property-type level, some months move by close to 1pt.
| Survey month and stage (release date) | Overall | 20 or more rooms | Fewer than 20 rooms |
|---|---|---|---|
| June 2026, second preliminary (Aug 31) | 44.6% | 52.1% | 31.6% |
| July 2026, first preliminary (Aug 31) | 32.9% | 40.1% | 20.4% |
| July 2026, second preliminary (Sep 30) | 45.1% | 53.8% | 30.1% |
| August 2026, first preliminary (Sep 30) | 36.5% | 43.8% | 23.6% |
| Property type | First preliminary (Aug 31) | Second preliminary (Sep 30) | Revision |
|---|---|---|---|
| Overall | 60.8 | 61.0 | +0.2pt |
| Ryokan | 40.6 | 40.2 | −0.4pt |
| Resort hotels | 59.6 | 59.0 | −0.6pt |
| Business hotels | 74.2 | 74.6 | +0.4pt |
| City hotels | 71.9 | 71.9 | 0.0pt |
| Simple lodging | 30.9 | 30.0 | −0.9pt |
Source: Compiled by the HotelBank Editorial Team from the JTA’s “Overnight Travel Statistics Survey (July 2026 first preliminary, June 2026 second preliminary)” (August 31, 2026) and “(August 2026 first preliminary, July 2026 second preliminary)” (September 30, 2026). Revisions calculated by the HotelBank Editorial Team
Looking at July 2026 data, in the roughly one month between the first and second preliminary releases, the valid response rate rises by +12.2pt overall, +13.7pt for properties with 20 or more rooms and +9.7pt for those with fewer than 20 (Table 5). Even so, properties with fewer than 20 rooms stay at around 30% at the second preliminary stage (31.6% for June, 30.1% for July), so responses from small properties remain thin to the end. The largest July revision was −0.9pt for simple lodging (Table 6). As this is a single month’s comparison it does not amount to a trend, but it is consistent with the view that property types with a heavier weighting of small properties are more prone to move with late-collected responses.
Three practical rules follow from this. First, settle annual conclusions on the final figures (end of June to July of the following year) and treat YoY changes in preliminary figures only as an indication of direction. Second, the monthly first preliminary release has a valid response rate in the 30% range, and finer property-type × prefecture cells can see larger revisions at the second preliminary release, so wait for the second release before comparing individual cells. Third, when setting figures beside a historical series, always note in the chart or table footnote which vintage (first preliminary, second preliminary or final) was used. The JTA itself states the distinction explicitly in its press releases — “figures for 2007–2025 are final, January–July 2026 are second preliminary, and August 2026 is first preliminary” — and following the same practice is the safe course. As measured evidence, a HotelBank cross-check of 15 months of press releases (April 2025 through June 2026 data) found total guest nights revised by a median of 1.77% and at most 3.44%, and the overall room occupancy rate by no more than 1.0pt, which supports these three rules.
Getting Prefecture- and Municipality-Level Data — Major Municipalities Published Monthly From January 2026
There are two entry points to the published data. One is the JTA’s Overnight Travel Statistics Survey page, which hosts the monthly results (Excel), the annual final results (Excel) and report (PDF), and a time-series table (Excel) linking data since 2007. The other is e-Stat, where, under government statistics code 00601020, the tables from Table 1 (number of properties) to Table 10 (total guest nights by residence) are stored in database format and can also be retrieved via the API. However, the database-format tables only go up to the 2014–2016 annual final figures (updated March 2019); values from 2017 onward are posted as Excel results files. In both cases the regional granularity is basically “property location (47 divisions and District Transport Bureaus),” i.e. down to prefectures and regional transport bureau blocks.
| What you want | Regional granularity | Where to get it | Updated |
|---|---|---|---|
| Room occupancy rate by prefecture and property type | 47 prefectures + transport bureau blocks | JTA monthly results (Excel), Table 8 (e-Stat database table ID 0003313904 covers 2014–2016 only) | Monthly (first and second preliminary), annual final |
| Total guest nights by prefecture (Japanese / international) | Same as above | JTA monthly results (Excel), Tables 2 and 4 (e-Stat database table ID 0003313520 covers 2014–2016 only) | Same as above |
| International guest nights by nationality (place of origin), by prefecture | Same as above (properties with 10 or more employees through 2025; properties with 20 or more rooms from January 2026) | JTA monthly results (Excel), Reference Table 1 (e-Stat database table ID 0003317699 covers 2014–2016 only) | Same as above |
| Long-run series since 2007 | National and prefectural | JTA time-series table (Excel) | Updated monthly |
| Total guest nights for areas finer than prefectures | 130 wide-area municipal divisions (e.g. Tokyo’s 23 wards / Tama area / islands; Hokkaido’s Ishikari / Shiribeshi / Kamikawa…) | JTA annual final figures, “Tabulation by wide-area municipality (130 divisions)” (Excel, from 2021 data). Annual totals and monthly figures for total guest nights and international guest nights | Once a year (when final figures are released) |
| Values for major municipalities (including room occupancy rate) | Major municipalities (185 municipalities in the July 2026 data) | JTA monthly results (Excel), Reference Tables 5–12 (from January 2026 data). Tabulations of actual collected questionnaires, shown only for categories with responses from 10 or more properties. For municipalities not listed, use each local government’s tourist visitor statistics (including the “Tourist Visitor Statistics Based on Common Standards”) | Monthly (first and second preliminary) |
Source: Compiled by the HotelBank Editorial Team from the structure of the JTA Overnight Travel Statistics Survey page and e-Stat (government statistics code 00601020)
Many readers search for “by municipality,” and from January 2026 data the survey’s monthly results include reference tables for “property location (major municipalities)” (Reference Tables 5–12). In the July 2026 data they cover 185 municipalities, showing the population and number of responding properties, total guest nights and number of guests, international total guest nights and number of guests, capacity occupancy rate, rooms used and room occupancy rate, by room-count size (1–9 rooms / 10–19 rooms / 20 or more rooms). However, these are straight tabulations of the actual questionnaires collected, with no estimation for non-respondents, and only categories with responses from 10 or more properties are shown, so they differ in nature from the prefecture-level estimates. For estimates covering areas finer than prefectures on an annual basis, the divisions to use are the “Tabulation by wide-area municipality (130 divisions)” attached to the annual final figures since 2021 data. It splits Hokkaido into nine divisions such as Ishikari, Shiribeshi and Kamikawa, Tokyo into three (the 23 wards, the Tama area and the islands), and Kanagawa into four (Yokohama/Kawasaki, Miura/Shonan, Kenou and Kensei), and reports annual totals and monthly figures for total guest nights and international guest nights. The wide-area municipal tabulation does not include room occupancy rates, and values for individual municipalities were not published for 2025 and earlier. To understand lodging activity in municipalities not covered by the major-municipality reference tables, or before 2025, the realistic approach is to combine these with the tourist visitor statistics published by local governments and the tourist visitor statistics the JTA maintains as a common standard.
If you use the e-Stat API, the room occupancy rate (prefecture × property type × month) is statistics table ID 0003313904, total guest nights (prefecture × month, Japanese / international) is 0003313520, number of guests is 0003313620, and number of properties is 0003313482. However, these database tables only hold annual final figures (including monthly values for each year) up to 2014–2016, and monthly and annual values from 2017 onward cannot be retrieved via the API. The realistic way to set the latest figures beside your own monthly occupancy is to import Table 8 of the results (Excel) that the JTA posts every month.
How the JTA Room Occupancy Rate Differs From Our OTA-Inventory-Based Occupancy
The JTA room occupancy rate and the occupancy rate (OCC) that MetroEngines Research estimates from OTA-listed inventory are both called “occupancy,” but their populations and definitions differ. The JTA figure takes responses from a sample drawn from a population of about 76,000 properties, including simple lodging and company/organization lodging facilities, and divides by each property’s rooms × days. Our estimate covers about 27,000 properties and about 1.26 million rooms whose activity can be confirmed on OTAs, out of about 168,000 properties we track nationwide, and estimates “rooms sold as a share of total rooms in an area” from the absorption of sales inventory published on OTAs; ryokan, minshuku and simple lodging not listed on OTAs are not included. For July 2026 nationwide, the JTA first preliminary figure was 60.8% (61.0% at the second preliminary) against 83.5% for our OTA-inventory basis, a gap of 22.7pt. That gap can be broken down into four factors — population, property-type mix, treatment of rooms in the denominator, and timing — and we do not recalculate it here.
Summary — Operators: “Respond and Gain a Benchmark”; Analysts: “Conclude on Final Figures”
The Overnight Travel Statistics Survey is conducted monthly by the JTA as a general statistical survey under the Statistics Act, and from the January 2026 survey it moved to a design that fully enumerates properties with 20 or more rooms and samples those with 1–19 rooms at prefecture-specific rates. It carries none of the penalty-backed reporting obligation imposed on fundamental statistical surveys, but it is the only official statistic that publishes room occupancy by prefecture × property type, and the benchmark that lets a property compare its own occupancy with the average for the same prefecture and property type becomes more precise with every property that responds. For operators who receive the questionnaire, the rational position is to treat responding as an investment in their own market data.
Those who use the numbers need practices that reflect the two-stage release. For the 2025 annual figures, the revision from preliminary to final raised total guest nights by +7.63 million (+1.2%), flipping the YoY change from −0.8% to +0.3%. Monthly, too, there are cases where room occupancy by property type moves close to 1pt between the first and second preliminary releases, so the finer the cells being compared, the more it pays to wait for finalization. In addition, because 2026 YoY figures may contain a break from the change in stratification basis, that fact should be noted in a footnote when connecting them to a long-run series. The latest prefecture-level values can be taken from the JTA results (Excel) (the e-Stat API only goes up to 2016), and from January 2026 data the monthly release carries actual-count tabulations for major municipalities. Municipalities not covered there have to be filled in with the annual tabulation by 130 wide-area municipal divisions and local government statistics. Knowing how this statistic is produced is the starting point for correctly reading the gap between the published figures and a property’s own numbers or our measurements.
Frequently Asked Questions
Q. We received an Overnight Travel Statistics Survey questionnaire. Is there a penalty for not responding?
A. No. The reporting obligation in Article 13 and the penalty in Article 61 of the Statistics Act apply only to fundamental statistical surveys, and the Overnight Travel Statistics Survey is a general statistical survey. That said, given that under the Statistics Act your responses are not used for anything other than statistics and are not disclosed externally, and that the precision of the prefecture × property-type room occupancy rate — one of the few official benchmarks available to your property — is determined by the number of responses, responding is well worth it.
Q. Should we use the preliminary or the final figures?
A. Use the final figures (released end of June to July of the following year) when drawing annual conclusions. For 2025, the revision from preliminary to final changed the YoY change in total guest nights from −0.8% to +0.3%. For monthly use, the second preliminary release (valid response rate in the 40% range) is more stable than the first (30% range), but in both cases each month’s value is finalized when the following year’s annual final figures are released.
Q. Where can we see room occupancy rates by municipality?
A. From January 2026 data, Reference Table 12 of the JTA monthly results (Excel) carries room occupancy rates for major municipalities (185 municipalities in the July 2026 data). These are tabulations of actual collected questionnaires, shown only for categories with responses from 10 or more properties. For 2025 and earlier, the smallest unit is the “Tabulation by wide-area municipality (130 divisions)” attached to the annual final figures since 2021 data (total guest nights and international guest nights only); for finer detail on lodging activity, the realistic approach is to combine it with each local government’s tourist visitor statistics.
Q. How should the room occupancy rate and the capacity occupancy rate be used?
A. Hotels sell by the room, so the room occupancy rate is closer to reality; for ryokan, where several people stay in one room, and dormitory-style simple lodging, also looking at the capacity occupancy rate makes it harder to misread the structure of the property type. Both are included by prefecture × property type in the JTA results (Excel; room occupancy in Table 8, capacity occupancy in Table 6) (the e-Stat database only goes up to 2016).
Related Articles
- JTA 2025 Annual Stats Deep Dive: Japanese -3.8%, Foreign +8.2% Structural Shift
- JTA Lodging Survey Switches Stratification from Staff to Room Count: A Data Read
References and Sources
■ Data sources
Japan Tourism Agency, Overnight Travel Statistics Survey: press releases (2025 annual preliminary and final figures; first/second preliminary releases for July and August 2026), survey overview, request-for-cooperation letter (April 2026), filling-in guide, Tourism Statistics Release Schedule; e-Stat (government statistics code 00601020); e-Gov Laws and Regulations Search (Statistics Act). The OTA-inventory-based estimated occupancy only cites figures published in our existing articles; no new tabulation was performed for this article.
■ Calculation assumptions
Revision sizes, revision rates and differences in valid response rates were calculated by the HotelBank Editorial Team as the difference between preliminary and final figures published by the JTA (revision rate = revision ÷ preliminary figure). Differences versus 2019 and versus the previous year use the JTA’s published figures as is. No forecasts or independent estimates were made.
■ Limitations and caveats
The first → second preliminary revision by property type covers only one month (July 2026) and does not indicate a typical revision size. 2026 YoY figures may contain a break due to the change in stratification basis. The JTA room occupancy rate is an estimate based on a sample survey, and its population and definition differ from occupancy estimated from OTA-listed inventory. Release dates are subject to change.
- Japan Tourism Agency, “Overnight Travel Statistics Survey” (page hosting results, time-series tables, tabulation by wide-area municipality (130 divisions), questionnaires and filling-in guides; updated September 30, 2026)
- Japan Tourism Agency, “Overview of the Overnight Travel Statistics Survey” (purpose, coverage, sampling method and property-type definitions)
- Japan Tourism Agency, Tourism Statistics Office, Tourism Strategy Division, “Conducting the Overnight Travel Statistics Survey (April, May and June 2026) (Request for Cooperation)” (April 2026)
- Japan Tourism Agency, “2026 Overnight Travel Statistics Survey Filling-in Guide (Form No. 2: 20–199 rooms)”
- Japan Tourism Agency press release, “Overnight Travel Statistics Survey (2025 annual figures, final)” (July 6, 2026) / Press release PDF
- Japan Tourism Agency press release, “Overnight Travel Statistics Survey (2025 annual figures, preliminary)” (February 27, 2026) / Press release PDF
- Japan Tourism Agency, “Overnight Travel Statistics Survey (July 2026 first preliminary, June 2026 second preliminary)” (August 31, 2026)
- Japan Tourism Agency, “Overnight Travel Statistics Survey (August 2026 first preliminary, July 2026 second preliminary)” (September 30, 2026)
- Japan Tourism Agency, “Tourism Statistics Release Schedule” (updated March 31, 2026)
- e-Stat, Portal Site of Official Statistics of Japan, “Overnight Travel Statistics Survey” (government statistics code 00601020; statistics type: general statistics)
- e-Gov Laws and Regulations Search, “Statistics Act (Act No. 53 of 2007)”, Articles 13, 19 and 61
- MetroEngines Research — occupancy estimates based on OTA-listed inventory (covering about 27,000 properties and about 1.26 million rooms with confirmed activity, out of about 168,000 properties nationwide). This article only cites figures from existing articles; no new tabulation was performed