

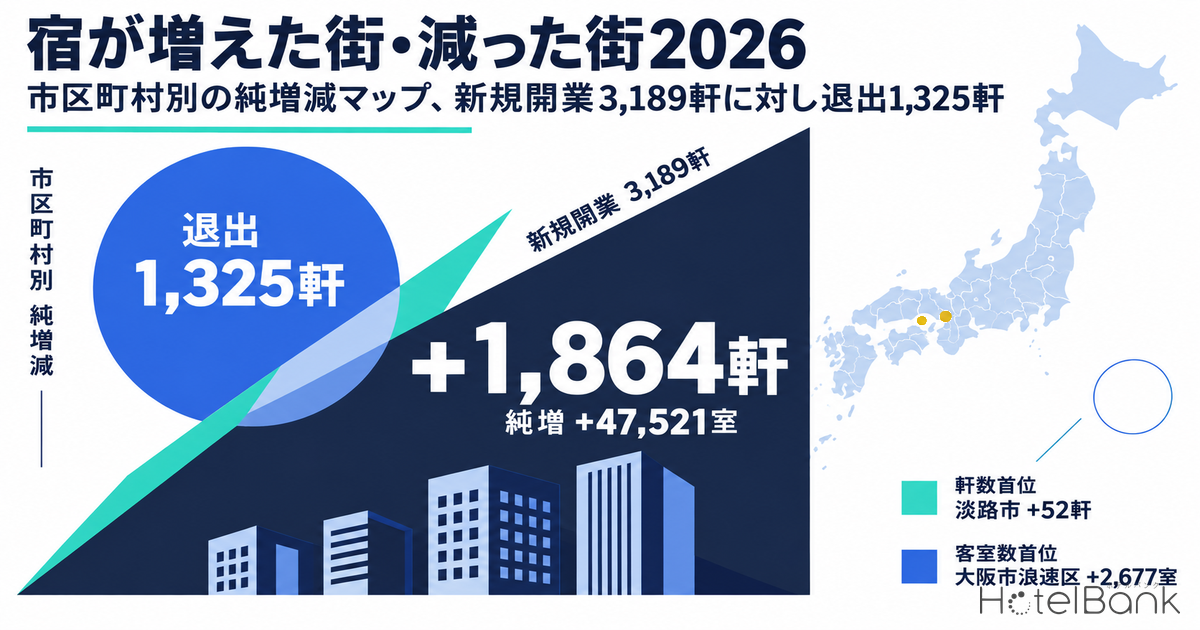
News of new openings shows only the properties that opened, but a market’s actual supply is determined by the difference between openings and exits. In this article, MetroEngines Research matches OTA-listed properties with observable prices between the same month two years apart, September 2024 and September 2026, and calculates “new openings,” “exits” and “net change” for each municipality in both property count and room count. Nationwide, the two years saw 3,189 new openings (69,176 rooms) against 1,325 exits (21,655 rooms), a net gain of +1,864 properties and +47,521 rooms. The largest gain by property count was Awaji City, Hyogo (+52 properties); the largest by room count was Naniwa Ward, Osaka (+2,677 rooms). The leader changes depending on which yardstick is used.
We map the municipalities with the largest net gains and net losses, then check how estimated transacted ADR absorbed the added supply in net-gain areas on a year-on-year basis, and look at rates and inventory take-up at the remaining properties in net-loss areas. Finally, we set the results against the building construction starts statistics (lodging use) of the Ministry of Land, Infrastructure, Transport and Tourism (MLIT) to show the gap between prefectures where construction starts are running ahead and prefectures where net gains have already appeared. We do not rank chains or groups; the analysis stays at the geographic unit of the municipality.
Metric Definitions Used in This Article
- Population: Among the domestic properties tracked by MetroEngines Research, those whose selling prices for the month could be observed on major booking sites (OTA-listed basis). September 2024: 30,280 properties / 1,432,422 rooms; September 2026: 36,342 properties / 1,540,898 rooms. Ryokan, minshuku and simple lodgings not listed on OTAs are not included, and this is not a complete census. The 329 pairs of properties whose name changed at the same location (rebrands) are treated as the same continuing property.
- New openings: Properties not listed in September 2024, listed in September 2026, and with a confirmed opening date of September 2024 or later. Properties whose opening date cannot be confirmed, and properties that opened earlier and newly began selling on OTAs (5,487 properties / 81,968 rooms), are excluded from the net-gain calculation as “existing properties newly listed” and shown separately.
- Exits: Properties listed in September 2024 and not listed in any of September 2025, October 2025, September 2026 or October 2026. Besides closures, this includes long-term suspensions for renovation and halted OTA sales (it does not indicate operating status itself).
- Net change = new openings minus exits. Calculated for both property count and room count. Ordinance-designated cities are aggregated by ward.
- ADR (average daily rate) = estimated transacted rate (tax-exclusive equivalent), calculated by applying a segment-specific adjustment factor to the lowest-plan level each property publishes on OTAs (per-room rate for two guests in one room, tax included). In a comparison with property-level actuals disclosed by listed hotel REITs (91 properties, most recent three months), the median error is about 7%. This is an estimate and differs from each property’s actual transacted prices and accounting figures. Area-level ADR is the median of the properties covered (the level of a typical property in the area).
- OCC (occupancy) = rooms sold as a share of total rooms in the area (an estimate based on OTA sales inventory; consistency checks against monthly figures published by REITs confirm accuracy to within roughly a few points). In this article it is written as “occupancy (estimated, OTA-listed inventory basis).” It is an estimate based on the take-up of inventory sold on OTAs and differs from the actual occupancy of a property as a whole. Where listed prices are mentioned, they are per-room rates for two guests in one room (tax included).
- Data sources: MetroEngines Research (based on confirmed OTA listings) / MLIT “Building Construction Starts Statistics” (e-Stat)
- — Net gain of +1,864 properties and +47,521 rooms — comparing the same month, September 2024 and September 2026: 3,189 new openings (69,176 rooms) against 1,325 exits (21,655 rooms).
- — 65.8% of openings by count have 5 rooms or fewer, yet they account for only 4.7% of rooms. The 212 properties with 100 or more rooms supply 63.3% of new rooms.
- — The leader changes — by property count it is Awaji City (+52 properties, +106 rooms); by room count it is Naniwa Ward, Osaka (+2,677 rooms, +11 properties).
- — Chuo Ward (Sapporo), Naha and Hakata Ward raised estimated transacted ADR by 19% to 27% versus two years earlier while each adding a net 1,000 rooms or so. Osaka’s two wards are down about 34% year on year but roughly flat versus two years earlier.
- — Construction starts lead in Gunma, Yamanashi and Nagano — start floor area per existing room is heavy but net gains are still small, so openings are likely to come through in earnest in 2025-27.
The National Picture — Two-Thirds of Openings Have 5 Rooms or Fewer; 100+ Room Properties Supply 60% of Rooms
First, the national picture. Of the 3,189 new openings over the two years, 2,099 (65.8%) have five rooms or fewer, yet their combined 3,283 rooms are only 4.7% of newly opened rooms. By contrast, properties with 100 or more rooms number 212, just 6.6% by count, but supply 43,754 rooms, or 63.3%. By property type, whole-unit rental villas, cottages and machiya-style houses recorded 1,751 openings in total but only 3,912 rooms; against the 388 openings and 38,683 rooms of business hotels, that is 4.5 times the count and one-tenth of the rooms. The sense that “there are more places to stay” and the supply-demand impact of “there are more rooms” have to be measured separately, or the market will be misread. The same pattern appears in 2026 openings alone: 48% of that year’s 1,414 new openings were whole-unit rentals, but they made up just 3% of rooms.
The exit side looks different. Of the 1,325 exits, only 31 properties (6,732 rooms) had 100 or more rooms; the count is made up of small properties ending their listings, such as 256 ryokan (4,081 rooms) and 238 minshuku and pensions (1,878 rooms). Average rooms per property are 21.7 for new openings and 16.3 for exits, so the turnover is making the market’s average property slightly larger. According to Teikoku Databank, 267 lodging businesses left the market in 2025, combining 89 bankruptcies with 178 suspensions, closures and dissolutions (Teikoku Databank, February 6, 2026), and the 1,325 exits in this article can be read as including, on top of corporate-level exits, the delisting of individually run minshuku and whole-unit rentals.
Source: MetroEngines Research (based on confirmed OTA listings), compiled by the HotelBank Editorial Team
Source: MetroEngines Research (based on confirmed OTA listings), compiled by the HotelBank Editorial Team
Note that 8,676 properties in total were not listed in September 2024 and were listed in September 2026; only the 3,189 with a confirmed opening date of September 2024 or later are counted as new openings. The remaining 5,487 properties (81,968 rooms) had been operating earlier and newly began selling on OTAs, or have no confirmable opening date. They add to supply in the sense of entering the OTA market, but are not included in this article’s net gain. This treatment puts the net-gain figure on the conservative side.
The size of the net gain also depends on how broadly “exits” and “entries” are defined. The table below varies the definition along two axes. Taking exits broadly as simply “not listed in September 2026” raises exits to 2,614 properties and shrinks the net gain to +575. The 1,289-property difference consists of properties that were listed in September/October 2025 or in October 2026, and appears to be mainly seasonal closures and temporary sales halts. Conversely, counting the 5,487 existing properties newly listed as entries widens the net gain to +7,351. Including both broad exits and new listings gives +6,062, which matches the change in the number of listed properties itself (30,280 to 36,342). The net gain is positive under every definition, and this article’s +1,864 properties is a middle value limited to “newly built rooms” and “permanent exits.”
| Exit definition \ Entry scope | New openings only (3,189 properties) | Including existing properties newly listed (8,676 properties) |
|---|---|---|
| Strict: not listed in any of Sep/Oct 2025 or Sep/Oct 2026 (1,325 properties) | +1,864 properties (+47,521 rooms) *definition used in this article | +7,351 properties (+129,489 rooms) |
| Broad: not listed in Sep 2026 (2,614 properties) | +575 properties | +6,062 properties (matches the change in listed properties) |
Source: MetroEngines Research (based on confirmed OTA listings), compiled by the HotelBank Editorial Team. Room counts are calculated only for exits under the strict definition. The 329 rebrand pairs are treated as continuing.
Where Property Counts Rose — Awaji +52, with Small Openings Spreading Across Beppu, Yufu, Hakone and Atami
By property count, the largest net gains are Awaji City (+52), Hakata Ward (+34), Beppu (+33), Atami (+31), and Taito Ward, Hakone and Yufu (+30 each). In Awaji, 52 of the 54 new openings are rental villas or cottages, and against a net gain of 52 properties the net gain in rooms is only 106. In Yufu too, 30 of the 35 new openings have five rooms or fewer, for a net gain of 88 rooms. In Yufuin, large-scale development is restrained under the town’s own ordinance (the “Uruoi no Aru Machizukuri” community development ordinance), and the pattern of small inns adding up in count is consistent with that framework.
Hakata Ward and Chuo Ward in Fukuoka are different in character. Of Hakata Ward’s 38 new openings, 13 (one-third) have five rooms or fewer, and the net room gain is 532. Chuo Ward gained a net 570 rooms from 27 openings; here hostels, business hotels and city hotels are lifting both property and room counts. Estimated transacted ADR in Hakata Ward was ¥14,200 in September 2026 (+19.0% versus two years earlier, N=151 properties) and occupancy (estimated, OTA-listed inventory basis) was 91.8% (141 properties covered), so both rate and occupancy remain high even after supply increased.
| Rank | Municipality | New openings (properties / rooms) | Exits (properties / rooms) | Net gain (properties) | Net gain (rooms) | Openings with 5 rooms or fewer | Estimated transacted ADR, Sep 2026 (vs 2 years earlier) |
|---|---|---|---|---|---|---|---|
| 1 | Awaji | 54 / 108 | 2 / 2 | +52 | +106 | 50 (93%) | ¥17,685 (+18.1%) |
| 2 | Hakata (Fukuoka) | 38 / 604 | 4 / 72 | +34 | +532 | 13 (34%) | ¥14,241 (+19.0%) |
| 3 | Beppu | 37 / 306 | 4 / 57 | +33 | +249 | 24 (65%) | ¥14,486 (+5.2%) |
| 4 | Atami | 40 / 524 | 9 / 24 | +31 | +500 | 27 (68%) | ¥22,713 (+17.8%) |
| 5 | Taito (Tokyo) | 35 / 1,322 | 5 / 174 | +30 | +1,148 | 12 (34%) | ¥13,366 (+10.8%) |
| 6 | Hakone | 41 / 248 | 11 / 193 | +30 | +55 | 28 (68%) | ¥25,858 (+7.3%) |
| 7 | Yufu | 35 / 114 | 5 / 26 | +30 | +88 | 30 (86%) | ¥23,153 (-0.6%) |
| 8 | Ito | 46 / 107 | 18 / 87 | +28 | +20 | 42 (91%) | ¥19,215 (-9.1%) |
| 9 | Shimogyo (Kyoto) | 37 / 865 | 11 / 511 | +26 | +354 | 17 (46%) | ¥13,921 (+21.9%) |
| 10 | Chuo (Fukuoka) | 27 / 616 | 1 / 46 | +26 | +570 | 10 (37%) | ¥14,444 (+9.0%) |
Source: MetroEngines Research, compiled by the HotelBank Editorial Team (based on confirmed OTA listings, Sep 2024 to Sep 2026. ADR is estimated transacted ADR; properties covered per month N=17 to 193)
Source: MetroEngines Research (based on confirmed OTA listings), compiled by the HotelBank Editorial Team
Where Room Counts Rose — Naniwa Ward +2,677; Naha, Sapporo, Osaka Chuo and Taito Top 1,000 Rooms
Re-sort by room count and the lineup changes completely. First is Naniwa Ward, Osaka: 17 new openings (2,868 rooms) against 6 exits (191 rooms), a net gain of +2,677 rooms. That is growth of +33.7% on the 7,935 rooms listed as of September 2024, and a single property, the 2,055-room APA Hotel & Resort Osaka Namba Ekimae Tower (アパホテル&リゾート〈大阪なんば駅前タワー〉), which opened in December 2024 (Travel Watch, 2024), accounts for most of the net gain. A ward that was outside the top ranks by property count, at +11, stands first in the country by rooms.
From second place down: Naha (+1,385 rooms), Chuo Ward, Sapporo (+1,283), Chuo Ward, Osaka (+1,276), Taito Ward (+1,148), Urayasu (+891), Ozu Town, Kumamoto (+881), Minato Ward (+874), Kutchan (+725) and Chitose (+671). Urayasu added 891 rooms from three openings and Ozu 881 rooms from six; a handful of large properties of 150 to 300 rooms each are redrawing these towns’ supply. Ozu had 9 properties and 943 rooms listed as of September 2024, so its rooms have nearly doubled in two years, a cluster of limited-service hotels anticipating semiconductor-related demand around Kumamoto Airport.
| Rank | Municipality | New openings (properties / rooms) | Exits (properties / rooms) | Net gain (rooms) | Net gain (properties) | vs Sep 2024 | Estimated transacted ADR, Sep 2026 (YoY / vs 2 years earlier) | Occupancy (estimated, OTA-listed inventory basis) |
|---|---|---|---|---|---|---|---|---|
| 1 | Naniwa (Osaka) | 17 / 2,868 | 6 / 191 | +2,677 | +11 | +33.7% | ¥10,150 (-34.7% / +2.2%) | 77.1% (N=45) |
| 2 | Naha | 21 / 1,860 | 14 / 475 | +1,385 | +7 | +6.4% | ¥9,709 (+8.6% / +25.6%) | 87.8% (N=179) |
| 3 | Chuo (Sapporo) | 22 / 1,531 | 5 / 248 | +1,283 | +17 | +5.0% | ¥16,122 (+7.2% / +27.2%) | 92.7% (N=103) |
| 4 | Chuo (Osaka) | 14 / 2,154 | 8 / 878 | +1,276 | +6 | +3.7% | ¥10,578 (-34.0% / -1.8%) | 82.9% (N=130) |
| 5 | Taito (Tokyo) | 35 / 1,322 | 5 / 174 | +1,148 | +30 | +5.6% | ¥13,366 (+4.4% / +10.8%) | 89.6% (N=145) |
| 6 | Urayasu | 3 / 891 | 0 / 0 | +891 | +3 | +7.3% | ¥22,360 (-4.4% / +8.9%) | 89.4% (N=15) |
| 7 | Ozu (Kumamoto) | 6 / 881 | 0 / 0 | +881 | +6 | +93.4% | — | — |
| 8 | Minato (Tokyo) | 18 / 874 | 0 / 0 | +874 | +18 | +2.9% | ¥16,078 (-6.6% / +10.6%) | 89.4% (N=98) |
| 9 | Kutchan | 16 / 894 | 15 / 169 | +725 | +1 | +23.5% | ¥16,963 (+0.7% / -0.2%) | — |
| 10 | Chitose | 7 / 720 | 1 / 49 | +671 | +6 | +22.1% | ¥13,732 (+0.6% / +21.6%) | 93.1% (N=20) |
Source: MetroEngines Research, compiled by the HotelBank Editorial Team (based on confirmed OTA listings. Occupancy is for September 2026 on a fixed cohort of covered properties and is not shown where fewer than 10 properties are covered. Estimated transacted ADR is not shown for Ozu Town and Higashi Ward, Sapporo because few properties are covered)
Source: MetroEngines Research (based on confirmed OTA listings), compiled by the HotelBank Editorial Team
Net Gain and Net Loss Map — Two Years of Geography by Room Count
The map below overlays the top 15 municipalities by net room gain (blue), the top 10 by net room loss (red outline) and the top 10 by net gain in property count (light blue). Circle size is proportional to the absolute net change in rooms. Net room gains are concentrated in big-city cores and around airports (Osaka, Tokyo, Sapporo, Fukuoka, Naha), while net gains in property count spread across tourist destinations such as Awaji Island, Beppu, Yufuin, Hakone, Atami and Fujikawaguchiko. Net losses appear in the mountain resorts of Nagano, Niigata and Hokkaido, and in Yokohama Minato Mirai, where a renovation closure coincided.
Source: MetroEngines Research (based on confirmed OTA listings), compiled by the HotelBank Editorial Team (circle size = absolute net change in rooms).
Rates in Net-Gain Areas — Osaka’s Two Wards Show an Expo Rebound; Sapporo, Naha and Hakata Raised Rates as Supply Grew
How did rates move where supply grew? Lining up estimated transacted ADR at three points (September 2024, September 2025 and September 2026), Naniwa Ward, Osaka went from ¥9,900 to ¥15,500 to ¥10,200 (N=50/51/56 properties): down sharply by 34.7% year on year, but up 2.2% versus two years earlier. Chuo Ward, Osaka followed the same shape, from ¥10,800 to ¥16,000 to ¥10,600, for -34.0% year on year and -1.8% versus two years earlier. September 2025 fell in the closing weeks of Expo 2025 Osaka, Kansai, and the year-on-year figure for September 2026 includes the rebound from it. Over a two-year span, it is reasonable to read this as the two wards together absorbing a net gain of roughly 4,000 rooms at flat rates. A comparison of Shinsaibashi’s post-Expo rebound with Kure’s supply increase in summer 2026 points the same way: the rebound from a peak-demand period, more than the supply increase itself, drives the year-on-year figure.
Meanwhile, Chuo Ward, Sapporo went from ¥12,700 to ¥15,000 to ¥16,100 (+7.2% year on year, +27.2% versus two years earlier), Naha from ¥7,700 to ¥8,900 to ¥9,700 (+8.6%, +25.6%) and Hakata Ward from ¥12,000 to ¥12,600 to ¥14,200 (+13.1%, +19.0%), raising rates by double digits while digesting net gains of around 1,000 rooms. Occupancy (estimated, OTA-listed inventory basis) is also high, at 92.7% in Chuo Ward, Sapporo, 87.8% in Naha and 91.8% in Hakata, and in these cities the added supply can be said to be at the stage of being absorbed by demand. Taito Ward was more gradual, from ¥12,100 to ¥13,400 (+10.8% versus two years earlier), and Minato Ward paused at -6.6% year on year while still holding +10.6% versus two years earlier.
Source: MetroEngines Research, compiled by the HotelBank Editorial Team (estimated transacted ADR; properties covered per month N=24 to 193. ADR in this article is an estimate, with a median error of about 7% against REIT-disclosed actuals)
Where Supply Shrank — How to Read Places Where Scarcity Has Risen
By room count, the largest net losses are Nishi Ward, Yokohama (-858 rooms), Hakuba (-295), Ibusuki (-283), Niseko Town (-260), Shika (-235), Narita (-205) and Yamanouchi (-195). In Nishi Ward, Yokohama, the main cause is that a large city hotel in Minato Mirai closed from the end of March 2025 for major repairs (Yokohama Royal Park Hotel (横浜ロイヤルパークホテル) renewal notice, April 2025), with reopening planned for fiscal 2028. It is not a permanent exit, but in the meantime estimated transacted ADR at the remaining properties rose sharply, from ¥15,200 to ¥17,500 to ¥23,300 (+33.4% year on year, N=17 properties), and occupancy (estimated, OTA-listed inventory basis) stands at 85.9%. Where supply has temporarily thinned, the scarcity of the remaining properties is showing up in rates.
Mountain resorts are a somewhat different story. Hakuba had 21 new openings (111 rooms) against 40 exits (406 rooms), with heavy turnover among small lodges and pensions. However, 120 existing properties (978 rooms) were newly listed, so the base of accommodation bookable on OTAs has widened more than the net-loss figure suggests. Estimated transacted ADR is trending up, from ¥9,400 to ¥12,000 (+26.7% versus two years earlier), and occupancy (estimated, OTA-listed inventory basis) is 85.5%. Yamanouchi (Shiga Kogen and Yudanaka-Shibu Onsen) likewise shows estimated transacted ADR of ¥11,400 (+2.8% year on year) and occupancy of 88.5% (September 2026, N=28 properties), a situation in which the remaining inns are more readily chosen to the extent that rooms have decreased. It is also worth noting that while Kutchan has a net gain of +725 rooms, neighboring Niseko Town has a net loss of -260 rooms, so the center of gravity of supply is shifting within the same Niseko area.
Ibusuki fell by 283 rooms with the delisting of one large resort; estimated transacted ADR is ¥12,500 (-13.1% year on year) and occupancy only 71.3% (September 2026, N=14 properties). Reduced supply has not translated directly into higher rates, and for the remaining properties the upside lies in how to reflect a unique local resource, sand-steam bathing, in price. Narita also has a net loss of 205 rooms, but estimated transacted ADR of ¥7,800 (+6.5% year on year) and occupancy of 83.3% (September 2026, N=14 properties) are firm; with supply tightened relative to airport demand, revenue opportunities for existing properties have widened accordingly.
| Rank | Municipality | Listed Sep 2024 (rooms / properties) | Exits (properties / rooms) | New openings (properties / rooms) | Net change (rooms) | Estimated transacted ADR, Sep 2026 (YoY) | Occupancy (estimated, OTA-listed inventory basis) |
|---|---|---|---|---|---|---|---|
| 1 | Nishi (Yokohama) | 5,230 / 21 | 3 / 863 | 1 / 5 | -858 | ¥23,349 (+33.4%) | 85.9% (N=10) |
| 2 | Hakuba | 2,981 / 264 | 40 / 406 | 21 / 111 | -295 | ¥11,961 (+8.0%) | 85.5% (N=14) |
| 3 | Ibusuki | 1,415 / 34 | 1 / 285 | 2 / 2 | -283 | ¥12,461 (-13.1%) | 71.3% (N=14) |
| 4 | Niseko Town | 1,006 / 41 | 5 / 262 | 2 / 2 | -260 | ¥13,784 (-2.1%) | — |
| 5 | Shika (Ishikawa) | 354 / 20 | 2 / 235 | 0 / 0 | -235 | — | — |
| 6 | Narita | 9,039 / 37 | 3 / 246 | 2 / 41 | -205 | ¥7,820 (+6.5%) | 83.3% (N=14) |
| 7 | Yamanouchi | 3,556 / 132 | 11 / 246 | 2 / 51 | -195 | ¥11,387 (+2.8%) | 88.5% (N=28) |
| 8 | Ishinomaki | 1,241 / 24 | 3 / 196 | 2 / 8 | -188 | ¥5,096 (-3.5%) | — |
| 9 | Funabashi | 1,647 / 24 | 2 / 177 | 0 / 0 | -177 | ¥10,643 (+18.2%) | — |
| 10 | Hokuto (Yamanashi) | 1,805 / 135 | 12 / 219 | 13 / 56 | -163 | ¥12,472 (-14.9%) | 82.6% (N=36) |
Source: MetroEngines Research, compiled by the HotelBank Editorial Team (based on confirmed OTA listings. Exits include renovation closures and halted OTA sales as well as closures. ADR and occupancy are not shown for municipalities with fewer than 10 properties covered)
Net losses by property count are concentrated in the ski resorts of Nagano, Niigata and Gunma: Hakuba (-19), Nozawa Onsen (-10), Yamanouchi (-9), Katashina (-6), and Myoko and Otari (-5 each). Many properties here operate seasonally, mainly in winter, so it should be noted that whether a property is listed in September does not always match its year-round operating status; but because September is compared with September, seasonal factors cancel out. Estimated transacted ADR went from ¥10,700 to ¥11,800 in Nozawa Onsen (+10.4% versus two years earlier) and from ¥9,600 to ¥10,000 in Katashina (+4.2%), so rates have held or risen even as counts fell, and the scarcity of the remaining inns is reflected in price.
| Rank | Municipality | Listed Sep 2024 (properties / rooms) | Exits (properties / rooms) | New openings (properties / rooms) | Net change (properties) | Net change (rooms) | Estimated transacted ADR, Sep 2026 (YoY) |
|---|---|---|---|---|---|---|---|
| 1 | Hakuba | 264 / 2,981 | 40 / 406 | 21 / 111 | -19 | -295 | ¥11,961 (+8.0%) |
| 2 | Nozawa Onsen | 77 / 869 | 12 / 75 | 2 / 8 | -10 | -67 | ¥11,815 (-2.7%) |
| 3 | Yamanouchi | 132 / 3,556 | 11 / 246 | 2 / 51 | -9 | -195 | ¥11,387 (+2.8%) |
| 4 | Katashina | 73 / 946 | 7 / 66 | 1 / 25 | -6 | -41 | ¥9,955 (-0.1%) |
| 5 | Myoko | 100 / 2,066 | 10 / 88 | 5 / 26 | -5 | -62 | — |
| 6 | Otari | 38 / 974 | 5 / 65 | 0 / 0 | -5 | -65 | — |
| 7 | Iiyama | 31 / 501 | 4 / 49 | 0 / 0 | -4 | -49 | — |
| 8 | Kamigyo (Kyoto) | 83 / 1,070 | 9 / 36 | 5 / 78 | -4 | +42 | — |
| 9 | Sakyo (Kyoto) | 63 / 1,461 | 6 / 34 | 2 / 30 | -4 | -4 | — |
| 10 | Niseko Town | 41 / 1,006 | 5 / 262 | 2 / 2 | -3 | -260 | ¥13,784 (-2.1%) |
Source: MetroEngines Research, compiled by the HotelBank Editorial Team (based on confirmed OTA listings. Estimated transacted ADR is not shown for municipalities with few properties covered)
Checking Against Construction Starts — Starts Lead in Gunma, Yamanashi and Nagano; Net Gains Lead in Kumamoto, Yamaguchi and Tottori
To read what comes next in supply, one has to look at construction starts, which appear one to two years before opening. In MLIT’s “Building Construction Starts Statistics,” buildings for lodging use (all structures) nationwide went from 1,200,531 sqm and 2,374 buildings in 2022 to 902,844 sqm and 2,222 buildings in 2023 and 1,756,286 sqm and 2,836 buildings in 2024, with floor area in 2024 jumping to nearly double the previous year. By prefecture, start floor area over the two years 2023-24 was largest in Tokyo (598,193 sqm), followed by Hokkaido (262,535 sqm), Osaka (197,553 sqm), Okinawa (158,478 sqm) and Chiba (108,445 sqm).
Converting this to a per-room basis against existing rooms as of September 2024 shows the relative weight of starts. Gunma carries the heaviest starts in the country at 3.46 sqm per existing room, yet its two-year net room gain is only +882 rooms (+4.2%). Tottori (3.32 sqm), Tokyo (3.15 sqm), Oita (3.12 sqm) and Yamanashi (2.95 sqm) also have heavy starts. Net change is +0.7% in Yamanashi, -1.1% in Nagano and -0.7% in Kanagawa, so net gains have not yet appeared relative to starts. In these prefectures openings are likely to come through in earnest over 2025-27, and it is too early to read the current net loss or flat trend as “supply has stopped.” A prefecture-level estimate of future room supply based on construction starts captures Gunma’s lead in starts in the same way.
Conversely, net gains are running ahead of the weight of starts in Kumamoto (net gain of +8.4% against 1.91 sqm per room), Yamaguchi (2.15 sqm, +9.2%), Okayama (1.79 sqm, +8.2%) and Kagawa (2.77 sqm, +8.3%). This can be interpreted as projects started in or before 2022 opening in 2024-26, and given the small start floor area, new supply over the next two years may not be as thick as this time. Note that the construction starts statistics are available as final figures through 2024; 2025 data are not covered in this article because of a change in use classification.
Source: MLIT “Building Construction Starts Statistics” (e-Stat), MetroEngines Research, compiled by the HotelBank Editorial Team (X axis = lodging-use start floor area in 2023-24 divided by existing listed rooms as of Sep 2024; Y axis = net room growth rate, Sep 2024 to Sep 2026; circle size = start floor area)
| Rank | Prefecture | Lodging-use start floor area, 2023-24 total | Buildings started | Start floor area per existing room | New openings (properties / rooms) | Exits (properties / rooms) | Net gain (rooms, vs Sep 2024) |
|---|---|---|---|---|---|---|---|
| 1 | Tokyo | 598,193 sqm | 96 | 3.15 sqm | 191 / 6,134 | 36 / 1,143 | +4,991 (+2.6%) |
| 2 | Hokkaido | 262,535 sqm | 312 | 2.76 sqm | 239 / 5,438 | 86 / 1,286 | +4,152 (+4.4%) |
| 3 | Osaka | 197,553 sqm | 32 | 1.70 sqm | 85 / 8,369 | 37 / 2,601 | +5,768 (+5.0%) |
| 4 | Okinawa | 158,478 sqm | 229 | 2.85 sqm | 191 / 3,746 | 126 / 1,103 | +2,643 (+4.7%) |
| 5 | Chiba | 108,445 sqm | 348 | 2.08 sqm | 143 / 2,683 | 55 / 802 | +1,881 (+3.6%) |
| 6 | Kanagawa | 83,823 sqm | 76 | 1.60 sqm | 86 / 907 | 35 / 1,296 | -389 (-0.7%) |
| 7 | Shizuoka | 79,558 sqm | 133 | 1.57 sqm | 155 / 1,286 | 71 / 474 | +812 (+1.6%) |
| 8 | Gunma | 72,041 sqm | 361 | 3.46 sqm | 68 / 1,216 | 35 / 334 | +882 (+4.2%) |
| 9 | Nagano | 69,420 sqm | 301 | 1.60 sqm | 134 / 1,153 | 134 / 1,651 | -498 (-1.1%) |
| 10 | Kyoto | 58,283 sqm | 113 | 0.99 sqm | 166 / 2,532 | 88 / 1,185 | +1,347 (+2.3%) |
| 11 | Oita | 58,033 sqm | 140 | 3.12 sqm | 89 / 1,147 | 16 / 167 | +980 (+5.3%) |
| 12 | Fukuoka | 56,725 sqm | 48 | 1.00 sqm | 117 / 2,502 | 18 / 367 | +2,135 (+3.8%) |
| 13 | Yamanashi | 53,865 sqm | 388 | 2.95 sqm | 105 / 576 | 44 / 448 | +128 (+0.7%) |
| 14 | Kagoshima | 52,505 sqm | 520 | 2.50 sqm | 92 / 1,203 | 31 / 507 | +696 (+3.3%) |
| 15 | Ishikawa | 52,314 sqm | 46 | 2.64 sqm | 41 / 1,137 | 19 / 335 | +802 (+4.1%) |
Source: MLIT “Building Construction Starts Statistics” (e-Stat; by use and structure, lodging use, all structures), MetroEngines Research, compiled by the HotelBank Editorial Team
Implications for Operators and Investors — Separate Property Count from Room Count, and Starts from Openings
First, the competitive environment of a trade area should be measured by rooms, not property count. In places like Awaji and Yufu, where whole-unit rentals push up the count, direct competitors for business hotels and city hotels have often not increased; rather, it can be read as a sign that different demand segments, such as families and groups, are flowing into the area. Conversely, in places like Naniwa Ward, Chuo Ward (Osaka) and Chuo Ward (Sapporo), where a few properties add more than 1,000 rooms, inventory competition becomes real for properties in the same price band.
Second, cities where rates are rising even though supply has grown (Chuo Ward in Sapporo, Naha, Hakata Ward, Chuo Ward in Fukuoka, Kita Ward in Okayama, Minami Ward in Hiroshima) appear to have demand capacity that is still expanding, leaving room for existing properties to test stepwise price increases. In places such as Osaka’s two wards, where the Expo rebound is in the numbers, the judgment should rest not on the year-on-year decline alone but on whether supply has been absorbed versus two years earlier.
Third, net-loss areas are closer to reality when read not as “the market shrank” but as “the scarcity of the remaining properties rose.” In Nishi Ward (Yokohama), Narita, Yamanouchi and Nozawa Onsen, rates have held or risen, a phase in which payback on renovation and equipment-renewal investment is easier to foresee. Places such as Ibusuki and Hokuto, where rates have not yet caught up, can be said to still have room to price in the value of their unique resources.
Finally, in Gunma, Yamanashi, Nagano, Kanagawa, Oita and Tottori, where construction starts are heavy, pricing strategy should factor in the opening rush of the coming two years. Now, before that supply arrives, may be the last window for existing properties to raise their rate baseline. Overlaying the schedule of 100+ room openings for October 2026 through March 2027 shows concretely in which cities supply will move first.
Summary
Comparing OTA-listed properties in the same month, September 2024 and September 2026, Japan’s lodging supply saw 3,189 new openings (69,176 rooms) and 1,325 exits (21,655 rooms), for a net gain of +1,864 properties and +47,521 rooms. By property count, Awaji, Hakata Ward, Beppu and Atami rank at the top; by room count, it is Naniwa Ward, Naha, Chuo Ward (Sapporo), Chuo Ward (Osaka) and Taito Ward. The leaders change with the yardstick. Among net-gain areas, Sapporo, Naha and Hakata grew estimated transacted ADR by double digits as supply increased, while Osaka’s two wards absorbed the supply at flat rates versus two years earlier despite the Expo rebound. In net-loss areas, rates at the remaining properties are rising in many places, and scarcity is turning into revenue opportunity. Set against construction starts, starts are running ahead in Gunma, Yamanashi, Nagano and Kanagawa, and supply over the next two years is expected to be thick in these prefectures. The divergence between property count and room count appears in the same form nationally and at the municipal level, and any discussion of supply should always state both units.
Frequently Asked Questions
Q. Does “exit” mean a property has closed?
No. In this article an exit is a property listed in September 2024 and not listed in any of September 2025, October 2025, September 2026 or October 2026; besides closures, it includes long-term suspensions for renovation and halted OTA sales. Please check each property’s official announcements for its operating status.
Q. Why compare the same month?
Seasonal properties, such as inns at ski areas and beaches, are listed in some months and not in others. Comparing different months would make seasonal opening and closing look like increases and decreases, so we compare September with September to cancel out seasonal factors.
Q. Why are existing properties newly listed not included in the net gain?
When a property that has long been operating newly begins selling on OTAs, it is an entry into the OTA market but not newly built rooms. Properties whose opening date cannot be confirmed are treated the same way, which makes the net gain a conservative figure.
Q. How does the net gain change if the definition of exit changes?
Widening exits to properties “not listed in September 2026” gives 2,614 exits and shrinks the net gain to +575 properties. Counting the 5,487 existing properties newly listed as entries widens it to +7,351. The net gain is positive under every combination, and this article’s +1,864 properties is limited to newly built rooms and permanent exits (Table 1).
Q. How should construction starts and net gains be read together?
Divide start floor area, which appears one to two years before opening, by existing rooms, and set it beside the two-year net room growth rate. Gunma has the heaviest starts at 3.46 sqm per existing room against a net gain of only +4.2%, so its openings are still to come. Kumamoto has a net gain of +8.4% against 1.91 sqm, so openings are already running ahead.
References and Sources
- MetroEngines Research — property and room data based on confirmed OTA listings (September 2024: 30,280 properties; September 2026: 36,342 properties), estimated transacted ADR, occupancy (estimated, OTA-listed inventory basis)
- MLIT “Building Construction Starts Statistics” (e-Stat, table ID 0003114547; by use and structure, lodging use, 2022-2024)
- Teikoku Databank: Lodging-industry bankruptcies total 89, up for a second straight year (February 6, 2026)
- Travel Watch: Opening of APA Hotel & Resort Osaka Namba Ekimae Tower (アパホテル&リゾート〈大阪なんば駅前タワー〉) (December 2024, 2,055 rooms)
- Yokohama Royal Park Hotel (横浜ロイヤルパークホテル) renewal notice (April 2025; closed from March 31, 2025, reopening planned for fiscal 2028)
- Japan Tourism Agency “Overnight Travel Statistics Survey”
■ Data sources
OTA-listed properties whose prices MetroEngines Research observes (September 2024: 30,280 properties / 1,432,422 rooms; September 2026: 36,342 properties / 1,540,898 rooms). Opening dates and room counts are from property information; municipal estimated transacted ADR is taken at three points (September 2024, September 2025 and September 2026); occupancy is an estimate on an OTA-listed inventory basis for September 2026. Construction starts are from MLIT’s “Building Construction Starts Statistics,” lodging use, all structures (2022-2024).
■ Assumptions
September is compared with September to cancel out seasonal opening and closing. New openings = properties with a confirmed opening date of September 2024 or later; exits = properties not listed in any of September/October 2025 or September/October 2026; net change = new openings minus exits. The 329 rebrand pairs are treated as continuing. Start floor area per existing room = start floor area in 2023-24 divided by existing listed rooms as of September 2024.
■ Limitations and caveats
Properties not listed on OTAs are not included, and this is not a complete census. Exits include renovation closures and halted OTA sales and do not equate to closures. Depending on the definitions of exit and entry, the net gain ranges from +575 to +7,351 properties (Table 1). Estimated transacted ADR is an estimate, with a median error of about 7% against REIT-disclosed actuals. Rates and occupancy are not shown for municipalities with fewer than 10 properties covered. Construction starts statistics for 2025 are not covered.