

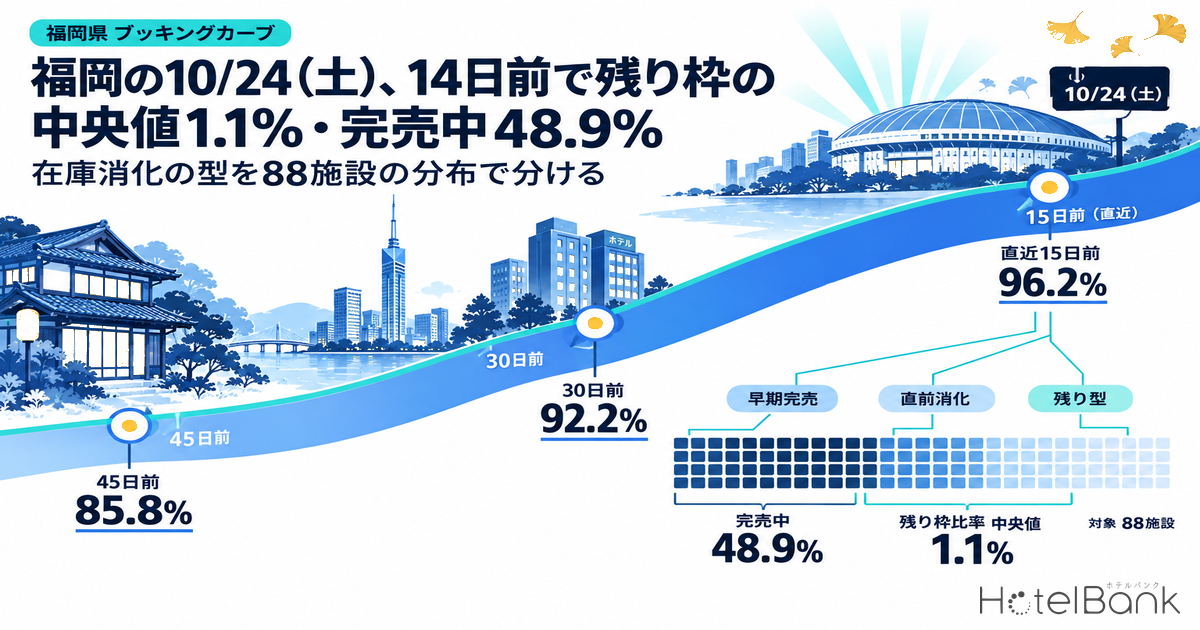
We tallied how far lodging properties in Fukuoka Prefecture have absorbed their inventory for Saturday, October 24, 2026, as an anonymized distribution. The scope is 88 properties (7,187 rooms in total) that list at least 30% of their total rooms on OTAs and similar channels. At the latest observation, 14–15 days before the stay date, the median remaining-inventory ratio was 1.1%, and 43 properties (48.9%) were “sold out” — no listed inventory could be found on OTAs. At 30 days out the median was 10.0% with 28 properties sold out, so over those two weeks the center of the distribution shifted another step toward zero. At the same time, 13 properties (14.8%) still had more than 30% of their rooms left: even on the same night in the same prefecture, inventory is not absorbed in a single pattern. This article first checks the prefecture-wide booking curve, then uses each property’s remaining inventory and sellout timing to sort properties into three broad patterns — “early sellout,” “late absorption” and “inventory remaining” — and sets out what each should review.
Scope: lodging properties in Fukuoka Prefecture (property-level tally N=88 properties; prefecture-wide booking curve N=429 properties / 29,269 rooms for the night of 10/24). This article does not cover price levels; occupancy and remaining inventory are both estimates based on OTA-listed inventory. Definitions are at the end of the article. Data as of: October 10, 2026.
- — Median 1.1% left, 48.9% sold out For the night of Saturday, October 24 in Fukuoka Prefecture, the observation 14–15 days before arrival showed a median remaining-inventory ratio of 1.1% across 88 properties, with 43 properties sold out (estimates based on inventory listed on OTAs and similar channels).
- — A high starting point The prefecture-wide estimate based on listed inventory was 85.8% at 45 days out, 92.2% at 30 days out and 96.2% at the latest reading, 15 days out. At 45 days out it was running about 15pt above the Saturdays on either side (70.5% for 10/17 and 72.8% for 10/31).
- — Sold out rose from 28 to 43 properties in the two weeks after 30 days out Properties with more than 30% left fell from 24 to 13 (14.8%), but even on the same night in the same prefecture, properties split to both ends.
- — Five types Early sellout: 27 properties (30.7%); late sellout: 16 (18.2%); nearly sold out: 18 (20.5%); 10–30% left: 14 (15.9%); over 30% left: 13 (14.8%).
- — The type decides what to review For the early-sellout type the issue is rate; for the late-absorption type, when to lift sales restrictions; for the inventory-remaining type, channel mix and length-of-stay design. Of the 54 properties that sold out at some point, 11 had put inventory back on sale at the latest reading.
Prefecture-Wide Booking Curve — At 45 Days Out, 10/24 Was 15pt Above the Saturdays on Either Side
As a basis for reading the property distribution, let us first establish how estimated OCC (based on OTA-listed inventory) built up across Fukuoka Prefecture as a whole. Each stay date uses a fixed cohort: for 10/24, 429 properties and 29,269 rooms in the prefecture (430–431 properties and 29,301–29,308 rooms for the other four stay dates), observed from 45 days before arrival to the latest reading. Saturday, October 24 had already reached 85.8% at 45 days out, starting roughly 15pt higher than Saturday, October 17 the week before (70.5%) and Saturday, October 31 the week after (72.8%).
Looking at the pickup from there, 10/24 reached 92.2% at 30 days out and 96.2% at the latest reading, 15 days out — a gain of +10.4pt from 45 days out. 10/17 rose +19.1pt, from 70.5% at 45 days out to 89.6% at its latest reading 8 days out, and 10/31 stood at 87.0% at 22 days out (+14.2pt), so the size of the gain itself was similar to or larger than 10/24’s. In other words, what sets 10/24 apart is not that it “picked up fast” but that it “started high and neared its ceiling early.”
Behind this is a large concert on the night itself. Mizuho PayPay Dome Fukuoka is scheduled to host the Fukuoka show of Stray Kids’ world tour on Saturday, October 24 (doors 16:30, show 18:30), and in the venue’s October event list the 24th is the only music event (October 14–20 is listed as a date block for the Climax Series professional baseball playoffs; sources are at the end of the article). The prefecture-wide curve for the following night, Sunday the 25th, stayed at the lowest level of the five nights — 63.0% at 45 days out and 78.7% at its latest reading, 16 days out — which is consistent with demand concentrating on the single Saturday night. The same pattern, with concert demand not spilling over into the nights before and after, has also been observed for the opening night of an arena concert in Hiroshima on Saturday, October 17.
Fukuoka Prefecture overall (10/24: N=429 properties / 29,269 rooms; other stay dates: 430–431 properties), estimated OCC (based on OTA-listed inventory). The x-axis shows days before the stay date. Source: Compiled by MetroEngines Research and the HotelBank Editorial Team
| Stay date | 45 days out | 30 days out | Latest (days out) | 45 days out → latest |
|---|---|---|---|---|
| Sat 10/17 | 70.5% | 77.8% | 89.6% (8 days out) | +19.1pt |
| Fri 10/23 | 70.4% | 76.3% | 86.2% (14 days out) | +15.8pt |
| Sat 10/24 | 85.8% | 92.2% | 96.2% (15 days out) | +10.4pt |
| Sun 10/25 | 63.0% | 71.4% | 78.7% (16 days out) | +15.7pt |
| Sat 10/31 | 72.8% | 82.4% | 87.0% (22 days out) | +14.2pt |
Fukuoka Prefecture overall, estimated OCC (based on OTA-listed inventory), observed from 45 days before the stay date to the latest reading. Source: Compiled by MetroEngines Research and the HotelBank Editorial Team
Splitting 10/24 by property type, business hotels (N=177 properties / 22,647 rooms) went from 88.8% at 45 days out to 97.1% at the latest reading, and city hotels (N=25 properties / 3,354 rooms) from 82.8% to 94.5% — both ran at high levels from an early stage. Ryokan (N=52 properties / 952 rooms), by contrast, started low at 59.2% at 45 days out and built up +29.9pt, to 78.8% at 30 days out and 89.1% at the latest reading. This reads as concert demand spreading from city-center hotels to surrounding ryokan with a time lag. That is the prefecture-wide picture; next we look at the same night as a property-level distribution.
Property-Level Distribution of Remaining Inventory — Median 1.1%, 48.9% Sold Out, 14.8% Over 30%
The property-level tally is limited to 88 of the 302 properties in the prefecture whose 10/24 inventory could be observed — those with a record of listing at least 30% of their total rooms on OTAs and similar channels. They comprise 40 business hotels, 30 ryokan, 7 city hotels and 11 others (hostels, resorts, etc.); by location, 24 are in Fukuoka City (Hakata, Chuo and Higashi wards), 14 in Kitakyushu City and 50 elsewhere in the prefecture, including Asakura, Yanagawa and Kurume. The remaining-inventory ratio is the number of rooms left listed on OTAs and similar channels divided by total rooms; “sold out” means no listed inventory can be found (an estimate). Estimated OCC and sellout counts can paint different pictures of the same night: OCC shows how much inventory is left across all properties combined, while the sellout count shows how many individual properties have closed.
At the latest observation (14–15 days before arrival), the quartiles of the distribution are 0.0% (Q1), 1.1% (median) and 15.9% (Q3) — the lower half is pinned at almost zero. Counting by band, 43 properties are sold out and 18 have 10% or less left, so 61 properties (69.3%) are on the “almost sold through” side. 14 have 10–30% left, 10 have 30–50% left, and only 3 have more than 50% left.
Overlaying the same 88 properties at 30 days out makes the movement concrete. At 30 days out the distribution was 28 sold out, 17 with 10% or less, 19 with 10–30%, 11 with 30–50% and 13 with more than 50%, and the median was 10.0%. In just over two weeks, sold-out properties rose by 15, from 28 to 43, while those with more than 30% left fell by 11, from 24 to 13. The median decline in each property’s remaining inventory from 30 days out to the latest reading was 4.6pt, roughly in step with the prefecture-wide curve’s pickup over the same period (92.2% → 96.2%).
Fukuoka Prefecture, night of 10/24: distribution of property-level remaining-inventory ratios (N=88 properties; same properties compared at 30 days out and the latest reading). Source: Compiled by MetroEngines Research and the HotelBank Editorial Team
Splitting by property type makes the difference in patterns clear. The 40 business hotels had a median of 0.0%, with 25 sold out (62.5%) and 31 (77.5%) at 10% or less including those sold out; even Q3 was 7.8%, so nearly all of them leaned toward the sold-through side. The 30 ryokan had a median of 6.7% and 12 sold out (40.0%) — a lower sellout share than business hotels — with Q3 at 28.3% and 7 properties over 30%, meaning a fair number approach the stay date still holding inventory. City hotels number only 7, so we do not show separate figures, but none was sold out and they cluster in the 10%-or-less band.
| Segment | N | Median rooms | Median remaining inventory (latest) | Sold out | 10% or less left (incl. sold out) | Over 30% left |
|---|---|---|---|---|---|---|
| All | 88 | 59.5 rooms | 1.1% | 43 properties (48.9%) | 61 properties (69.3%) | 13 properties (14.8%) |
| Business hotels | 40 | 104.5 rooms | 0.0% | 25 properties (62.5%) | 31 properties (77.5%) | 5 properties (12.5%) |
| Ryokan | 30 | 13.5 rooms | 6.7% | 12 properties (40.0%) | 18 properties (60.0%) | 7 properties (23.3%) |
| City hotels / other | 18 | Figures not shown by segment because N is small | ||||
Latest observation is 14–15 days before arrival. Remaining-inventory ratio = rooms left listed on OTAs and similar channels ÷ total rooms. Source: Compiled by MetroEngines Research and the HotelBank Editorial Team
Property size also tilts the picture. Splitting the 88 properties into thirds by room count, small properties (4–17 rooms, 29 properties) had a median of 8.3% left with 11 sold out, mid-sized properties (19–91 rooms, 29 properties) a median of 2.0% with 14 sold out, and large properties (91 rooms or more, 30 properties) a median of 0.0% with 18 sold out — the larger the property, the closer to sold through. Properties holding more than 30% of inventory numbered 5 small, 6 mid-sized and 2 large; by type, 7 ryokan, 5 business hotels and 1 city hotel, and all 5 of the small ones were ryokan.
Splitting by Sellout Timing — 27 Early Sellouts, 16 Late Sellouts, 18 Nearly Sold Out, 27 With Inventory Remaining
Current remaining inventory alone does not tell us “when the property closed.” So for properties that recorded a sellout at least once during the observation period, we looked at when a sellout was first observed. 54 of the 88 properties (61.4%) had sold out at some point: 18 had been sold out since 45 or more days before the stay date, 10 first sold out 31–45 days out, and 26 first sold out 15–30 days out. Because the latest observation is 14–15 days before the stay date, first sellouts after that are not yet covered.
What deserves attention is that 11 of the 54 properties that had sold out were back on sale at the latest reading. Tracking each property’s change from 30 days out to the latest reading, remaining inventory increased at 9 properties, which can be interpreted as group allotments or held inventory being released after selling out, or sales restrictions being lifted. The distribution shows that a sellout is not an end point but something managed together with putting inventory back on sale.
On that basis, we sorted the 88 properties into five types using latest remaining inventory and the timing of first sellout. “Early sellout” means currently sold out with the first sellout 30 or more days out; “late sellout” means currently sold out with the first sellout under 30 days out; “nearly sold out” means 10% or less left; and “10–30% left” and “over 30% left” are the respective bands. The breakdown is early sellout 27 properties (30.7%), late sellout 16 (18.2%), nearly sold out 18 (20.5%), 10–30% left 14 (15.9%) and over 30% left 13 (14.8%). The same framework — sorting properties into types by sellout timing and remaining inventory — is used in our analysis splitting 38 Yamagata business hotels into three inventory-absorption types.
Fukuoka Prefecture, night of 10/24: inventory-absorption types (N=88 properties, stacked by property type). Source: Compiled by MetroEngines Research and the HotelBank Editorial Team
| Type | Definition | Properties (share) | Of which business / ryokan | Median rooms | Max OTA listing share (median) |
|---|---|---|---|---|---|
| Early sellout | Sold out; first sellout 30+ days out | 27 (30.7%) | 15 / 7 | 74 rooms | 45.8% |
| Late sellout | Sold out; first sellout under 30 days out | 16 (18.2%) | 10 / 5 | 84.5 rooms | 68.2% |
| Nearly sold out | 10% or less left (excl. sold out) | 18 (20.5%) | 6 / 6 | 50 rooms | 51.0% |
| 10–30% left | Over 10% and up to 30% left | 14 (15.9%) | 4 / 5 | 16 rooms | 75.2% |
| Over 30% left | More than 30% left | 13 (14.8%) | 5 / 7 | 20 rooms | 90.0% |
Max OTA listing share = maximum number of rooms listed on OTAs and similar channels during the observation period ÷ total rooms. Source: Compiled by MetroEngines Research and the HotelBank Editorial Team
The makeup of each type differs too. The early-sellout type has a median of 74 rooms and the late-sellout type 84.5 rooms — mainly mid-to-large business hotels — and 25 of the 40 business hotels fell into these two types. The over-30%-left type, by contrast, is small, with a median of 20 rooms, and its median max OTA listing share is 90.0%: many of these properties sell almost all of their rooms through OTAs and similar channels. The same measure for the early-sellout type is only 45.8%, so the properties that closed early probably listed only about half of their rooms on OTAs to begin with and sold the rest through other routes. This difference in listed allocation is why the issues for the inventory-remaining types extend to channel mix.
For Revenue Managers Running Properties in Fukuoka Prefecture — Review Points and Action Plan by Type
Operator insights
1. Determine your own type first. For 10/24, mapping your property’s remaining-inventory ratio and first-sellout timing onto this article’s five types shows where you sit in the market. The median across the 88 properties in the prefecture is 1.1% and Q3 is 15.9%, so if more than 15.9% of your rooms are left you are in the top quarter — the “inventory remaining” side — and if you have zero left you are on the same side as the 43 sold-out properties.
2. The early-sellout type should review rate. On a night when prefecture-wide estimated OCC held high at 85.8% at 45 days out and 92.2% at 30 days out, 18 properties had been sold out since 45 or more days out. Closing early on a high-demand night means that, had inventory remained, higher-rate bookings arriving later might have been captured — there is room to look back at the selling conditions in place when the property closed.
3. For the late-absorption type, the issue is when to lift sales restrictions. Of the 54 properties that had sold out, 11 had put inventory back on sale at the latest reading. If held inventory is released late, there is little room left to absorb it once the prefecture-wide curve has reached 96.2% at 15 days out, so consider bringing the release decision forward, somewhere between 30 days out and the final days.
4. The inventory-remaining type goes back to channel and length-of-stay design. The 13 properties with more than 30% left have a high median max OTA listing share of 90.0%, and many are small. On a night when concert demand is skewed toward a single Saturday (the prefecture-wide curve for 10/25 was 78.7% at its latest reading), two-night conditions for Friday–Saturday or Saturday–Sunday and the design of direct channels may work before OTA pricing does.
| Time horizon | Action | Decision trigger (figures from this article) | Aim |
|---|---|---|---|
| Today to this week (14 days out) | Map your 10/24 remaining-inventory ratio and first-sellout date onto the types | Whether remaining inventory is above the 1.1% median, or above the 15.9% Q3 | Choose from the actions below according to type |
| Today to this week (early-sellout type) | Record the selling conditions at the time of closing alongside the prefecture-wide curve for that night | If the first sellout came 45+ days out, on a night when the prefecture was at 85.8% at 45 days out | Use it as input for revisiting rate settings for the next high-demand night |
| This week to next week (late-absorption type) | Set the release timing for held inventory and tentative group blocks, and track remaining inventory daily after release | When your remaining inventory falls to 10% or less (the same band as 61 properties in the prefecture) | Avoid missing last-minute demand |
| This week to next week (inventory-remaining type) | Revisit two-night conditions for Fri–Sat and Sat–Sun, and the visibility of direct channels | If remaining inventory is still over 30% (the band of 13 properties in the prefecture) at 10 days out | Spread demand concentrated on the Saturday night to the nights before and after |
| Final days to day of arrival | Manage remaining inventory for 10/24 and 10/25 separately, and set selling conditions for the 25th independently | On the premise that the prefecture-wide curve for the 25th is lower than the 24th, at 78.7% at its latest reading | Sell through the post-concert night on its own terms |
| Toward next month | Record your 10/24 type and outcome, and use them as decision criteria at 45 and 30 days out for the next large-concert night | Using this article’s three points — 45 days out → 30 days out → latest (85.8 → 92.2 → 96.2%) — as the benchmark | Make event-night inventory management repeatable |
Decision-trigger figures are this article’s tallies. Source: Compiled by MetroEngines Research and the HotelBank Editorial Team
Summary — Three Yardsticks for Reading the Remaining-Inventory Distribution
First, read the prefecture-wide curve by “how high it starts.” At 45 days out, 10/24 was already at 85.8%, about 15pt above the Saturdays on either side, and it reached 96.2% at the latest reading, 15 days out. Its gain was no different from other weekends, so on high-demand nights the level at an early point decides the outcome.
Second, read the property distribution by median and quartiles. Remaining inventory across the 88 properties had a median of 1.1% and a Q3 of 15.9%, splitting into two ends: 43 sold out (48.9%) and 13 with more than 30% left (14.8%). These two figures are enough to place your own property.
Third, read sellouts together with their timing. Of the 54 properties that had sold out, 18 did so 45 or more days out, 10 at 31–45 days out and 26 at 15–30 days out, and 11 put inventory back on sale after selling out. This article’s conclusion is that the review points change by type: rate for the early-sellout type, the timing of lifting sales restrictions for the late-absorption type, and channels and length of stay for the inventory-remaining type.
Frequently Asked Questions
Q. How is “sold out” determined?
A. A property is treated as sold out when its listed inventory can no longer be found on OTAs and similar channels (an estimate). This can include properties that have simply stopped listing, so it is not the same as actual room occupancy.
Q. Why was the property-level tally limited to 88 properties?
A. It is limited to properties with a record of listing at least 30% of their total rooms on OTAs and similar channels. For properties that list only a small share, changes in remaining inventory do not reflect inventory absorption.
Q. How do I tell which type my property falls into?
A. Apply your 10/24 remaining-inventory ratio (rooms left listed on OTAs and similar channels ÷ total rooms) and the date you first sold out to the definitions of this article’s five types. Whether your remaining inventory is above the 1.1% median, or above the 15.9% Q3, is a useful guide.
About the Data
| Estimated OCC | OTA-listed-inventory occupancy = 100 − 100 × rooms left listed on OTAs ÷ total rooms. Covers a fixed cohort of properties that list at least 30% of their total rooms on OTAs (the same set of properties for each stay date; the property counts shown in the table are that set). It is an estimate based on how inventory sold on OTAs is being absorbed and is defined differently from actual room occupancy (it reads high, because rooms not listed are counted as absorbed). Written in this article as “estimated OCC (based on OTA-listed inventory).” Target month: October 2026. |
| Booking curve | Based on observations from 45 days before the stay date to the latest reading. The prefecture-wide curve covers 429 properties / 29,269 rooms in Fukuoka Prefecture for 10/24, and 430–431 properties / 29,301–29,308 rooms for the other four stay dates (based on listings on major booking sites). By property type: business hotels 177 properties / 22,647 rooms, city hotels 25 properties / 3,354 rooms, ryokan 52 properties / 952 rooms. |
| Property-level remaining inventory | Listed inventory for a one-night stay on October 24, 2026, observed property by property (the occupancy used for observation varies by property: 2 guests at 51 properties, 1 guest at 26, and 3–5 guests at 11). Remaining-inventory ratio = rooms left listed on OTAs and similar channels ÷ total rooms. Covers 88 of the 302 properties in Fukuoka Prefecture whose inventory could be observed, namely those whose maximum allocation listed on OTAs and similar channels during the observation period was at least 30% of total rooms (7,187 rooms in total: 40 business hotels, 30 ryokan, 7 city hotels, 11 others). Sold out = a property whose listed inventory cannot be found on OTAs and similar channels (estimate). The latest observation is 14–15 days before the stay date; the 30-days-out figures are observations of the same 88 properties under the same conditions. |
| Price metrics | This article does not cover price metrics (estimated settled ADR). |
| Data as of | Data as of: October 10, 2026. Sales status and inventory change daily, so the figures in this article are a snapshot at the time of retrieval. |
Source: Compiled by MetroEngines Research and the HotelBank Editorial Team
References and Sources
■ Data sources
OTA and similar-channel listed-inventory data collected by MetroEngines Research (data as of October 10, 2026). The prefecture-wide booking curve uses a fixed cohort for each stay date (429 properties / 29,269 rooms in Fukuoka Prefecture for the night of 10/24); property-level remaining inventory covers 88 of the 302 properties in the prefecture whose 10/24 inventory could be observed, namely those whose maximum listed allocation was at least 30% of total rooms (7,187 rooms in total). Concert dates are based on information published by the organizers and the venue.
■ Calculation assumptions
Estimated OCC (based on OTA-listed inventory) = 100 − 100 × rooms left listed on OTAs ÷ total rooms. Remaining-inventory ratio = rooms left listed on OTAs and similar channels ÷ total rooms. Sold out = a state in which listed inventory cannot be found on OTAs and similar channels (estimate). The observation window runs from 45 days before the stay date to the latest reading (14–15 days out). Types: early sellout = currently sold out with first sellout 30 or more days out; late sellout = currently sold out with first sellout under 30 days out; nearly sold out = 10% or less left; followed by the 10–30%-left and over-30%-left bands.
■ Limitations and caveats
All figures are estimates based on inventory listed on OTAs and similar channels and are defined differently from actual room occupancy. Properties that have simply stopped listing may be counted as sold out. Movements after the latest observation (first sellouts and inventory released back to sale from 14 days before the stay date onward) are not included in this tally. City hotels number only 7, so separate figures are not shown for them. This article does not cover price levels, and figures are a snapshot at the time of retrieval.
■ External sources
・Stray Kids World Tour <RUN IT JAPAN> performance information (Saturday, October 24, Mizuho PayPay Dome Fukuoka) — Sony Music official site: https://www.sonymusic.co.jp/artist/StrayKids/info/585477
・Mizuho PayPay Dome Fukuoka event schedule (October 2026): https://zaseki.music-mdata.com/detail/13568/1