

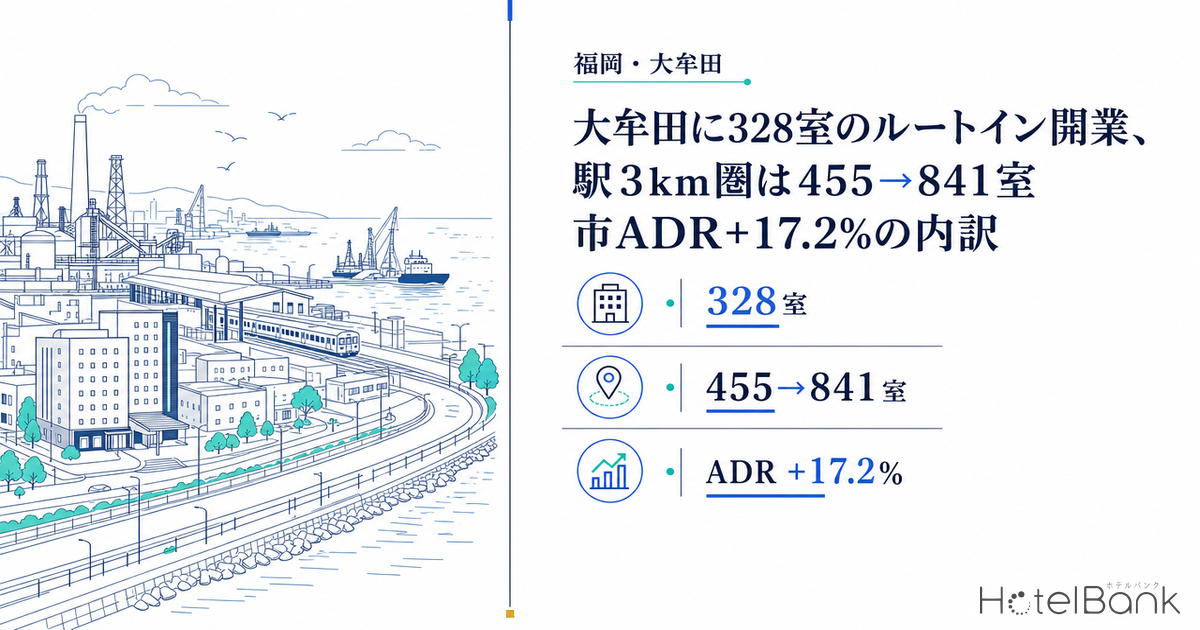
On December 26, 2025, the 328-room Hotel Route-Inn Omuta (ホテルルートイン大牟田) opened on the waterfront of Omuta City, Fukuoka. According to MetroEngines Research, the room stock within a 3 km radius of Omuta Station grew 1.8-fold in a single year, from 455 rooms at the end of 2024 to 841 rooms at the end of 2025, and this one building accounts for 85% of the increase. Over the nine months after the opening (December 2025 to August 2026), Omuta’s estimated settled ADR rose 17.2% YoY. Restricted to the same 11 properties that were already listed before the opening, however, the gain was only 7.8%; the remaining gap of roughly 9 points came from a change in mix as new properties joined the sample. This article breaks down what happened to rates and occupancy in a regional city where a single building added supply equal to about 70% of the existing stock, and sets out the conditions under which one large hotel can work in a city where land prices are flat.
Metric Definitions Used in This Article
*Metric definitions used in this article: ADR (average daily rate) = an estimated settled rate (tax-exclusive equivalent) calculated by applying a correction factor by hotel type to the lowest-plan price level each property publishes on OTAs (two guests per room, price per room, tax included). When checked against property-level results disclosed by listed hotel REITs (184 property-months, April–May 2026), the median error is about 7.5%. These are estimates and differ from each property’s actual settled prices and accounting figures. Area-level ADR is the median of the properties covered (the level of a typical property in the area). OCC (occupancy) = rooms sold as a share of total rooms in the area (an estimate based on inventory sold on OTAs; consistency checks against monthly REIT disclosures confirm accuracy to within roughly a few points). Where listed prices are mentioned, they are per-room prices for two guests per room (tax included). Data source: MetroEngines Research. Figures are as of the survey date, October 3, 2026.
- — 455→841 rooms: Rooms within 3 km of Omuta Station grew 1.8-fold in the year from end-2024 to end-2025. The 328-room Hotel Route-Inn Omuta alone accounts for 85% of the 386-room increase.
- — About 9.4 points of the +17.2% is a mix shift: The city’s estimated settled ADR rose 17.2% YoY over the nine months after the opening, but only 7.8% for the same 11 properties listed before the opening.
- — Same-property growth was concentrated in December–March: +20.3% in December–March versus −1.7% in April–August. Adjacent Arao City (+0.4%) and nearby Kurume City (+1.7%) were flat YoY over the nine months.
- — GOP yield 13.1%→9.3%: The simplified GOP yield on the announced investment (about ¥6.1 million per room) falls to 9.3% at today’s construction cost level (about ¥8.6 million per room), and to 8.0% including escalation during construction.
- — Hard to make work at the existing median rate: With ADR set at the median level of the same 11 properties (about ¥5,600), securing 9.3% would require full-year occupancy of close to 98%.
The Opening — One Building 2.4 Times the Size of the Area’s Largest 138-Room Hotel
Start with the scale of the opening. According to Route Inn Japan’s official website, Hotel Route-Inn Omuta is located at 6-67 Misaki-machi, Omuta City, Fukuoka, has 328 rooms in total, and opened on December 26, 2025. It sits about 2 minutes by car from the Omuta IC on the Ariake Sea Coastal Road and about 5 minutes by car from Omuta Station (Nishitetsu and JR), and it has a large communal bath and free parking. Travel Watch’s opening report (January 5, 2026) notes that the building has 10 stories above ground, that the gender-separated large baths come with open-air baths and saunas, and that a separate restaurant building serving seafood and yakiniku stands on the site.
The room count differs depending on when it was announced. The planning-stage figure reported by Fukuoka Keizai in February 2023 was 333 rooms, with total construction cost of about ¥2.0 billion (excluding land), a site area of 10,000 ㎡, and a target opening in autumn 2025. This article uses the 328 rooms currently shown on the official website and cites only the investment amount from the planning-stage report.
How large these 328 rooms are relative to the market becomes clear when compared with the surrounding stock. Lodging within a 3 km radius of Omuta Station (33.0303°N, 130.4459°E) was unchanged at 16 properties and 455 rooms from 2019 through 2024. By the end of 2025 it stood at 19 properties and 841 rooms, an increase of 386 rooms (+84.8%) in one year. Of that increase, 328 rooms, or 85%, came from this single building, which makes up 39.0% of the 3 km stock at the end of 2025. Even widening the radius to 5 km, stock rose 45.9%, from 23 properties and 841 rooms in 2024 to 26 properties and 1,227 rooms in 2025. Measuring new-opening rooms as a ratio of existing stock is covered in detail in our nationwide ranking of municipalities by new supply relative to existing stock.
The size mix also deserves attention. As far as MetroEngines Research can identify, the only property with 100 or more rooms within the 3 km radius had been a single 138-room city hotel; the rest were mainly station-front business hotels and ryokan with anywhere from a few rooms to just under 50. At 328 rooms, the new hotel is about 2.4 times the size of that largest property. With this opening, the city gained for the first time a venue for demand that needs to secure a large block of rooms at once, such as groups, construction crews, and sports teams on away trips.
Location — Station-Front Commercial Land Flat for Four Years, Waterfront Industrial Land +22%
Next, consider what kind of land this building stands on. The map below shows the locations of the 13 properties in Omuta City covered by the ADR analysis later in this article, together with a circle of 3 km radius from Omuta Station. Whereas most existing properties cluster within 1 km of the station, the new 328 rooms stand alone about 2 km west of the station, on the waterfront near the Ariake Sea.
Checking the Ministry of Land, Infrastructure, Transport and Tourism’s (MLIT) Published Land Prices (2026) in the Real Estate Information Library, there are two commercial-land points with published prices within 1 km of Omuta Station: Ariake-machi 2-chome at ¥60,400/㎡ and Shiranui-machi 2-chome at ¥51,000/㎡, both 0.0% YoY. In 2022 they were ¥60,500 and ¥51,200 respectively, so station-front commercial land has barely moved in four years. The zoning is commercial district (floor-area ratio 400%, building coverage ratio 80%).
By contrast, the industrial-land standard point in Kitaiso-machi, about 1.4 km from the hotel, rose 22.5% in four years, from ¥8,980/㎡ in 2022 to ¥11,000/㎡ in 2026, and its latest YoY change was +5.8%. The level itself is only about one-fifth of station-front commercial land, but the movement can be read as a sign that real demand is returning to waterfront industrial sites. Exclusively industrial zoning (floor-area ratio 200%, building coverage ratio 60%) spreads around the hotel, and the character of the land differs from that in front of the station.
| Point (use) | 2022 | 2026 | 2026 YoY | 4-year change |
|---|---|---|---|---|
| Ariake-machi 2-chome (commercial, about 90 m from the station) | ¥60,500/㎡ | ¥60,400/㎡ | 0.0% | −0.2% |
| Shiranui-machi 2-chome (commercial, about 580 m from the station) | ¥51,200/㎡ | ¥51,000/㎡ | 0.0% | −0.4% |
| Shinchi-machi (residential, about 720 m from the station) | ¥31,600/㎡ | ¥32,700/㎡ | +1.2% | +3.5% |
| Kitaiso-machi (industrial, about 1.4 km from the hotel) | ¥8,980/㎡ | ¥11,000/㎡ | +5.8% | +22.5% |
The employment structure of the surrounding area also offers clues about this hotel’s guest base. According to the Economic Census (2021 Activity Survey), 2,688 establishments and 23,071 workers are located within a 2 km radius of Omuta Station, and the share of office-type workers is 8.2%. Within a 2 km radius of the hotel there are 1,238 establishments and 11,300 workers, with an office-type share of 6.2%. This is a city where office workers make up less than 10% and people working on site in manufacturing, logistics, and retail predominate, so lodging demand is likely weighted toward medium- to long-term stays by people commuting to plants and work sites rather than desk-work business trips. For guests who travel by car, a location right by the IC with surface parking is more convenient than one in front of the station.
City ADR Before and After the Opening — 9-Month Average From About ¥5,200 to About ¥6,000
In a market where supply has grown by 70%, it would be natural to expect rates to fall. Yet Omuta City’s estimated settled ADR (the median of covered properties in the city) is higher after the opening. On a 12-month average basis, it was about ¥5,900 (¥5,887) for September 2025–August 2026 against about ¥5,200 (¥5,165) for September 2024–August 2025, up 14.0%. Limited to the nine months after the opening (December 2025–August 2026), the average was about ¥6,000 (¥6,049), up 17.2% from about ¥5,200 (¥5,162) in the same period a year earlier.
Two things can be read from the chart overlaying the years. One is that the 2026 line stays consistently above the previous two years from January through June. The other is that 2025 was a lower year than 2024. The January–August 2026 average is about ¥6,000, which is +11.5% compared with the same eight months two years earlier (about ¥5,400). The +17.2% YoY figure therefore also reflects the fact that the comparison base, the first half of 2025, was low.
Note that figures for September 2026 onward are estimates based on listed levels at the time of the survey and are on a different basis from finalized months, so this article does not use them in YoY calculations.
Breaking Down the +17.2% — Same-Property Growth of +7.8%, Mix Shift of About 9 Points
It would be premature, however, to read this +17.2% simply as the result of stronger demand. The city’s ADR is the median of covered properties, and the sample went from 11 properties before the opening to 13 as one new property was added in each of October and December 2025. The estimated settled ADRs of the two newly added properties, averaged over the nine months after the opening, were about ¥7,300 for Hotel Route-Inn Omuta and about ¥7,100 for the other, both above the previous median. Because the median is the middle value when properties are ranked by rate, adding two properties on the upper side shifts the middle position up to the next property.
We therefore recalculated the median using only the 11 properties that have been listed continuously since before the opening. The result was a nine-month post-opening average of about ¥5,600 (¥5,565), up 7.8% from about ¥5,200 (¥5,162) in the same period a year earlier. Of the citywide +17.2%, growth on a like-for-like basis accounts for +7.8%, and the mix shift caused by the addition of new properties accounts for about 9.4 points.
| Sample | Same period a year earlier (Dec 2024–Aug 2025) | 9 months after the opening (Dec 2025–Aug 2026) | YoY |
|---|---|---|---|
| Citywide (N=11→13 properties) | ¥5,162 | ¥6,049 | +17.2% |
| Same 11 properties (listed before the opening) | ¥5,162 | ¥5,565 | +7.8% |
| Difference (mix shift) | — | ¥484 | About 9.4 points |
Splitting by month also shows that same-property growth varied greatly by period. The median of the 11 properties rose by double digits from winter into spring: +22.8% YoY in December 2025, +27.0% in January 2026, +17.2% in February, and +14.8% in March. From April onward it returned to a range in line with the prior year, at +1.5%, −5.7%, +0.2%, +5.0%, and −8.4%; the four-month average for December–March is +20.3%, and the five-month average for April–August is −1.7%.
What stands out is that this winter rise began the month before the opening. The median of the 11 properties was already +10.6% YoY in November 2025. Rather than the 328-room opening pushing up existing properties’ rates, it is more consistent to read this as lodging demand in the city itself strengthening in winter, with new rooms arriving on top of it. By property, 8 of the 11 exceeded the same period a year earlier on a nine-month post-opening average, and the median of the property-level YoY changes was +11.3%.
From April onward, on the other hand, the citywide line and the same-property line diverge. In May the citywide figure was +14.4% and the same-property figure −5.7%, a gap that widened to about 20 points. The rise in city ADR since spring can be explained not by price increases at existing properties but by the effect of relatively higher-priced new properties lifting the “middle” of the market. Even with supply up 70%, existing properties’ rates have held in line with the prior year while the new properties sell in a price band above them; the new supply appears to have captured demand in a different price band rather than competing for existing guests.
Comparison With Neighboring Cities — Same-Property +7.8% Exceeds Four Surrounding Cities
To see where Omuta’s growth sits relative to its surroundings, we lined up the YoY change over the same nine months using the same estimated settled ADR (median of covered properties in each city). Adjacent Arao City in Kumamoto Prefecture was +0.4%, nearby Kurume City +1.7%, Yanagawa City −0.6%, and Chikugo City +0.2%, all roughly flat YoY, and the +7.8% for Omuta’s same 11 properties exceeds them. On the other hand, some areas grew as much as or more than Omuta: Fukuoka Prefecture as a whole was +9.3%, Tosu City +19.1%, and Iizuka City +9.8%. Note that the neighboring-city values are citywide medians and are not aligned to the same properties as for Omuta, so they may include the effect of changes in the property sample.
Seasonal skew is also worth comparing. For Fukuoka Prefecture as a whole, growth was also skewed toward winter, at +14.4% for December–March and +5.3% for April–August, so Omuta’s winter rise (+20.3% for the same properties) partly overlaps with winter strength across the prefecture. However, no winter rise is seen in adjacent Arao City (−0.7% for December–March) or Kurume City (+1.7%), so demand specific to the city may have been layered on top in Omuta’s winter growth. The data in this article cannot identify the cause.
| Area (properties covered) | 9-month average, year earlier | 9-month average, post-opening | YoY | Of which Dec–Mar | Of which Apr–Aug |
|---|---|---|---|---|---|
| Omuta City, citywide (N=11→13) | ¥5,162 | ¥6,049 | +17.2% | +25.1% | +11.2% |
| Omuta City, same 11 properties | ¥5,162 | ¥5,565 | +7.8% | +20.3% | −1.7% |
| Arao City (N=5) | ¥6,801 | ¥6,827 | +0.4% | −0.7% | +1.2% |
| Kurume City (N=21–22) | ¥6,791 | ¥6,905 | +1.7% | +1.7% | +1.6% |
| Yanagawa City (N=9–10) | ¥7,953 | ¥7,908 | −0.6% | +5.6% | −5.3% |
| Chikugo City (N=5–6) | ¥6,234 | ¥6,245 | +0.2% | −3.7% | +3.4% |
| Tosu City (N=7–8) | ¥5,660 | ¥6,739 | +19.1% | +18.6% | +19.4% |
| Iizuka City (N=8) | ¥5,432 | ¥5,964 | +9.8% | +9.3% | +10.2% |
| Fukuoka Prefecture overall (N=459–476) | ¥10,779 | ¥11,782 | +9.3% | +14.4% | +5.3% |
Estimated OCC — Prefecture’s Business Hotels Around 90%, Omuta City at 77% With a Weekend Peak
After rates comes occupancy. Occupancy (estimated, OTA-listed inventory basis) for business hotels in Fukuoka Prefecture (173–178 properties / 22,306–22,893 rooms covered, based on listings on major booking sites) was stable at around 90%: 89.2% in June 2026, 89.7% in July, 90.6% in August, and 90.0% in September. The prefecture-wide figure is heavily weighted toward Fukuoka City and Kitakyushu City, and can be regarded as the standard level for business hotels in the prefecture.
For Omuta City (all categories, 9–10 properties / 620–634 rooms covered, based on listings on major booking sites), the days that could be observed are limited, but occupancy was 72.8% in June (15 days), 76.3% in July (19 days), 81.3% in August (10 days), and 77.6% in September (19 days). The average over the 63 observed days in June–September was 76.6%, about 13 points below the Fukuoka Prefecture business hotel average for the same 63 days (89.7%). These should be viewed as figures from less than a year after the opening, immediately after the city’s listed rooms increased sharply.
| Month (2026) | Fukuoka Pref. business hotels: properties / rooms | Estimated OCC | Omuta City: properties / rooms | Estimated OCC (days observed) |
|---|---|---|---|---|
| June | 177 / 22,575 | 89.2% | 9 / 620 | 72.8% (15 days) |
| July | 178 / 22,775 | 89.7% | 10 / 634 | 76.3% (19 days) |
| August | 173 / 22,306 | 90.6% | 9 / 623 | 81.3% (10 days) |
| September | 175 / 22,893 | 90.0% | 10 / 634 | 77.6% (19 days) |
Lining the figures up by day of the week reveals Omuta City’s pattern. Tuesday through Thursday are stable at 77.8–79.5%, Saturday is the weekly peak at 82.0%, and Sunday is the trough at 65.9%. Fukuoka Prefecture’s business hotels show the same shape, at 93.6% on Saturday and 83.9% on Sunday, but the Saturday–Sunday gap is larger in Omuta City at 16.1 points versus 9.7 points for the prefecture. This is the weekly wave typical of a large suburban business hotel: weekday work-site business trips form the base, sports away trips and leisure add to it on Saturday, and guests leave all at once on Sunday. Days of 100.0% on Saturday, July 25 and 94.5% on Tuesday, September 15 were also observed, so on some days the city’s listed inventory is almost fully taken.
When reading the August figures, the impact of the Kumamoto earthquake that struck on July 28 should also be kept in mind. Omuta City borders Kumamoto Prefecture, and the days at around 90% in late August may include recovery-related stays.
Investment per Room and Simplified Yield — ¥6.1 Million Announced, About ¥8.6 Million at Today’s Construction Costs
From here we look at the same building from the investment side. Dividing the total construction cost of about ¥2.0 billion (excluding land) reported by Fukuoka Keizai by 328 rooms gives about ¥6.1 million per room (about ¥6.0 million if divided by the 333 rooms at the planning stage). However, this is the planning-stage amount reported at the end of 2022, and the final construction cost has not been disclosed. As a guide for building the same structure from now, we factor in the rise in construction costs in two steps.
The first step restates the amount at today’s construction cost level. According to MLIT’s Building Starts Statistics, the planned construction cost of buildings for the accommodation industry, averaged across all structure types, rose 41% in two years, from ¥1.38 million per tsubo (about 3.3 ㎡) in 2022 to ¥1.95 million per tsubo in 2024, and remained elevated at ¥1.952 million per tsubo in 2025. Applying this ratio, ¥2.0 billion is equivalent to about ¥2.83 billion, or about ¥8.6 million per room. The second step factors in escalation during the construction period: using Turner & Townsend’s construction cost forecast for Japan (+5.3% in 2026, +5.0% in 2027), adding +4.5% for 2028 onward as this article’s own placeholder since it falls outside that forecast’s range, and setting the midpoint of construction at 2028, the figure becomes about ¥3.27 billion, or about ¥10 million per room.
The revenue side is set simply using room revenue only. ADR is the new property’s estimated settled ADR over the nine months after the opening (about ¥7,300); occupancy is 75%, with reference to the city’s estimated OCC (63-day average of 76.6%); and the GOP margin is 40%. The GOP margin is an assumption set on the conservative side, between the 38.9% actual (fiscal period ended December 2024) for the 91 domestic hotels disclosed by Invincible Investment Corporation (インヴィンシブル投資法人) and the 50–60% regarded as a benchmark for limited-service hotels. Under these conditions, room revenue is about ¥655 million per year and GOP about ¥262 million.
| Item | Announced basis (2022 plan) | Today’s construction cost level | Incl. escalation during construction |
|---|---|---|---|
| Building investment (excl. land) | About ¥2.00 billion | About ¥2.83 billion | About ¥3.27 billion |
| Per room | About ¥6.1 million | About ¥8.6 million | About ¥10 million |
| Room revenue (ADR ¥7,300 × 75% occupancy × 328 rooms) | About ¥655 million | About ¥655 million | About ¥655 million |
| GOP (GOP margin 40%) | About ¥262 million | About ¥262 million | About ¥262 million |
| GOP ÷ building investment | 13.1% | 9.3% | 8.0% |
| ADR −10% (¥6,570) | 11.8% | 8.3% | 7.2% |
| Occupancy −5 points (70%) | 12.2% | 8.6% | 7.5% |
| ADR −10% and occupancy −5 points | 11.0% | 7.8% | 6.7% |
Sensitivity Analysis — Moving ADR and Occupancy Together (Today’s Construction Cost Level)
The table above shows sensitivity moving one variable at a time, but it is also worth checking the range when ADR and occupancy swing together. Using today’s construction cost level (building investment of about ¥2.83 billion) as the denominator, we arranged GOP ÷ building investment along the two axes of ADR and occupancy. The mid case (ADR ¥7,300, occupancy 75%) is 9.3%, the downside case (ADR ¥6,570, occupancy 70%) is 7.8%, and the upside case (ADR ¥8,030, occupancy 80%) is 10.9%.
The row to focus on is the top one. If the new property could sell only at the median level of the existing 11 properties (about ¥5,600), the yield would be just 8.1% even at 85% occupancy, and achieving the same 9.3% as the mid case would require occupancy of nearly 98% year-round. Condition 4 below, “Can it enter above the existing price band?”, is in effect the premise of the business case itself.
| ADR \ Full-year occupancy (assumed) | 65% | 70% | 75% | 80% | 85% |
|---|---|---|---|---|---|
| ¥5,600 (median level of the same 11 properties) | 6.2% | 6.6% | 7.1% | 7.6% | 8.1% |
| ¥6,570 (−10%) | 7.2% | 7.8% | 8.3% | 8.9% | 9.4% |
| ¥7,300 (new property’s estimated settled ADR) | 8.0% | 8.6% | 9.3% | 9.9% | 10.5% |
| ¥8,030 (+10%) | 8.8% | 9.5% | 10.2% | 10.9% | 11.5% |
Including land does not change the picture much. Mechanically applying nearby Published Land Prices (¥11,000/㎡ for industrial land to ¥32,700/㎡ for residential land) to the 10,000 ㎡ site gives ¥110–330 million, and the GOP yield with land added to today’s construction cost level is 8.3–8.9%. Land staying at around 10% of the building is the starting point when planning one large hotel in a city with low land prices. Note that this ratio is at the GOP stage, before deducting property tax, insurance, FF&E replacement, and management fees.
For operators building at the same scale from now, the rise in construction costs is a factor pushing yields down from the 13% range to the 8–9% range; for a property that has already opened, it means that follow-on large supply becomes less likely. The 328 rooms built at 2022 prices could hold a price advantage in the same market for a long time.
Conditions for One Large Hotel to Work in a City With Flat Land Prices
Pulling this together, the Omuta case can be read not as an example from “a city where demand is expanding rapidly” but as one where a single large hotel was accepted in “a city with a gap in the composition of its existing stock.” We summarize four items to check when considering a large suburban business hotel in a regional city.
1. Is there a gap in scale?
Within the 3 km radius, only one 138-room property had 100 or more rooms. The more a market is dominated by small properties, the less a large hotel that can take block bookings from groups, away trips, and construction crews competes with existing properties.
2. Is weekday work-site demand deep?
There are 23,071 workers within 2 km of the station, of whom 8.2% are office-type. For guests travelling by car to manufacturing and logistics sites, proximity to the IC and surface parking matter more than a station-front location.
3. Does land stay at around 10% of the building?
Even station-front commercial land is ¥51,000–60,000/㎡, and waterfront industrial land is ¥11,000/㎡. Even with a 10,000 ㎡-class site, land comes to only around 10% of the building investment.
4. Can it enter above the existing price band?
The new property’s estimated settled ADR is about ¥7,300, 30% higher than the median of the same 11 properties (about ¥5,600). The key is whether the added value of a large bath, breakfast, and parking can create a price band one step higher.
Of the four conditions, the second and fourth are probably the hardest to verify before opening. In Omuta, the ADR of the 11 existing properties held in line with the prior year after the opening (−1.7% on the April–August average) while the new property sells in the price band above them, so the market has settled into two tiers. Existing rates not collapsing is the practical indicator of whether new supply has been absorbed; at the planning stage, it is worth comparing same-property ADR before and after in nearby cities that have had an opening of similar scale.
Some caveats are also worth noting. Estimated OCC on Sundays is 65.9%, more than 10 points below weekdays, so the P&L needs to be built on the premise that one-third of rooms are empty one day a week. Also, because the site is on the waterfront close to the sea, storm surge, flood, and liquefaction assumptions are items to be checked individually using the municipality’s hazard maps and a ground survey. Municipal location incentives for lodging facilities vary by city in availability and requirements, so it is effective to confirm them in the primary documents of the municipality where the site is planned before factoring them into the business case.
| Item to check | Figures observed in Omuta | How to read it at the planning stage |
|---|---|---|
| Supply impact | 3 km radius: 455→841 rooms (+84.8%) | Supply exceeding 50% of existing stock presupposes that price bands do not overlap |
| Same-property ADR | +7.8% over 9 months post-opening; −1.7% in April–August | If it holds in line with the prior year, absorption can be judged to be progressing |
| Weekly occupancy | Saturday 82.0%, Sunday 65.9% (estimated) | There is room to fill the Sunday trough with multi-night and long-stay plans |
| Construction cost | ¥6.1 million/room (2022 plan) → about ¥8.6 million/room at today’s level | Depending on the per-tsubo unit cost at the time of construction start, the yield moves from the 13% range to the 8–9% range |
| Land prices | Station-front commercial land 0.0% YoY; waterfront industrial land +5.8% | Movements in industrial land are worth watching as a leading indicator of weekday demand |
Conclusion — Look at Like-for-Like Before-and-After Comparisons, Not the City Average
Rooms within 3 km of Omuta Station grew 1.8-fold in one year, from 455 to 841, with the 328-room opening. Even so, the city’s estimated settled ADR rose 17.2% YoY over the nine months after the opening, and 7.8% even when limited to the same 11 properties. However, same-property growth was concentrated in December–March, and since April rates have been in line with the prior year. The rise in city ADR since spring can be explained by a mix shift in which new properties, in a price band 30% above existing ones, lifted the median.
When measuring the impact of new supply, looking only at a municipality’s average or median makes it easy to mistake an apparent rise caused by changes in the property sample for growth in demand. A two-step reading, comparing the same properties before and after and then separately checking which price band the new property entered, is useful in judging supply absorption in regional cities. With construction costs now up 40% from 2022, follow-on projects of the same scale are unlikely, and the advantage of the large hotel built first is expected to last for the time being.
Data notes: The ADR figures in this article are estimates covering months through August 2026 that were finalized as of the survey date, October 3, 2026, and may change with future re-aggregation. Months from September 2026 onward are estimates based on listed levels at the time of the survey and are on a different basis, so they are not used for YoY comparisons. Estimated OCC is the average of observed days only.
Frequently Asked Questions
Q. How many rooms does Hotel Route-Inn Omuta have, and when did it open?
According to the official website, it has 328 rooms in total and opened on December 26, 2025. It is located at 6-67 Misaki-machi, Omuta City, Fukuoka, about 2 minutes by car from the Omuta IC on the Ariake Sea Coastal Road. Planning-stage reports put the room count at 333.
Q. How much did Omuta’s hotel room supply increase with the opening?
Rooms within a 3 km radius of Omuta Station increased by 386 (+84.8%), from 16 properties and 455 rooms at the end of 2024 to 19 properties and 841 rooms at the end of 2025. This one building’s 328 rooms account for 85% of the increase.
Q. Did hotel rates in Omuta City fall after the opening?
No. The city’s estimated settled ADR rose 17.2% YoY over the nine months after the opening. Limited to the same 11 properties listed before the opening, it rose 7.8%; the gap of about 9 points is due to higher-priced new properties being added to the sample.
Related Articles
| 582 Hotels Opening 2026: 30-Room Luxury vs 200+ Scale Polarization |
| Hotel Supply Pressure Ranking 2026-2027: Ozu Kumamoto Tops at 30.8% |
References and Sources
■ Data Sources
Estimated settled ADR, room stock, and estimated occupancy are aggregated by MetroEngines Research & Consulting (Omuta City N=11–13 properties; neighboring cities use each city’s covered properties; Fukuoka Prefecture business hotels 173–178 properties). Land prices are from MLIT’s Published Land Prices (Real Estate Information Library), construction costs from the Building Starts Statistics, employment structure from the Economic Census for Business Activity (2021), and the property overview from Route Inn Japan’s official website and press reports. Figures are as of the survey date, October 3, 2026.
■ Estimate Assumptions
Building investment starts from the reported figure of about ¥2.0 billion (excluding land), restated to about ¥2.83 billion using the per-tsubo unit cost ratio for accommodation-industry buildings in the Building Starts Statistics (¥1.38 million in 2022 → ¥1.95 million in 2024), and to about ¥3.27 billion using Turner & Townsend’s forecast (+5.3% in 2026, +5.0% in 2027) and this article’s placeholder for 2028 onward (+4.5%). Revenue is room revenue only (ADR ¥7,300 × full-year occupancy 75% × 328 rooms × 365 days), with a GOP margin of 40%. The two-axis sensitivity uses today’s construction cost level as the denominator. Land applies nearby Published Land Prices (¥11,000–32,700/㎡) to the 10,000 ㎡ site.
■ Limitations and Caveats
ADR is an estimate, and area-level values are the median of covered properties and therefore move with changes in the property sample (the reason this article decomposed the change on a same-property basis). Neighboring-city values are citywide medians and are not aligned to the same properties. Estimated occupancy is the average of observed days only (63 days in June–September 2026 for Omuta City). Yields are simplified GOP-stage values before deducting property tax, insurance, FF&E replacement, and management fees. Months from September 2026 onward are on a different basis and are not used for YoY comparisons.
■ Market Data
- MetroEngines Research & Consulting — Estimated settled ADR (Omuta City N=11–13 properties), estimated occupancy (Fukuoka Pref. business hotels 173–178 properties / Omuta City 9–10 properties), room stock trend (3 km and 5 km radius of Omuta Station)
■ Government Statistics and Public Data
- MLIT Real Estate Information Library — Published Land Prices (2022 and 2026) and zoning
- MLIT, “Building Starts Statistics Survey” (e-Stat table ID: 0003114490)
- Ministry of Internal Affairs and Communications / Ministry of Economy, Trade and Industry, “2021 Economic Census for Business Activity”
- Japan Tourism Agency, “Overnight Travel Statistics Survey”
■ REITs and Industry Reports
- Invincible Investment Corporation (8963), financial results presentation (fiscal period ended December 2024) — GOP results for 91 domestic hotels
- Turner & Townsend, “Trends shaping Japan’s construction market in 2026” (March 12, 2026) — Construction cost forecast for Japan (+5.3% in 2026, +5.0% in 2027)
■ Official Websites and News