

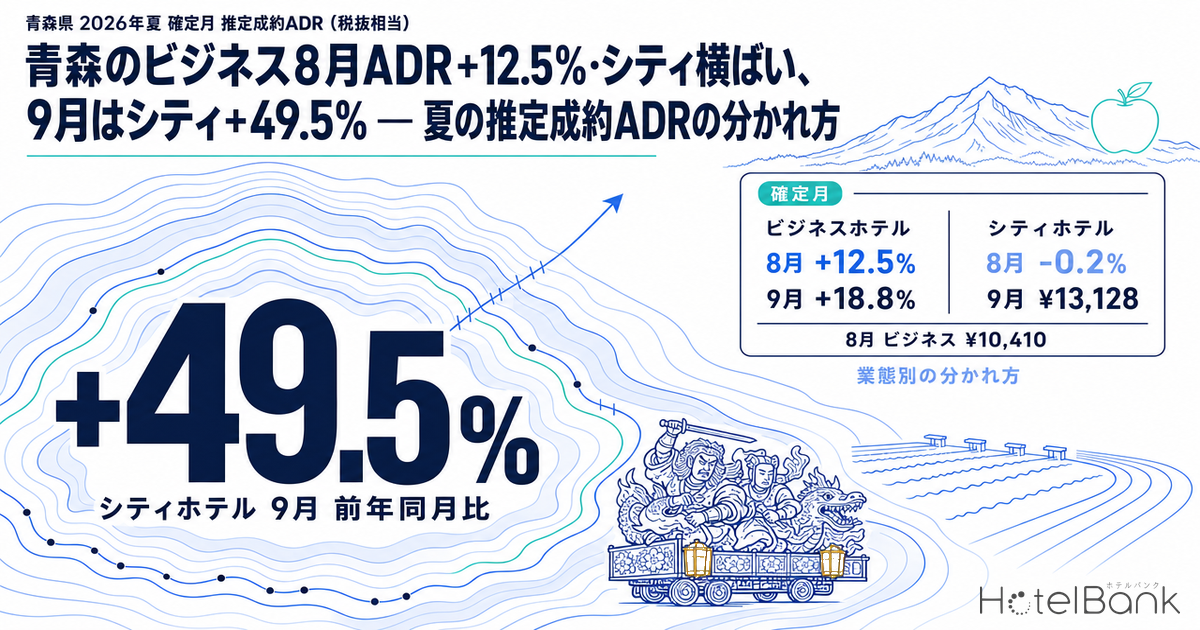
Comparing finalized monthly estimated settled ADR (tax-exclusive equivalent) against the same month a year earlier shows that summer 2026 rates in Aomori Prefecture’s hotel market split clearly by hotel type. Business hotels posted ¥10,410 (N=87) in August, up 12.5% from ¥9,250 (N=82) a year earlier, securing a double-digit gain, while city hotels came in at ¥13,054 (N=16), essentially flat (-0.2%) against ¥13,083 the prior year. In September the picture reversed: city hotels, with the pre-session events of the National Sports Games (国スポ, Kokuspo) under way, reached ¥13,128 (+49.5%), and business hotels ¥8,818 (+18.8%), both large gains for a finalized month. This article overlays the finalized months of 2024–2026 year on year to examine where the gap arose between the hotel types that captured rate during the summer peak and those that did not, and how to design price ceilings for the main session of the Games in October.
Scope: business hotels (N=87 properties) and city hotels (N=16 properties) in Aomori Prefecture (as of August 2026; counts vary by month). The price metric in this article is estimated settled ADR (the level of transacted rates estimated from OTA and other sales data; tax-exclusive equivalent), and occupancy is an estimate based on OTA-listed inventory. Both are defined at the end of the article. Data as of October 10, 2026.
- — Estimated settled ADR for Aomori Prefecture business hotels in August 2026 was ¥10,410 (N=87), up 12.5% YoY. Following ¥8,397 in 2024 and ¥9,250 in 2025, this marks a second consecutive year of double-digit growth.
- — City hotels in August came in at ¥13,054 (N=16), -0.2%, holding the prior year’s high. September, the month of the National Sports Games pre-session events, was finalized at ¥13,128, up 49.5%, the largest gain in any series.
- — Estimated OCC for business hotels (OTA-listed inventory basis) averaged 94.9% in August and 96.9% in September. Post-Games Saturdays in November stood at only 58.9–77.4% at 45 days out, a phase in which pricing should be rebuilt around the prior year’s finalized values.
Business Hotels — Summer Rates Built Up Two Years Running: +12.5% in August, +18.8% in September
We start with the year-on-year overlay for business hotels. Laying the finalized months of 2026 (January–September) over the same months of 2025 and 2024, August is the highest finalized month in all three years, and its level has risen by double digits two years in a row: ¥8,397 (2024) → ¥9,250 (2025, +10.2%) → ¥10,410 (2026, +12.5%). August, which includes the Aomori Nebuta Festival (August 2–7), is the month when demand in the prefecture is most concentrated, and adding a little over ¥1,000 year on year in that month indicates that many properties set their peak-day price ceilings above the prior year’s actuals. The fact that bookings for the six festival days were essentially settled 45 days before the stay date is analyzed in detail in Aomori Nebuta 2026: 97.4% Sold 45 Days Out, Post-Festival +14pt.
The summer gain, however, did not extend to July. July 2026 came in at ¥7,159, up only 0.6% from ¥7,116 a year earlier, in contrast to the size of the August increase. Even within the summer demand season, July kept a price profile close to the regular season, and only the August peak month jumped. September, on the other hand, rose 18.8% to ¥8,818 from ¥7,422 a year earlier, which can be read as the effect of lodging demand from athletes and officials entering the prefecture for swimming, rowing and other events in Games pre-session I (September 3–13) showing up in the finalized figures for business hotels as well. How ryokan had moved ahead at +19.1% as of July, opening a gap with business hotels at +0.6%, is laid out in Aomori Settled ADR July 2026: Ryokan +19.1%, Business Hotels +0.6%.
Source: Compiled by the HotelBank Editorial Team from MetroEngines Research
Estimated settled ADR (tax-exclusive equivalent) for business hotels in Aomori Prefecture. Solid lines are finalized months; the dotted line (October–December 2026) is an estimate based on current sales conditions and may change until month-end finalization. Finalized months: N=81–90 properties; estimated months (dotted): N=79–85 properties.
To summarize so far, the simple average of finalized months from January to September for business hotels rose 6.4%, from ¥6,954 a year earlier to ¥7,402, with August and September accounting for most of the lift. For October, an estimate based on current sales conditions shows a high level of ¥14,605 (N=85), but this is a mid-sales snapshot of the Games main session (October 10–20), and a straightforward comparison with finalized values must wait for month-end finalization.
City Hotels — August Held the Prior Year’s High, September Jumped 49.5%
Next, city hotels. August was ¥13,054 (N=16), flat at -0.2% against ¥13,083 a year earlier. This ‘flat’ result, however, is better seen as holding the prior year’s step-up than as stalled growth: August rose 16.4% from ¥11,236 in 2024 to 2025, meaning city hotels raised their August price level one year earlier than business hotels. In other words, 2026 was the year business hotels caught up in August, while city hotels absorbed the same demand as the previous year in a price band close to their ceiling.
July, meanwhile, rose 5.9% to ¥9,192 from ¥8,676 a year earlier, a clearer move than business hotels’ July (+0.6%). And September was finalized at ¥13,128, up 49.5% from ¥8,781 a year earlier, the largest gain in any series in this article. September’s ¥13,128 is on par with August’s ¥13,054, making this a year in which the annual peak appeared not only in August but also in September. In addition to the competition schedule of Games pre-session I, the characteristics of city hotels, which are well placed to take banquet and meeting business from Games officials, likely showed up as a difference in the finalized figures.
Source: Compiled by the HotelBank Editorial Team from MetroEngines Research
Estimated settled ADR (tax-exclusive equivalent) for city hotels in Aomori Prefecture. Solid lines are finalized months; the dotted line (October–December 2026) is an estimate based on current sales conditions and may change until month-end finalization. N=16 properties in each month.
On a simple average of finalized months from January to September, city hotels rose 3.2%, from ¥8,833 a year earlier to ¥9,116, with the September gain recovering the declines in April (-17.9%) and June (-11.5%). Estimates based on current sales conditions show ¥19,494 (N=16) for October and ¥11,522 for November, but both are mid-sales snapshots, and a straightforward comparison with finalized values must wait for month-end finalization.
Monthly YoY Table — The Months When Rates Moved Differ by Hotel Type
| Business 2025 | Business 2026 | YoY | City 2025 | City 2026 | YoY | |
|---|---|---|---|---|---|---|
| Jan | ¥5,767 | ¥6,608 | +14.6% | ¥7,226 | ¥6,992 | -3.2% |
| Feb | ¥5,925 | ¥6,134 | +3.5% | ¥7,006 | ¥7,464 | +6.5% |
| Mar | ¥5,969 | ¥5,807 | -2.7% | ¥7,070 | ¥7,126 | +0.8% |
| Apr | ¥7,138 | ¥7,574 | +6.1% | ¥10,430 | ¥8,563 | -17.9% |
| May | ¥7,150 | ¥7,405 | +3.6% | ¥8,530 | ¥8,838 | +3.6% |
| Jun | ¥6,853 | ¥6,704 | -2.2% | ¥8,694 | ¥7,691 | -11.5% |
| Jul | ¥7,116 | ¥7,159 | +0.6% | ¥8,676 | ¥9,192 | +5.9% |
| Aug | ¥9,250 | ¥10,410 | +12.5% | ¥13,083 | ¥13,054 | -0.2% |
| Sep | ¥7,422 | ¥8,818 | +18.8% | ¥8,781 | ¥13,128 | +49.5% |
Source: Compiled by the HotelBank Editorial Team from MetroEngines Research
Estimated settled ADR (tax-exclusive equivalent); year-on-year comparison between finalized months. Business N=81–90 properties, City N=16 properties.
Reading the table by hotel type, business hotels were led by three months, January (+14.6%), August and September, and apart from small declines in March and June generally tracked at or above the prior year. City hotels, by contrast, had double-digit declines in April and June that were offset by gains in July and September, making for a year of wide swings. On whether rates could be moved during the summer peak, business hotels come out ahead if we look at August alone, but across the whole summer including July and September, city hotels moved more. The reading closest to reality is that ‘which month’s ceiling was raised’ differed by hotel type.
Estimated OCC in August–September — The Market Was Near Full, and Rate Was the Only Lever Left
To support the rate discussion, we check daily estimated OCC (OTA-listed inventory basis) for the same period. Aomori Prefecture business hotels averaged 94.9% in August 2026 and 96.9% in September (scope: 26–40 properties / 2,535–4,835 rooms per day, based on listings on major booking sites). The Nebuta Festival dates of August 2–7 ranged from 91.4% to 99.0%, and Games pre-session I on September 3–13 from 90.4% to 99.7%, with listed inventory almost fully absorbed in both periods. Troughs appear on Saturday, August 15 (86.1%), Sunday, August 16 (77.7%) and Sunday, August 30 (77.8%), and in September on Wednesday the 23rd, a public holiday (81.4%), and Sunday the 27th (86.2%). By day of week, Sunday had the lowest average in August at 87.5%.
Source: Compiled by the HotelBank Editorial Team from MetroEngines Research
Daily estimated OCC for business hotels in Aomori Prefecture (OTA-listed inventory basis; August 1–September 30, 2026). Scope: 26–40 properties / 2,535–4,835 rooms per day. Based on observations from 45 days before the stay date to the most recent date.
City hotels also averaged 95.4% in August (21 observed days) and 93.2% in September (24 observed days) (scope: 10 properties / 1,120 rooms), again leaving little slack in inventory. Both hotel types were in a ‘sell-out’ phase during the summer peak, and against that backdrop, the difference between business hotels moving rate by 12.5% in August and city hotels holding the prior-year level is more naturally explained by differences in the price ceilings each property set than by differences in demand strength.
Booking Pace for October–November — The Games Main Session and the Drop Afterward
So how does this summer’s experience connect to October and beyond? The table below lines up estimated OCC at 45 days out, 30 days out and the latest observation for selected stay dates at business hotels (scope: 38 properties / 4,804 rooms, based on listings on major booking sites).
| Phase | 45 days out | 30 days out | Latest (at observation) | |
|---|---|---|---|---|
| 10/17 (Sat) | Games main session | 99.5% | 99.3% | 97.2% (8 days out) |
| 10/21 (Wed) | Day after Games close | 83.7% | 88.3% | 94.3% (12 days out) |
| 10/24 (Sat) | Disabled Sports Games | 97.5% | 99.3% | 98.6% (15 days out) |
| 10/25 (Sun) | Disabled Sports Games | 89.3% | 93.3% | 93.7% (16 days out) |
| 10/31 (Sat) | Post-Games | 83.9% | 89.9% | 94.7% (22 days out) |
| 11/07 (Sat) | Post-Games | 73.0% | 85.0% | 85.9% (29 days out) |
| 11/14 (Sat) | Post-Games | 77.4% | — | 83.5% (36 days out) |
| 11/21 (Sat) | Post-Games | 58.9% | — | 60.1% (43 days out) |
Source: Compiled by the HotelBank Editorial Team from MetroEngines Research
Estimated OCC for business hotels in Aomori Prefecture (OTA-listed inventory basis). Based on observations from 45 days before the stay date to the most recent date. ‘—’ indicates dates with no 30-days-out observation yet.
Saturday, October 17, during the Games main session, started at 99.5% at 45 days out, with almost no listed inventory. Saturday, October 24, during the National Sports Games for Persons with Disabilities (Disabled Sports Games), was also high at 97.5% at 45 days out and 99.3% at 30 days out, suggesting that Games-related lodging was secured early. By contrast, the post-Games Saturdays started at 73.0% (November 7), 77.4% (November 14) and 58.9% (November 21) at 45 days out, a clearly different build from the Games period even for the same day of the week. Since October’s high estimated ADR is supported by the special demand of the Games, November is not a matter of ‘returning to pre-Games levels’ but a phase of redesigning prices around the prior year’s finalized values (business ¥6,833, city ¥9,206).
For Revenue Managers of Business and City Hotels in Aomori Prefecture — Implications and Action Plan
Insights from an Operator’s Perspective
1. The market’s August rate rose one year apart by hotel type. City hotels gained 16.4% in August 2025 and business hotels 12.5% in August 2026, so the peak-month step-up arrived a year later for the latter. If your property’s finalized August ADR was below the market’s ¥10,410 (business) or ¥13,054 (city), there is room to start next summer’s Nebuta period by resetting the ceiling.
2. On days when estimated OCC is pinned in the high 90s, growth can come only from rate, not occupancy. The Nebuta Festival and Games pre-session I dates ran with the whole market almost fully absorbed. If your booking pace on such days is faster than the market, suspect that the price ceiling is too low; if it is slower, reviewing sales conditions (multi-night stays, minimum length of stay) comes before the ceiling.
3. Do not treat ‘summer’ as a single block. July was +0.6% for business and +5.9% for city, August +12.5% and -0.2%, and September +18.8% and +49.5%: the hotel type that moved changed from month to month. The price revision calendar should carry separate ceilings and separate decision triggers for July, August and September.
4. For post-Games November, return to the prior year’s finalized values as the baseline. November Saturdays show estimated OCC of 73.0% to 58.9% at 45 days out, a different build from the Games-period Saturday (99.5%), and prices that carry over October’s estimated ADR are likely to result in lost opportunity.
| Action | Decision trigger (figures from this article) | Aim | |
|---|---|---|---|
| Today–this week | Check remaining inventory day by day for the Games main session and Disabled Sports Games period (October 10–20 and 23–26), and hold the ceiling only on days with rooms left | If your property has rooms left while the market has reached 99.5% at 45 days out for Saturday, October 17 and 99.3% at 30 days out for Saturday, October 24 | Avoid missed revenue in the final phase of Games demand |
| Today–this week | For Saturdays from October 31 onward, check selling prices to see whether Games-period rates are being carried over | Given that market estimated OCC for Saturday, November 7 started at 73.0% at 45 days out, 26.5 points below the Games-period Saturday (99.5%), if your property’s same date is pacing behind the market | Adapt early to post-Games demand levels |
| Within 2 weeks | Rebuild November price bands around the prior year’s finalized values (business ¥6,833, city ¥9,206) | If your November settings remain close to the market’s October estimates of ¥14,605 (business) and ¥19,494 (city) | Align November occupancy recovery with rate |
| Within 2 weeks | Compare your property’s finalized ADR for August and September against market values and take stock of how often the ceiling was reached on each peak day | If your property was below the market’s ¥10,410 (business) / ¥13,054 (city) in August or ¥8,818 / ¥13,128 in September | Identify the rate left uncaptured |
| Looking to next month | Design the initial ceiling for next summer’s Nebuta period (August 2–7) starting from this year’s market August value | Given that the market’s August grew by double digits two years running (business +10.2% → +12.5%), if your ceiling is unchanged from the prior year | Update the peak-day price ceiling |
| Looking to next month | Separate July and September from August in the revision calendar and give each month its own decision trigger | On the premise that the market moved differently by month: July +0.6% (business) and +5.9% (city), September +18.8% and +49.5% | Capture rate fully across the whole summer |
Summary — Three Yardsticks for Measuring Summer Rates
Summer 2026 in Aomori Prefecture was a year in which business hotels moved rate by 12.5% in August while city hotels held the level they had raised the year before. Then in September, against the backdrop of the National Sports Games pre-session events, city hotels rose 49.5% and business hotels 18.8%, large gains for both hotel types in a finalized month. The yardsticks for applying these results to next summer come down to the following three points.
| Aomori Prefecture’s value this year | How to use it | |
|---|---|---|
| Finalized YoY for the peak month | August: business +12.5% / city -0.2% | Check whether your property’s finalized August value is keeping up with market growth |
| Finalized YoY for the months around the peak | July: +0.6% / +5.9%; September: +18.8% / +49.5% | Single out the months that should be designed with a ceiling separate from August |
| Estimated OCC on full days | Nebuta period 91.4–99.0%; Games pre-session I 90.4–99.7% | Judge days that cannot grow through occupancy to be a ceiling issue |
Peak-day price ceilings should not simply follow the prior year’s actuals; they should be updated every year in line with the step-up shown by the market’s finalized YoY. Since rate left uncaptured in the demand season cannot be carried over to the following year, now, with the finalized monthly data all in, is arguably the earliest opportunity to review next summer’s ceilings.
Frequently Asked Questions
Q. Is estimated settled ADR the same as listed rates?
A. No. ADR in this article is the level of transacted rates (tax-exclusive equivalent) estimated from OTA and other sales data; past months are finalized values, and current and future months are estimates based on current sales conditions. Year-on-year comparisons are limited to finalized months.
Q. How much has October’s estimated ADR grown compared with last year?
A. October is still a mid-sales estimate and cannot be compared directly with the finalized October of last year. We recommend checking the year-on-year change again once the month is finalized at month-end.
Q. Can estimated OCC be compared with the prior year?
A. This article does not cover year-on-year occupancy. The year-on-year axis is limited to estimated settled ADR between finalized months.
About the Data
| Estimated OCC | Occupancy on an OTA-listed inventory basis = 100 − 100 × rooms remaining on OTAs ÷ total rooms. The scope is a fixed cohort of properties that list at least 30% of their total rooms on OTAs (the same set of properties for each stay date; the number of properties is stated in the text). It is an estimate based on how inventory sold on OTAs is absorbed, and its definition differs from actual room occupancy (it runs higher because rooms not listed are counted as absorbed). Target months are August and September 2026 and the selected stay dates in October–November 2026. |
| Booking curve | Based on observations from 45 days before the stay date to the most recent date. |
| Estimated settled ADR | The level of transacted rates (tax-exclusive equivalent) estimated from OTA and other sales data (lowest-plan level × coefficients by hotel type; an ensemble across multiple channels). Past months are finalized values; current and future months are estimates based on current sales conditions. Median error of 6.6% when checked against published operating results. |
| Scope (N) | Aomori Prefecture business hotels N=81–90 properties (January 2025–September 2026, varying by month); city hotels N=16 properties (constant over the same period). For 2024: business N=81–83 properties, city N=16 properties. Estimated OCC: business 26–40 properties / 2,535–4,835 rooms per day, city 10 properties / 1,120 rooms; selected dates in October–November: 38 properties / 4,804 rooms. |
| Data as of | Data as of October 10, 2026. Because sales conditions and inventory change daily, the figures in this article are a snapshot at the time of retrieval. |
References and Sources
■ Data Sources
Aggregated data from MetroEngines Research (monthly estimated settled ADR for business hotels and city hotels in Aomori Prefecture: January 2024–December 2026; daily estimated OCC: August–September 2026; booking pace by stay date: eight stay dates in October–November 2026). Event and festival dates are as published on the respective official websites. Data as of October 10, 2026.
■ Calculation Assumptions
Estimated settled ADR is a tax-exclusive-equivalent estimate, and year-on-year changes were calculated only between finalized months (January–September for 2026). The January–September average is the simple average of the monthly values. October–December 2026 are estimates based on current sales conditions and were not used to calculate year-on-year changes. Estimated OCC is on an OTA-listed inventory basis and uses only observations from 45 days before the stay date onward.
■ Limitations and Caveats
City hotels have a small scope of N=16 properties, so monthly values are easily affected by price revisions at individual properties. Estimated OCC is an estimate based on how listed inventory is absorbed, and its definition differs from actual room occupancy. No year-on-year comparison of occupancy was made. The relationship between the September gain and the National Sports Games pre-session events is an interpretation based on overlapping dates and does not establish causation.
• Ao no Kirameki Aomori National Sports Games and National Sports Games for Persons with Disabilities official website (pre-session I: September 3–13, 2026; pre-session II: October 2–9; main session: October 10–20; Disabled Sports Games: October 23–26): https://aomorikokuspo2026.pref.aomori.lg.jp/
• Aomori Prefecture press release, ‘Opening of the General Information Desk for the Ao no Kirameki Aomori National Sports Games and Disabled Sports Games’: https://www.pref.aomori.lg.jp/release/2026/81271.html
• Aomori Nebuta Festival official website (held August 2–7): https://www.nebuta.jp/