

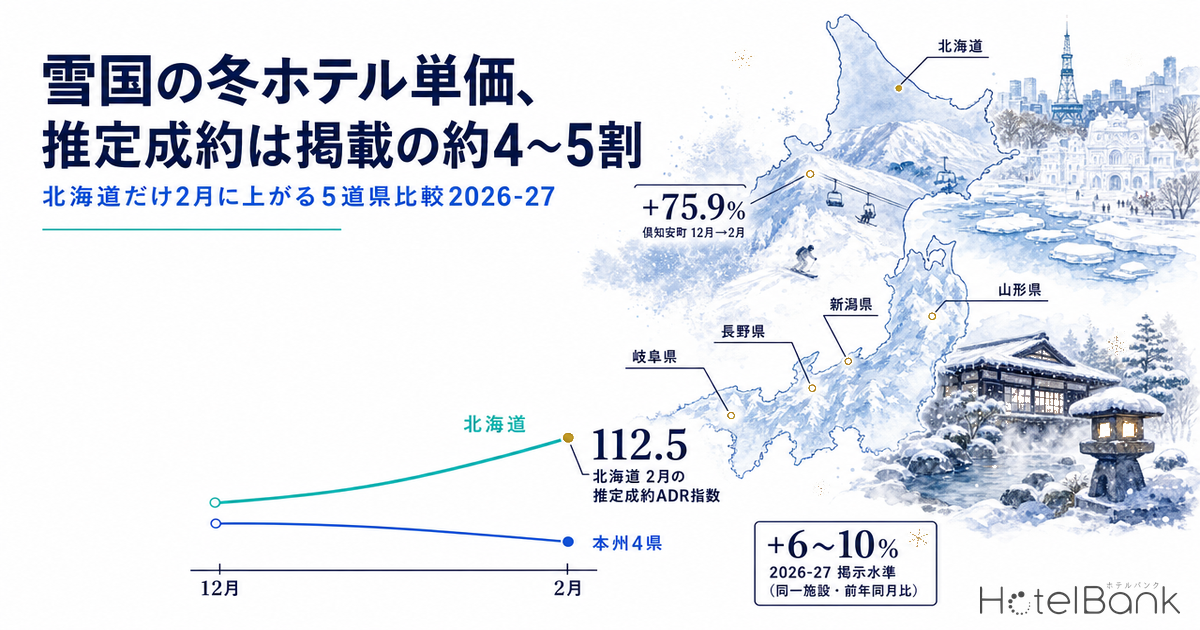
Which price bands actually sell during the three winter months at hotels and ryokan in Japan’s snow country, the regions that host the country’s ski resorts? This article covers five prefectures — Nagano, Hokkaido, Niigata, Yamagata and Gifu — and sets the listed price posted on OTAs and similar channels beside the estimated settled ADR, a figure adjusted to sit closer to what guests actually pay. It compares the finalized figures for the 2025-26 season (December 2025 to February 2026) with the levels currently posted for the 2026-27 season. The conclusion first: estimated settled ADR runs at roughly 40-50% of the listed price; from December to February only Hokkaido moves its rates up, while Nagano, Niigata, Yamagata and Gifu fall 13-20% toward February. On a same-property basis, the levels posted for 2026-27 sit 6-10% above the same month of the previous season.
- — Estimated settled ADR is 38-53% of the listed price (roughly 40-50%). In the finalized 2025-26 figures for the five prefectures, the widest gap was Yamagata in February (38.4%) and the narrowest was Niigata in December (52.5%).
- — Only Hokkaido rose from December to February, by +12.5% (¥9,421 to ¥10,598). Nagano, Niigata, Yamagata and Gifu fell 13-20% by February, and ryokan led the decline (Nagano -16.5%, Niigata -20.5%, Gifu -17.0%).
- — In February 2026, roughly half to 60% of properties were below ¥12,000. Properties at ¥30,000 or more make up around 10% in each prefecture, and those at ¥50,000 or more only 0.9-3.8%.
- — Listed prices for the 2026-27 season start +6-10% above the same month of the previous season on a same-property basis (as posted on the survey date, September 29, 2026; subject to change).
Metric Definitions Used in This Article
- ADR (average daily rate): An estimated settled rate (tax-exclusive equivalent) calculated by applying a segment-specific adjustment factor to the lowest-plan level each property publishes on OTAs (two guests in one room, per-room rate, tax included). This article calls it “estimated settled ADR” and treats it as the article’s official ADR. Checked against property-level results disclosed by listed hotel REITs (91 properties, most recent three months), the median error is about 7%. It is an estimate and differs from each property’s actual settled rates and accounting figures. Area-level ADR is the median of the properties covered (the level of a typical property in the area).
- Listed price: The per-room rate for two guests in one room (tax included), averaged across all plans (from room-only to plans with meals). At area level it is the area median of each property’s daily average. It is not referred to as ADR.
- OCC (occupancy): The share of rooms sold out of the total rooms in the area (an estimate based on inventory sold through OTAs). This article calls it “occupancy (OTA-listed inventory basis, estimated)”. It is an estimate based on how inventory sold on OTAs is being absorbed and differs from a property’s actual overall occupancy.
- LT (lead time): Days until the stay date. LT1 = the day before.
- Data source: MetroEngines Research (survey date: September 29, 2026)
Listed Price vs. Estimated Settled ADR — a 2-2.5x Gap Across the Three Winter Months
We start with the finalized 2025-26 figures by prefecture. Nagano’s estimated settled ADR was ¥14,100 in December, ¥13,800 in January and ¥12,300 in February, or about 47-51% of the listed price in the same months (¥27,400, ¥27,200 and ¥26,100). In Hokkaido, estimated settled ADR was ¥9,400-¥10,600 against a listed price of ¥23,900-¥26,400, a ratio of 39-42% and the widest gap among the five prefectures. Niigata’s December ratio of 52.5% was the closest of all, while Yamagata and Gifu widened to 38-39% in February.
This gap does not indicate the size of any discount. The listed price is an average across all plans, including high-priced plans with dinner and breakfast, and it includes tax. Estimated settled ADR, by contrast, starts from the lowest-plan level, applies a segment-specific adjustment and is a tax-exclusive equivalent, so the two are defined differently from the outset. This article therefore uses estimated settled ADR as the official ADR when discussing price levels and YoY changes, and treats the listed price as a reference series showing the center of the distribution of posted prices.
Source: MetroEngines Research, compiled by the HotelBank Editorial Team (simple three-month average, December 2025 to February 2026. Properties covered for estimated settled ADR: Nagano 810-828, Hokkaido 875-924, Niigata 406-423, Yamagata 277-289, Gifu 352-376)
| Prefecture | Month | Listed price (tax incl.) | Estimated settled ADR (tax-excl. equivalent) | Settled / listed | Properties covered (ADR) |
|---|---|---|---|---|---|
| Nagano | Dec 2025 | ¥27,445 | ¥14,112 | 51.4% | 810 |
| Jan 2026 | ¥27,239 | ¥13,787 | 50.6% | 810 | |
| Feb 2026 | ¥26,129 | ¥12,254 | 46.9% | 828 | |
| Hokkaido | Dec 2025 | ¥23,920 | ¥9,421 | 39.4% | 875 |
| Jan 2026 | ¥24,569 | ¥10,339 | 42.1% | 885 | |
| Feb 2026 | ¥26,390 | ¥10,598 | 40.2% | 924 | |
| Niigata | Dec 2025 | ¥21,858 | ¥11,478 | 52.5% | 409 |
| Jan 2026 | ¥22,225 | ¥11,244 | 50.6% | 406 | |
| Feb 2026 | ¥21,149 | ¥9,235 | 43.7% | 423 | |
| Yamagata | Dec 2025 | ¥24,693 | ¥11,236 | 45.5% | 278 |
| Jan 2026 | ¥25,425 | ¥11,111 | 43.7% | 277 | |
| Feb 2026 | ¥25,366 | ¥9,748 | 38.4% | 289 | |
| Gifu | Dec 2025 | ¥26,329 | ¥12,081 | 45.9% | 352 |
| Jan 2026 | ¥26,273 | ¥12,021 | 45.8% | 361 | |
| Feb 2026 | ¥25,448 | ¥9,898 | 38.9% | 376 |
Source: MetroEngines Research, compiled by the HotelBank Editorial Team (properties covered for listed price: Nagano 1,657-1,742, Hokkaido 1,420-1,569, Niigata 633-687, Yamagata 337-356, Gifu 556-605)
The interesting point is that winter is not the season when the gap is widest. Across the 12 finalized months from September 2025 to August 2026, December was the month with the highest settled-to-listed ratio (the smallest gap) in Nagano, Niigata, Yamagata and Gifu. In Nagano, June shows an estimated settled ADR of ¥10,000 against a listed price of ¥26,700, a ratio of only 37%, whereas December narrows to 51%. The pattern suggests that in peak season the lowest-plan level itself is raised and the price spread between plans compresses. Hokkaido alone stays at around 39-43% throughout the year, with no notable narrowing in winter.
Hokkaido Rises in February, the Four Honshu Prefectures Peak in December — Different Curves Within the Season
Next we compare the path of estimated settled ADR indexed to December = 100. Hokkaido rose for two straight months, to 109.7 in January and 112.5 in February. In contrast, Nagano fell to 86.8 in February, Niigata to 80.5, Yamagata to 86.8 and Gifu to 81.9, making December, which includes the year-end and New Year holidays, the peak of the season.
Source: MetroEngines Research, compiled by the HotelBank Editorial Team (estimated settled ADR, December 2025 = 100. Properties covered are the same as in Table 1)
For Hokkaido, the shape was the same in the 2024-25 season. Hokkaido’s estimated settled ADR went from ¥7,900 in December 2024 to ¥9,500 in February 2025 (+20.2%), again highest in February. The decline on the Honshu side, on the other hand, was clearer in 2025-26: in the 2024-25 season Nagano moved -3.1% from December to February and Niigata +3.2%, both nearly flat. Hokkaido’s February high is a structure observed in two consecutive seasons, while the December-high, February-low pattern in the four Honshu prefectures is a tendency that strengthened in 2025-26, and the two need to be kept distinct.
Breaking the data down to municipalities shows that Hokkaido’s February high is not confined to specific ski resorts. Kutchan stands out at ¥36,100 in December to ¥63,500 in February (+75.9%, 21 properties covered in February), but Sapporo’s Chuo Ward also rose from ¥14,700 to ¥20,600 (+40.3%, 137 properties), Otaru +41.0% (26 properties), Asahikawa +54.2% (38 properties) and Chitose +44.1% (24 properties), so rates moved up in February across a wide area that includes cities. The likely background is that events and tourism assets with a February demand peak, such as the Sapporo Snow Festival and drift-ice sightseeing in eastern Hokkaido, are spread across the prefecture.
In Nagano and Niigata, the towns and villages that host ski resorts moved differently from other cities and tourist areas. Hakuba was -3.0% (45 properties covered in February), Nozawa Onsen +6.3% (19 properties), Yuzawa in Niigata +5.0% (52 properties) and Myoko +5.2% (40 properties), so the centers of ski demand broadly held their December level through February. Meanwhile, Karuizawa was -15.8% (49 properties), Matsumoto -17.6% (97 properties) and Nagano City -9.8% (74 properties), with larger February declines in areas where demand centers on year-end and New Year tourism. The prefecture-wide February dip therefore reflects seasonal differences in non-ski areas rather than a slowdown in ski areas.
Source: MetroEngines Research, compiled by the HotelBank Editorial Team (change in estimated settled ADR from December 2025 to February 2026. Selected from municipalities with 15 or more properties covered for estimated settled ADR in February)
The same picture appears by segment. Ryokan in Nagano went from ¥15,900 in December to ¥13,300 in February (-16.5%, 506 properties covered in February), ryokan in Niigata -20.5% (243 properties) and ryokan in Gifu -17.0% (231 properties), so ryokan led the February dip on the Honshu side. Business hotels in Hokkaido, on the other hand, went from ¥7,500 to ¥8,800 (+16.6%, 441 properties), with urban rates rising toward February. Resorts in Niigata went from ¥21,400 to ¥24,700 (+15.4%, 29 properties), showing February demand as a ski resort destination.
| Prefecture | Segment | Dec 2025 | Feb 2026 | Dec to Feb | Properties covered (Dec/Feb) |
|---|---|---|---|---|---|
| Nagano | Resort | ¥20,060 | ¥16,892 | -15.8% | 131/133 |
| Ryokan | ¥15,912 | ¥13,290 | -16.5% | 497/506 | |
| Business | ¥7,304 | ¥7,212 | -1.3% | 166/172 | |
| Hokkaido | Resort | ¥18,585 | ¥19,026 | +2.4% | 135/134 |
| Ryokan | ¥10,574 | ¥10,023 | -5.2% | 241/270 | |
| Business | ¥7,518 | ¥8,769 | +16.6% | 425/441 | |
| Niigata | Resort | ¥21,379 | ¥24,678 | +15.4% | 30/29 |
| Ryokan | ¥16,735 | ¥13,307 | -20.5% | 233/243 | |
| Business | ¥6,374 | ¥6,384 | +0.2% | 128/133 | |
| Yamagata | Ryokan | ¥16,437 | ¥15,140 | -7.9% | 171/182 |
| Business | ¥6,496 | ¥6,840 | +5.3% | 77/76 | |
| Gifu | Ryokan | ¥17,259 | ¥14,326 | -17.0% | 208/231 |
| Business | ¥7,155 | ¥6,929 | -3.2% | 119/122 |
Source: MetroEngines Research, compiled by the HotelBank Editorial Team (estimated settled ADR. Resorts in Yamagata and Gifu are omitted because fewer than 20 properties are covered)
Compared with the same month a year earlier, estimated settled ADR in the 2025-26 season exceeded 2024-25 in all five prefectures. To remove the effect of changes in the set of properties covered, we look at the YoY change (median) for the same properties for which estimated settled ADR could be calculated in both seasons: December was +10.6% (Hokkaido) to +14.0% (Nagano) and February was +5.6% (Niigata) to +8.4% (Nagano). December growth exceeded February growth, confirming on a YoY basis as well that year-end and New Year rate-setting was strong on the Honshu side. According to the Japan Tourism Agency’s Overnight Travel Statistics Survey (second preliminary report), nationwide room occupancy in February 2026 was 59.6% and total guest nights were 47.65 million (-0.6% YoY).
| Prefecture | Dec YoY | Jan YoY | Feb YoY | Same properties (Dec/Jan/Feb) |
|---|---|---|---|---|
| Nagano | +14.0% | +10.8% | +8.4% | 629/625/617 |
| Hokkaido | +10.6% | +11.0% | +7.2% | 610/617/630 |
| Niigata | +11.4% | +8.2% | +5.6% | 338/333/339 |
| Yamagata | +11.3% | +11.7% | +6.5% | 229/229/233 |
| Gifu | +10.8% | +10.4% | +6.4% | 280/283/289 |
Source: MetroEngines Research, compiled by the HotelBank Editorial Team (median same-property YoY change in estimated settled ADR. Properties for which it could be calculated in both the 2024-25 and 2025-26 seasons)
Price Bands That Hold Up, and Price Bands Where Properties Are Thin
An area median alone does not show which price bands properties cluster in. We therefore calculated February 2026 estimated settled ADR for each property and compared the share of properties by price band (covering 629 properties in Nagano, 645 in Hokkaido, 346 in Niigata, 237 in Yamagata and 292 in Gifu).
Source: MetroEngines Research, compiled by the HotelBank Editorial Team (share of properties by property-level estimated settled ADR in February 2026. Band widths differ from band to band)
In all five prefectures, properties with an estimated settled ADR below ¥12,000 make up roughly half to 60% of the total (Nagano 49.1%, Hokkaido 58.1%, Niigata 59.8%, Yamagata 57.0%, Gifu 53.1%). Business hotels support the depth of this band: 83 of Nagano’s 129 business hotels and 86 of Niigata’s 110 fall below ¥8,000. The band at ¥30,000 or more, meanwhile, is around 10% in each prefecture (Nagano 9.4%, Hokkaido 8.7%, Niigata 10.1%, Yamagata 13.5%, Gifu 10.3%), and ¥50,000 or more is only 0.9-3.8%.
The spread of the distribution differs by segment. Nagano’s 411 ryokan are dispersed across every band from below ¥8,000 to ¥50,000 or more and are not concentrated in any single band. Its 76 resorts are also widely distributed, from the ¥8,000-¥12,000 band (16 properties) to the ¥30,000-¥50,000 band (15 properties). Hokkaido has 18 properties in the ¥50,000-or-more band (11 of them resorts), and the 1,740 rooms in that band account for 2.7% of all rooms at the properties covered in February 2026 (64,135 rooms). Nagano’s ¥50,000-or-more band has 8 properties and 212 rooms (0.8%), so even within the same top band the depth of room volume differs.
Comparing the December and February distributions, the difference in seasonal curves shows up directly as movement between price bands. In Hokkaido the share of properties below ¥8,000 fell from 43.3% in December to 37.2% in February, while ¥30,000 or more rose from 5.1% to 8.7%. Nagano went the other way: below ¥8,000 increased from 23.5% to 26.7% and ¥30,000 or more decreased from 10.8% to 9.4%. A band with few properties is not necessarily a band without demand. It is appropriate to read it as a fact about which bands have no rooms stacked in them.
| Prefecture (Feb 2026) | Under ¥8,000 | ¥8,000-12,000 | ¥12,000-16,000 | ¥16,000-20,000 | ¥20,000-30,000 | ¥30,000-50,000 | ¥50,000 or more |
|---|---|---|---|---|---|---|---|
| Nagano (629 properties) | 168 | 141 | 106 | 69 | 86 | 51 | 8 |
| Hokkaido (645 properties) | 240 | 135 | 81 | 61 | 72 | 38 | 18 |
| Niigata (346 properties) | 147 | 60 | 41 | 25 | 38 | 32 | 3 |
| Yamagata (237 properties) | 92 | 43 | 20 | 19 | 31 | 23 | 9 |
| Gifu (292 properties) | 107 | 48 | 37 | 33 | 37 | 25 | 5 |
Source: MetroEngines Research, compiled by the HotelBank Editorial Team (number of properties. Operating properties for which estimated settled ADR could be calculated)
Where Do the Posted 2026-27 Levels Sit Relative to Last Season?
For stays from December 2026 to February 2027, prices were already posted on OTAs as of the survey date (September 29, 2026). However, figures for future months are a snapshot based on what is posted now, and they change as the stay date approaches through new plans and price adjustments. In addition, the basis of estimation differs between finalized (past) months and future months, so estimated settled ADR cannot be compared directly with the previous season. This section therefore uses the listed price.
Simply lining up area-wide listed prices, Nagano’s December 2026 figure of ¥32,000 appears 16.7% above the same month of the previous season (¥27,400). However, only 1,483 properties have already posted December 2026 rates, fewer than the 1,696 of the previous season, and the mix of properties differs (when winter listings become complete is examined in detail in our analysis measuring the timing of winter sales launches across 13 prefectures). Taking the YoY change (median) only for the same properties with listings in both seasons, Nagano narrows to +7.8% in December, +8.1% in January and +7.1% in February. Hokkaido is the highest of the five at +7.9%, +10.1% and +9.3%, while Niigata, Yamagata and Gifu fall within +5.9% to +8.2%.
Source: MetroEngines Research, compiled by the HotelBank Editorial Team (median same-property YoY change in listed price. The 2026-27 season is based on levels posted as of the survey date)
As a yardstick for reading this +6-10% position, here is the same-property YoY change for months that are already finalized. The August 2026 listed price was +2.5% (Gifu) to +5.6% (Nagano) YoY on a same-property basis. The same-property YoY change in listed price for the previous winter (the 2025-26 season) was also +1.2% to +4.2%. Listings for 2026-27 start a step higher than these, but early-stage listings include early pricing decisions and leave room for adjustment closer to the stay date. All that can be said at this point is that the starting point of listings is higher than last season; the YoY change in settled levels has to be judged after the season is finalized.
| Prefecture | Month | Previous-season listed price (finalized) | 2026-27 listed price (as of survey date) | Properties listing (previous/current) | Same-property YoY | Same properties |
|---|---|---|---|---|---|---|
| Nagano | Dec | ¥27,445 | ¥32,031 | 1,696/1,483 | +7.8% | 726 |
| Feb | ¥26,129 | ¥33,246 | 1,742/1,060 | +7.1% | 556 | |
| Hokkaido | Dec | ¥23,920 | ¥29,482 | 1,442/1,704 | +7.9% | 676 |
| Feb | ¥26,390 | ¥37,831 | 1,569/1,404 | +9.3% | 571 | |
| Niigata | Dec | ¥21,858 | ¥25,748 | 645/560 | +5.9% | 351 |
| Feb | ¥21,149 | ¥28,776 | 687/431 | +6.0% | 273 | |
| Yamagata | Dec | ¥24,693 | ¥27,301 | 342/311 | +5.9% | 216 |
| Feb | ¥25,366 | ¥28,903 | 356/235 | +7.4% | 171 | |
| Gifu | Dec | ¥26,329 | ¥30,479 | 556/575 | +6.0% | 280 |
| Feb | ¥25,448 | ¥32,271 | 605/425 | +6.1% | 220 |
Source: MetroEngines Research, compiled by the HotelBank Editorial Team (listed price = area median of the all-plan average, two guests in one room, tax included. 2026-27 is an estimate based on levels posted as of the survey date)
Hokkaido’s February-high shape is preserved in the 2026-27 listings as well. Hokkaido’s listed price is ¥29,500 for December 2026 against ¥37,800 for February 2027, a larger rise within the season than in Nagano (¥32,000 to ¥33,200) or Niigata (¥25,700 to ¥28,800). On the calendar side, 2026 had a three-day weekend on February 21 (Sat) to 23 (Mon, the Emperor’s Birthday), whereas in 2027 both February 11 (Thu, National Foundation Day) and February 23 (Tue, the Emperor’s Birthday) are weekday holidays, leaving February without a three-day weekend. The different alignment of weekends and holidays in February compared with last season is worth keeping in mind when looking at how February demand is distributed.
Absorption Speed by Segment — How Bookings Built Up Over the Most Recent Long Holiday
Booking progress for the year-end and New Year period (for example December 31, 2026 (Thu)) and for February 2027 is best read from data observed from 45 days before the stay date onward. For stays on December 31, 2026, those observations start to become available from November 16, and as of the survey date there are no data points yet showing booking progress. In addition, inventory observation began in March 2026, so no booking curves exist for the 2025-26 year-end and New Year period or the February holidays.
This section therefore takes the first day of Silver Week in September 2026 (the five-day holiday of September 19 (Sat) to 23 (Wed)), the most recently completed long holiday, and compares it with a weekday in the same month (September 9 (Wed)) to see at what point rooms fill up in each segment. The season is different, but it offers material for understanding each segment’s pattern of how bookings for the first day of a holiday build from LT45 to LT1.
Source: MetroEngines Research, compiled by the HotelBank Editorial Team (occupancy (OTA-listed inventory basis, estimated) for stays on September 19, 2026 (Sat), all segments. Covered: Nagano 724 properties / 22,502 rooms, Hokkaido 803 properties / 55,160 rooms, Niigata 294 properties / 13,346 rooms, Yamagata 187 properties / 6,620 rooms, Gifu 307 properties / 11,506 rooms (based on listings on major booking sites). A fixed group made up of properties whose OTA-listed allotment is 30% or more of total rooms)
On the first day of Silver Week, occupancy (OTA-listed inventory basis, estimated) had already reached 73.5% (Yamagata) to 83.7% (Gifu) at LT45, 13-31 points above the weekday of September 9 (49.8% to 69.2% at the same lead time). Most holiday bookings were in place 45 days out; the build-up after LT45 was largest in Yamagata at +25.6 points (99.1% at LT1) and gentle in Hokkaido at +13.0 points (94.9% at LT1).
| Prefecture | Segment | Properties / rooms covered | 9/19 LT45 | 9/19 LT14 | 9/19 LT1 | 9/9 (weekday) LT1 |
|---|---|---|---|---|---|---|
| Nagano | Resort | 64 / 4,317 | 77.7% | 94.1% | 96.1% | 84.8% |
| Ryokan | 290 / 6,833 | 75.5% | 93.1% | 97.8% | 86.4% | |
| Business | 83 / 7,406 | 82.5% | 98.3% | 99.1% | 94.1% | |
| Hokkaido | Resort | 94 / 9,810 | 78.6% | 89.3% | 94.6% | 88.5% |
| Ryokan | 177 / 7,453 | 85.3% | 96.2% | 98.4% | 90.3% | |
| Business | 227 / 26,300 | 81.1% | 91.8% | 95.2% | 98.3% | |
| Niigata | Resort | 16 / 2,845 | 61.5% | 78.5% | 92.5% | 83.0% |
| Ryokan | 148 / 3,486 | 78.9% | 95.0% | 99.4% | 83.3% | |
| Business | 49 / 5,876 | 92.8% | 98.9% | 98.7% | 92.8% | |
| Yamagata | Ryokan | 115 / 2,961 | 71.0% | 96.6% | 99.2% | 84.9% |
| Business | 25 / 2,109 | 68.0% | 99.9% | 98.9% | 97.1% | |
| Gifu | Ryokan | 147 / 3,598 | 86.3% | 97.9% | 99.4% | 85.2% |
| Business | 60 / 5,903 | 84.0% | 95.3% | 99.2% | 83.8% |
Source: MetroEngines Research, compiled by the HotelBank Editorial Team (occupancy (OTA-listed inventory basis, estimated). Properties / rooms covered are the group for stays on September 19 (based on listings on major booking sites). Resorts in Yamagata (15 properties) and resorts in Gifu (too few properties to form a group) are omitted. Because rooms not listed are counted as sold, the figure comes out higher than actual room occupancy)
By segment, differences emerged in the timing at which holiday bookings were captured. Ryokan in Yamagata built up 25.6 points in about a month, from 71.0% at LT45 to 96.6% at LT14, a pattern in which the final month brings in a large share. Ryokan in Nagano also added +17.6 points over the same period. Ryokan in Gifu, by contrast, were already mostly full early, at 86.3% at LT45. Resorts in Niigata (16 properties) started from the lowest position of any segment in the five prefectures, 61.5% at LT45, and kept building for the longest, up to 92.5% at LT1.
In Hokkaido, the weekday of September 9 also filled to 94.7% at LT1, nearly the same level as the first day of the holiday (94.9%). Business hotels in particular were higher on the weekday (98.3%) than on the first day of the holiday (95.2%), showing that urban demand in Hokkaido is deep regardless of the day of the week (for the day-by-day, segment-by-segment build-up over the first three days of Silver Week, see our Hokkaido Silver Week booking curve analysis). Behind Hokkaido’s rising rates toward February, there is likely a depth of demand that includes not only ski resorts but also weekday demand in cities. Booking progress for the year-end and New Year period and for February can be tracked within the same framework from 45 days before each stay date (November 16 for stays on December 31, and December 28 for stays on February 11, 2027).
Summary — In Snow Country Winters, Which Month and Which Segment Command Rates Differs by Prefecture
Here are the points that can be read from the winter data for the five prefectures. First, estimated settled ADR sits at roughly 40-50% of the listed price, and in Nagano, Niigata, Yamagata and Gifu December was the month of the year when it came closest to the listed price. Second, Hokkaido’s rates peaked in February for two consecutive seasons, and rates rose in February across a wide area including cities such as Sapporo’s Chuo Ward, Otaru and Asahikawa, not only Kutchan. In the four Honshu prefectures December was the peak, and the February decline was large for ryokan and for cities and tourist areas other than ski areas. Third, in the distribution by price band more than half of properties cluster below ¥12,000, with ¥30,000 or more at around 10% and ¥50,000 or more at 0.9-3.8%. Fourth, posted levels for the 2026-27 season start 6-10% above the same month of the previous season on a same-property basis, but listings for future months will change, so settled levels are best judged after the season is finalized.
For operators, this is material for designing December and February pricing separately, on the premise that even within snow country the month that commands rates and the segment that commands rates differ by prefecture. For investors, the depth of February in Hokkaido and the fact that ski areas on the Honshu side hold their level through February offer clues for identifying where winter earnings come from.
⚠ Note on prices for future dates: Listed prices for December 2026 to February 2027 are a snapshot based on selling prices published on OTAs as of the survey date (September 29, 2026) and will change as the check-in date approaches through new plans and price adjustments. The number of properties listing is also lower than in the previous season, so these are values still under observation. Because the basis of estimation for estimated settled ADR differs between finalized months and future months, the two are not compared on a YoY basis.
Related Reading
References and Sources
■ Data sources
MetroEngines Research listed price and estimated settled ADR by area, municipality, segment and property for the five prefectures (Nagano, Hokkaido, Niigata, Yamagata and Gifu; December 2024 to February 2027, survey date September 29, 2026), and occupancy (OTA-listed inventory basis, estimated; stays on September 9 and 19, 2026). Nationwide room occupancy and total guest nights are from the Japan Tourism Agency’s Overnight Travel Statistics Survey, and public holidays are from the Cabinet Office’s “National Holidays” page.
■ Assumptions
Estimated settled ADR is a tax-exclusive equivalent estimate that applies a segment-specific adjustment factor to each property’s lowest-plan level; at area level it is the median of the properties covered. The listed price is the area median of the all-plan average for two guests in one room, tax included. YoY change is the median rate of change for the same properties for which it could be calculated in both seasons. Because the basis of estimation differs between finalized months and future months, the 2026-27 season is compared with the previous year using the listed price rather than estimated settled ADR.
■ Limitations and caveats
Estimated settled ADR is an estimate, and its error (median) against results disclosed by listed hotel REITs is about 7%. Listed prices for the 2026-27 season are a snapshot as of the survey date, and the number of properties listing is lower than in the previous season. Occupancy comes out higher than actual room occupancy because rooms not listed are counted as sold. Inventory observation began in March 2026, so booking curves for the year-end and New Year period and the February holidays do not exist as of this article.
■ Sources
- MetroEngines Research — listed price and estimated settled ADR by area, segment and property for the five prefectures (December 2024 to February 2027); booking curves and occupancy (OTA-listed inventory basis, estimated) (stays on September 9 and 19, 2026)
- Japan Tourism Agency, Overnight Travel Statistics Survey
- Japan Tourism Agency, Overnight Travel Statistics Survey (February 2026 second preliminary report and March 2026 first preliminary report) (April 30, 2026)
- Cabinet Office, “National Holidays”