

TRUNK(HOTEL) SAPPORO, the first TRUNK(HOTEL) property outside Tokyo, is scheduled to open on September 17, 2027 on the upper floors of the Sapporo Daibiru Building at Minami 2-jo Nishi 4-chome, Chuo Ward, Sapporo. It will have 107 rooms, 18 of them suites (including spa suites). The 18th floor will house TRUNK(BATH HOUSE), the brand’s first spa, and the 10th floor will hold Sushi Saito (鮨さいとう) in its first Sapporo outlet, an all-day dining restaurant, a lounge & bar, a chapel and banquet rooms. With F&B, spa and banquet floor area that is large relative to the room count, it is a textbook lifestyle hotel built on non-room revenue.
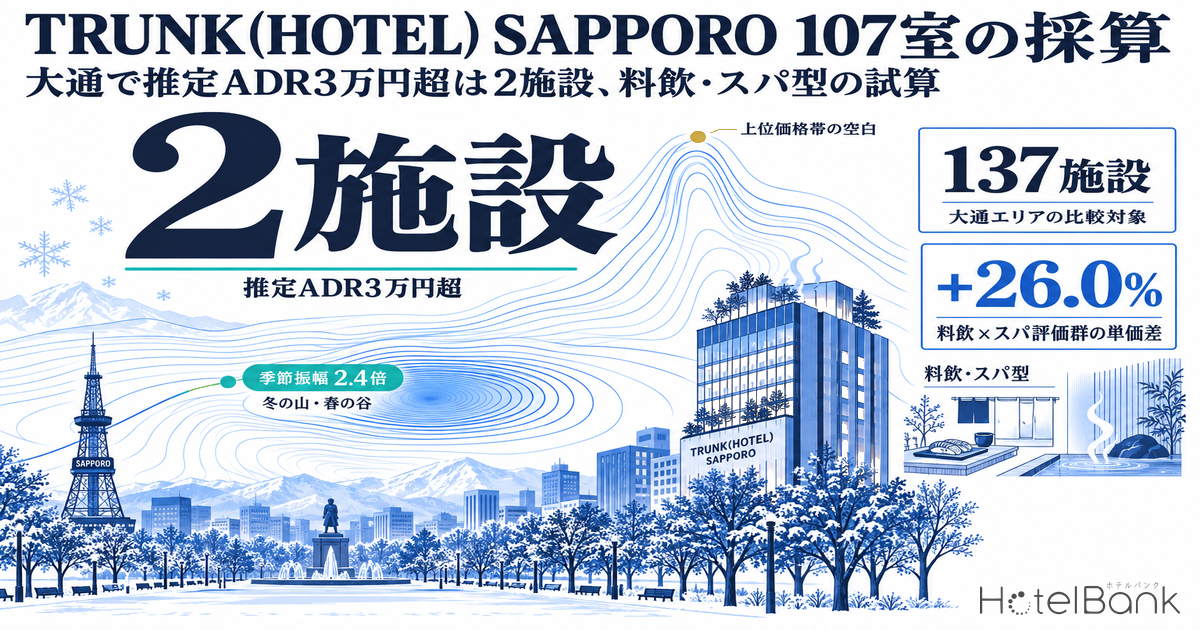
Starting from this single project, this article tests how far a model in which F&B and spa lift both room rates and non-room revenue can work in the Odori area. The conclusion first: of the 137 hotels within a 1.5 km radius of Minami 2-jo Nishi 4-chome for which an estimated settled ADR can be calculated across 12 months, only 2 average above ¥30,000 over the 12 months, and none exceeds ¥50,000. A mid-sized, roughly 107-room property aimed at the upper price tier does not yet exist in this catchment. At the same time, hotels whose guests frequently mention F&B show a median rate 15.6% higher, and the 13 hotels where both F&B and spa are talked about show a median 26.0% higher. On that basis, we go on to a simplified GOP estimate for 107 rooms and a comparison against office rent.
How this differs from our earlier coverage: On Sapporo, we have covered citywide supply and the high-rate tier in Sapporo Hotel Supply 2026-2029: Hyatt Opens a New High-ADR Tier, the 1 km area around Nakajima Park in our piece on the closure of the 216-room Sapporo Park Hotel at the end of February 2027, and rebranding cases in our analysis of the 9,654 rooms added in Chuo Ward over seven years. This article differs from those: it takes a single project in Odori as the starting point and examines the profit structure of a mixed-use hotel carrying F&B and spa. It is our first article devoted to TRUNK’s Sapporo project.
Metric Definitions Used in This Article
- ADR (average daily rate) = an estimated settled rate (tax-exclusive equivalent) calculated by applying a segment-specific adjustment factor to the lowest-plan level each hotel publishes on OTAs (two guests per room, price per room, tax included). Checked against property-level results disclosed by listed hotel REITs (91 properties, most recent three months), the median error is about 7%. It is an estimate and differs from each hotel’s actual transacted rates and accounting figures. Area-level ADR is the median of the hotels covered (the level of a typical hotel in the area).
- OCC (occupancy) = rooms sold as a share of total rooms in the area (an estimate based on OTA sales inventory; consistency checks against monthly REIT disclosures confirm accuracy to within a few points). It is an estimate based on the take-up of inventory sold on OTAs and differs from a hotel’s actual overall occupancy.
- Booking curve = the path of remaining OTA rooms toward the check-in date. LT (lead time) = days until check-in. This article uses LT45 to LT1 only.
- Early sell-out = zero rooms remaining as of the day before the stay (LT1). Where a hotel was already sold out 45 or more days before the stay, we do not give a specific number of days and write “sold out 45 or more days ahead”.
- References to listed prices mean the price per room for two guests per room (tax included).
- Data source: MetroEngines Research & Consulting
- — A 2.4x seasonal swing: Estimated settled ADR in Sapporo’s Chuo Ward was ¥20,600 in February 2026 and ¥8,600 in April. A model that earns on rooms alone takes the off-season drop in full.
- — A gap in the upper price tier: Of 137 hotels and 27,046 rooms within a 1.5 km radius, only 2 hotels with 757 rooms have a 12-month average estimated settled ADR above ¥30,000. No mid-sized hotel of 50–250 rooms exceeds ¥30,000.
- — F&B, spa and rate move together: Across 143,163 guest reviews, the 13 hotels where both F&B and spa are frequently mentioned have a median rate of ¥18,400, against ¥14,600 for the other 122.
- — Simplified GOP estimate: In the base case of an estimated ADR of ¥45,100, full-year OCC of 72% and a 50% rooms share of revenue, total revenue is ¥2.54 billion and GOP ¥690 million (GOP margin 27.3%).
- — Hotel floors versus office floors: The base-case GOP of ¥690 million equals the office rent on about 5,900 tsubo at the ¥9,785 per tsubo of the district south of Minami 1-jo, or about 3,900 tsubo at the ¥14,702 around Odori Park (1 tsubo is about 3.3 sqm; GOP is before operator fees, the FF&E reserve and property tax).
TRUNK(HOTEL) SAPPORO Project Outline — Large F&B, Spa and Banquet Floors for 107 Rooms
We start with the primary sources. According to the press release TRUNK Co., Ltd. issued on August 28, 2026, TRUNK(HOTEL) SAPPORO will occupy floors 10 to 18 of the Sapporo Daibiru Building, which has 19 floors above ground and 2 below. The 107 rooms are on floors 13 to 18, split into 89 standard rooms and 18 suites. The announced indicative room rate is ¥60,000 to ¥600,000 per room.
The depth of the non-room floors defines the character of this project. The 10th floor brings together reception, Sushi Saito, the all-day dining restaurant, the lounge & bar, the chapel, a banquet room and a private studio. Floors 11 and 12 are banquet rooms, and the 18th floor holds the spa TRUNK(BATH HOUSE) — with a water channel about 40 m long, 10 types of bathing content, a sauna and an open-air cooling space — plus a gym. In other words, of the nine floors, only five (13 to 17) are rooms only.
| Item | Details |
|---|---|
| Name | TRUNK(HOTEL) SAPPORO |
| Opening | Scheduled for Friday, September 17, 2027 |
| Location | Sapporo Daibiru Building, Minami 2-jo Nishi 4-chome, Chuo Ward, Sapporo (directly connected to Odori Station and the underground mall) |
| Building | 19 floors above ground and 2 below; gross floor area about 42,000 sqm (about 12,700 tsubo); completion scheduled for April 2027. Hotel on the upper floors, offices in the middle, retail below |
| Rooms | 107 (89 standard, 18 suites including spa suites), floors 13–18 |
| Indicative room rate | ¥60,000–¥600,000 per room (announced figure) |
| F&B | Sushi Saito (first Sapporo outlet), all-day dining, lounge & bar (10th floor) |
| Spa | TRUNK(BATH HOUSE) (18th floor): water channel about 40 m long, 10 types of bathing content, high-temperature sauna, cold plunge, open-air cooling space |
| Banquets and weddings | Chapel (6 m ceiling height), 3 banquet rooms (floors 10–12) |
Source: Compiled by the HotelBank Editorial Team from the TRUNK Co., Ltd. press release (August 28, 2026) and Daibiru Corporation, “Sapporo Daibiru Redevelopment Project”
The 17% suite ratio also matters for profitability. If we assume ¥35,000 per standard room and ¥95,000 per suite (both on the same tax-exclusive-equivalent basis as the ADR in this article), the weighted average across 107 rooms comes to ¥45,100. On that basis the 18 suites generate 35.4% of rooms revenue. Suites that make up less than a fifth of the room count carrying a third of revenue is consistent with our earlier analysis of suite price multiples at 50 hotels nationwide. Because the announced indicative rate of ¥60,000 does not state its assumptions, such as whether tax is included or which meal terms apply, this article uses a conservative assumption that sets the lower bound at a tax-exclusive equivalent of ¥35,000.
Rates in Sapporo’s Chuo Ward — A 2.4x Gap Between the February Peak and the April Trough
Next we check the rate level of Chuo Ward, Sapporo, where the project sits. According to MetroEngines Research, the estimated settled ADR for Chuo Ward averaged ¥14,400 over the 12 months from September 2025 to August 2026 (130–139 hotels covered), up 11.1% from the same 12 months a year earlier (¥13,000). By segment, business hotels were at ¥13,800 (99–105 hotels, +9.5% YoY) and city hotels at ¥19,400 (25–26 hotels, +10.2% YoY).
The defining feature is the size of the seasonal swing. February 2026 (Sapporo Snow Festival) came in at ¥20,600, up 6.1% YoY, and July at ¥18,100, up 3.9%, forming a second peak in summer. April, by contrast, falls to ¥8,600, a 2.4x gap against February. For city hotels alone, February is ¥29,400 against ¥10,900 in April, widening the swing to 2.7x. August was ¥16,400, down 10.5% YoY: the height of the summer peak varies from year to year.
Chuo Ward, Sapporo: Monthly Estimated Settled ADR (Years Overlaid)
Source: MetroEngines Research & Consulting (130–139 hotels per month). September–December 2026 are estimates based on listed rate levels at the time of the survey
Estimated Settled ADR by Segment — 12-Month Average, February and April
Source: MetroEngines Research & Consulting (business hotels: 99–105 hotels; city hotels: 25–26 hotels; September 2025–August 2026)
This swing changes what non-room revenue means. Rooms revenue takes the seasonality of travel demand as it is, but sales at a sushi restaurant, restaurants, a bar, a spa and banquet rooms are also supported by demand from people who work and live nearby. Within 1 km of Minami 2-jo Nishi 4-chome there are 11,709 business establishments and 169,677 workers (32.3% of them in office-type industries), and the resident population within 1.5 km is projected by the national government to stay flat, from 75,508 in 2025 to 75,621 in 2040. Odori has a deep base of local demand to make up for rooms in the off-season months.
Source: Ministry of Land, Infrastructure, Transport and Tourism (MLIT), National Land Numerical Information (250 m mesh population projections, FY2024 National Spatial Planning and Regional Policy Bureau estimates). Resident population, not visitor or pass-through population
Location — Commercial Zone, 800% Floor Area Ratio, Adjacent Benchmark Land Price Up 13.6% in Two Years
We check the site conditions in MLIT’s Real Estate Information Library. The area around the site is a commercial zone (floor area ratio 800%, building coverage ratio 80%). The official land price benchmark site about 100 m to the north (Minami 1-jo Nishi 4-chome) stood at ¥7.44 million per sqm as of January 1, 2026, up 7.1% YoY, and up 13.6% in two years from ¥6.55 million in 2024. The benchmark site about 180 m to the east (Minami 2-jo Nishi 3-chome) is ¥2.86 million, up 10.0% YoY, and Odori Nishi 6-chome, about 380 m to the northwest, is ¥3.25 million, up 10.2%. Rising land prices bear directly on the decision of whether to use the upper floors for offices or a hotel (compared later in this article).
| Official land price benchmark site | Distance from site | 2024 | 2025 | 2026 | 2026 YoY |
|---|---|---|---|---|---|
| Minami 1-jo Nishi 4-chome (commercial, FAR 800%) | approx. 100 m | ¥6.55M/sqm | ¥6.95M/sqm | ¥7.44M/sqm | +7.1% |
| Minami 2-jo Nishi 3-chome (commercial, FAR 800%) | approx. 180 m | ¥2.30M/sqm | ¥2.60M/sqm | ¥2.86M/sqm | +10.0% |
| Odori Nishi 6-chome (commercial, FAR 800%) | approx. 380 m | ¥2.70M/sqm | ¥2.95M/sqm | ¥3.25M/sqm | +10.2% |
Source: Compiled by MetroEngines Research & Consulting from the MLIT Real Estate Information Library (official land prices, zoning)
Positioning — Among 137 Hotels Within 1.5 km, the Mid-Sized × Above-¥30,000 Band Is Empty
This brings us to the core question of positioning. Within a 1.5 km radius of Minami 2-jo Nishi 4-chome, across the business, city, resort, ryokan and deluxe segments, 137 hotels with 27,046 rooms had an estimated settled ADR that could be calculated for at least 10 of the 12 months. The median 12-month average ADR of these 137 hotels is ¥14,800, and even the highest hotel is at ¥38,600.
| Estimated settled ADR (12-month average) | Hotels | Rooms | Share of rooms | Rooms per hotel (median) |
|---|---|---|---|---|
| Under ¥10,000 | 15 | 1,579 | 5.8% | 99 |
| ¥10,000–15,000 | 56 | 9,312 | 34.4% | 160 |
| ¥15,000–20,000 | 37 | 8,493 | 31.4% | 206 |
| ¥20,000–30,000 | 27 | 6,905 | 25.5% | 218 |
| ¥30,000–50,000 | 2 | 757 | 2.8% | 378 |
| ¥50,000 and above | 0 | 0 | 0.0% | — |
| Total | 137 | 27,046 | 100% | — |
Source: MetroEngines Research & Consulting (1.5 km radius of Minami 2-jo Nishi 4-chome, N=137 hotels, September 2025–August 2026)
Some 71.7% of rooms sit in the bands below ¥20,000, and only 2 hotels with 757 rooms (2.8%) exceed ¥30,000. Both of those are large properties of more than 300 rooms. No mid-sized hotel of 50–250 rooms within 1.5 km has a 12-month average above ¥30,000, and the highest level among hotels of around 100 rooms stays in the upper ¥20,000s. At 107 rooms and an assumed ¥45,100, TRUNK(HOTEL) SAPPORO sits in the “upper middle” of the scatter chart below, rather than in the upper right, where no existing hotels are found.
Room Count × Estimated Settled ADR Positioning Map (1.5 km Radius)
Source: MetroEngines Research & Consulting (N=137 hotels, 12-month average for September 2025–August 2026). The star marks the position assumed for TRUNK(HOTEL) SAPPORO in this article’s estimate (not an announced figure)
Dense band: ¥10,000–20,000
93 hotels with 17,805 rooms (65.8% of rooms) cluster here. Mostly business hotels, competing on differences in price and location.
White space 1: above ¥30,000 × 50–250 rooms
No hotels qualify. There is room for a mid-sized hotel that builds stay value through F&B and spa.
White space 2: above ¥50,000
None within 1.5 km at any size. A suite-heavy room mix leaves room to raise the ceiling on room rates.
Source: MetroEngines Research & Consulting (N=137 hotels; circle size = room count, color = estimated settled ADR band)
The same pattern shows in the pace of inventory take-up. For a past, settled date — Saturday, July 18, 2026, the first day of the Marine Day three-day weekend — we lined up, by price band, the path of remaining rooms for the 69 hotels in Chuo Ward that had listed 30% or more of their total rooms on OTAs and similar channels (drawn from the 168 hotels with data among 551 monitored). In the band below ¥15,000, 14 of 24 hotels were sold out as of the day before, and 3 of those had been sold out 45 or more days ahead of the stay. In the bands at ¥15,000 and above, it was 2 of 17 hotels.
| Estimated settled ADR (12-month average) | Jul 18: hotels covered | Jul 18: sold out day before | Sep 19: hotels covered | Sep 19: sold out day before |
|---|---|---|---|---|
| Under ¥15,000 | 24 (3,168 rooms) | 14 | 22 (3,126 rooms) | 5 |
| ¥15,000–20,000 | 9 (2,105 rooms) | 1 | 12 (2,699 rooms) | 0 |
| ¥20,000–25,000 | 6 (1,477 rooms) | 0 | 7 (1,070 rooms) | 1 |
| ¥25,000 and above | 2 (387 rooms) | 1 | 3 (471 rooms) | 0 |
Source: MetroEngines Research & Consulting. Only hotels whose publicly listed allotment on OTAs and similar channels is 30% or more of total rooms are counted (Jul 18: 69 of 551 monitored hotels; Sep 19: 70). Hostels, guesthouses and others for which an estimated settled ADR cannot be calculated (28 for Jul 18, 26 for Sep 19) are excluded from the price-band rows
Estimated Settled ADR × Estimated Occupancy 7 Days Before the Stay (Stay of July 18, 2026)
Source: MetroEngines Research & Consulting (Chuo Ward; 41 hotels with 7,137 rooms that have a publicly listed allotment of 30% or more on OTAs and similar channels and a calculable estimated settled ADR; based on listings on major booking sites)
What must not be misread here is that in the band at ¥25,000 and above, only 2 or 3 hotels list 30% or more of their total rooms on OTAs and similar channels. Upper-tier hotels may be selling mainly through their own websites, travel agencies and corporate contracts; they may be releasing inventory to OTAs in small lots as check-in approaches; or they may have contracted only a small OTA allotment in the first place. Publicly available OTA data alone cannot tell which applies. It therefore cannot be read as “the upper tier is not selling”. What can be said is that the upper tier is thin in the number of hotels itself, and thin in the inventory observable on OTAs and similar channels.
We also check how bookings build across the area as a whole. Estimated occupancy for all of Chuo Ward (98–107 hotels with 14,430–15,161 rooms, based on listings on major booking sites) moved from 85.0% at LT45 to 97.3% at LT1 for the July 18 stay, from 66.1% to 88.4% for August 15 (Obon), and from 79.4% to 91.6% for Saturday, September 19 (the first day of the Silver Week holidays). By segment, city hotels on July 18 (14 hotels with 4,118 rooms) had already reached 91.3% at LT45, ahead of the 82.4% for business hotels (60 hotels with 9,155 rooms). On peak dates, the tendency for higher-rate segments to fill earlier shows up clearly.
Chuo Ward, Sapporo: Booking Curve of Estimated Occupancy (LT45 to LT1)
Source: MetroEngines Research & Consulting (all hotels in Chuo Ward. Jul 18: 98 hotels with 14,430 rooms; Aug 15: 102 with 14,856; Sep 19: 107 with 15,161; based on listings on major booking sites). Estimates based on the take-up of inventory sold on OTAs; they differ from hotels’ actual overall occupancy
Do F&B and Spa Lift Rates? — The Rate Premium Seen in 143,163 Reviews
We use guest reviews to test whether F&B and spa lift the room rate itself. Of the 137 hotels within 1.5 km, for the 135 with 50 or more reviews in the most recent 24 months (143,163 in total), we counted how many favorable mentions per 100 reviews there were of breakfast, dinner, drinks and lunch, and of bathing facilities such as large communal baths, open-air baths, saunas and spas. For each, the top third (45 hotels) is treated as the “rated group”, and its median estimated settled ADR is compared with that of the other hotels.
| Comparison | Rated group | Median rate, rated group | Others | Median rate, others | Gap |
|---|---|---|---|---|---|
| F&B-rated group (10.9 or more mentions per 100 reviews) | 45 hotels | ¥16,372 | 90 hotels | ¥14,163 | +15.6% |
| of which business hotels | 32 hotels | ¥14,994 | 71 hotels | ¥13,906 | +7.8% |
| of which city hotels | 12 hotels | ¥22,470 | 17 hotels | ¥19,408 | +15.8% |
| Bath/spa-rated group (27.3 or more mentions per 100 reviews) | 45 hotels | ¥15,894 | 90 hotels | ¥14,163 | +12.2% |
| of which business hotels | 33 hotels | ¥15,539 | 70 hotels | ¥13,798 | +12.6% |
| of which city hotels | 10 hotels | ¥20,065 | 19 hotels | ¥19,408 | +3.4% |
| Rated group on both F&B and bath/spa | 13 hotels | ¥18,359 | 122 hotels | ¥14,567 | +26.0% |
Source: HotelBank Editorial Team research (NLP analysis); MetroEngines Research & Consulting. 143,163 guest reviews from the most recent 24 months across 135 hotels; estimated settled ADR is the 12-month average for September 2025–August 2026
Median Estimated Settled ADR by Review-Rated Group
Source: HotelBank Editorial Team research (NLP analysis); MetroEngines Research & Consulting (N=135 hotels, 143,163 reviews)
The 13 hotels where both F&B and bath/spa are frequently mentioned are mid-sized, with a median of 177 rooms, and their median rate is 26.0% higher than the rest. The gap remains when split by segment, and each factor works best in a different segment: the F&B rating shows +15.8% for city hotels, and the bath/spa rating +12.6% for business hotels. This is a correlation; it does not show that adding F&B or a spa will cause rates to rise by this much. Differences in location, building age and brand are also included. Even so, the relationship in which hotels whose non-room experiences get talked about command higher rates points in the same direction as the TRUNK design philosophy.
Simplified GOP Estimate for 107 Rooms — ¥2.54 Billion Revenue and ¥690 Million GOP at a 50% Rooms Share
On that basis we set out a simplified GOP estimate for 107 rooms. GOP (gross operating profit) is total revenue less the departmental expenses of rooms, F&B and spa and undistributed expenses such as administration and sales & marketing; it refers to the stage before deducting operator fees, rent, property tax and the like. Rooms revenue is calculated as 107 rooms × 365 days × OCC × ADR, and F&B and spa revenue are backed out from three settings of the share of rooms revenue in total revenue (the rooms revenue share). Departmental profit margins are set at 72% for rooms, 25% for F&B and 35% for spa, and undistributed expenses such as administration, sales & marketing and utilities at 22% of base-case total revenue (about ¥560 million). All of these are assumptions set by this article as general rules of thumb for a full-service hotel; they are not TRUNK’s planning figures.
| Item | A. Rooms-led | B. Balanced (base) | C. F&B-led |
|---|---|---|---|
| Revenue mix (rooms / F&B / spa) | 60 / 33 / 7 | 50 / 42 / 8 | 42 / 48 / 10 |
| Rooms revenue (ADR ¥45,100, full-year OCC 72%) | ¥1.27 billion | ¥1.27 billion | ¥1.27 billion |
| F&B revenue | ¥700 million | ¥1.07 billion | ¥1.45 billion |
| Spa revenue | ¥150 million | ¥200 million | ¥300 million |
| Total revenue | ¥2.11 billion | ¥2.54 billion | ¥3.02 billion |
| GOP | ¥670 million | ¥690 million | ¥720 million |
| GOP margin | 31.9% | 27.3% | 23.7% |
| GOP per room (annual) | ¥6.30 million | ¥6.47 million | ¥6.70 million |
Source: MetroEngines Research & Consulting estimate. Departmental profit margins and the undistributed expense ratio are this article’s assumptions (for A and C as well, undistributed expenses are 22% of each case’s total revenue)
Revenue and GOP by Revenue Mix (Rooms Revenue Fixed at ¥1.27 Billion; Unit: ¥100 Million)
Source: MetroEngines Research & Consulting estimate
Raising the non-room share of revenue lowers the GOP margin from 31.9% to 23.7%, but increases GOP in absolute terms from ¥670 million to ¥720 million. F&B has a low margin but builds up the absolute amount of revenue, so for a mid-sized hotel with a limited room count the structure becomes one of “giving up margin to take the amount”. The GOP margin level is lower than the 38.9% actually recorded across the 91 operating hotels disclosed by Invincible Investment Corporation (インヴィンシブル投資法人) (fiscal period ended December 2024; mostly accommodation-focused properties).
The larger factor is sensitivity to the room rate. Holding undistributed expenses at about ¥560 million and keeping the base-case revenue mix, we varied ADR and OCC.
| GOP (GOP margin) | Full-year OCC 65% | Full-year OCC 72% | Full-year OCC 80% |
|---|---|---|---|
| ADR ¥35,000 | ¥320 million (17.9%) | ¥410 million (21.0%) | ¥520 million (23.8%) |
| ADR ¥45,100 (base) | ¥570 million (24.9%) | ¥690 million (27.3%) | ¥830 million (29.5%) |
| ADR ¥55,000 | ¥820 million (29.3%) | ¥970 million (31.3%) | ¥1.14 billion (33.1%) |
Source: MetroEngines Research & Consulting estimate (revenue mix = rooms 50 / F&B 42 / spa 8; undistributed expenses fixed at about ¥560 million)
A ¥10,000 move in ADR moves GOP by ¥250–310 million (¥280 million at the base-case full-year OCC of 72%), about twice the effect of a 7–8 point difference in OCC (¥120–140 million at the base-case ADR of ¥45,100). In the review analysis above, the group of hotels where both F&B and bath/spa are talked about had rates 26.0% higher. The role of F&B and spa is not only to add non-room revenue but to push the room rate itself up into the next band, and it is the latter that contributes more to profitability.
Hotel or Office on the Upper Floors? — ¥690 Million GOP Equals Office Rent on 3,900–5,900 Tsubo
Finally, we compare uses of the floor space from the viewpoint of a mixed-use building owner. According to Miki Shoji, the average rent in the Sapporo business district as of August 2026 was ¥11,371 per tsubo (vacancy rate 4.76%); by sub-district, the Ekimae-dori and Odori Park area was ¥14,702, and the area south of Minami 1-jo, which includes the site, ¥9,785.
| Comparison | Rent south of Minami 1-jo (¥9,785/tsubo) | Rent around Odori Park (¥14,702/tsubo) |
|---|---|---|
| Office area equivalent to base-case GOP of ¥690 million | approx. 5,900 tsubo | approx. 3,900 tsubo |
| Area equivalent to GOP of ¥410 million at ADR ¥35,000 and full-year OCC 72% | approx. 3,500 tsubo | approx. 2,300 tsubo |
| Area equivalent to GOP of ¥970 million at ADR ¥55,000 and full-year OCC 72% | approx. 8,200 tsubo | approx. 5,500 tsubo |
Source: Miki Shoji, “Sapporo Office Rent Levels and Vacancy Rates” (August 2026); MetroEngines Research & Consulting estimate. Calculated as GOP / (rent per tsubo × 12 months)
The Sapporo Daibiru Building has a gross floor area of about 12,700 tsubo, and the hotel uses nine floors, 10 to 18, of the 19 above ground. The project outline Daibiru announced in October 2023 puts the gross floor area of the hotel portion at about 16,000 sqm (about 4,800 tsubo). Base-case GOP corresponds to about 80% of this area at the rent level around Odori Park, and to more than this area at the rent level south of Minami 1-jo.
There are, however, two caveats to this comparison. First, GOP is a figure before deducting the fees paid to the operator, the FF&E (furniture, fixtures and equipment) reserve, and property tax and insurance, so the owner’s take is smaller than this. Second, hotel floors require heavier capital investment than offices in plumbing, kitchens and spa facilities. Even so, if the rate moves up into the next band, the earning power of hotel floors can far exceed office rent. Offices can capture the conditions of the upper floors — views, quiet, a direct link to the underground mall — only as a rent differential, whereas a hotel can capture them as room rates and as F&B and spa prices. The case for turning upper floors into a hotel in Odori, where land prices keep rising, lies in this “difference in how location value is captured”. For the case of converting existing office floors to hotel use, we have separately estimated, city by city, a comparison that factors in change-of-use procedures and renovation costs; that analysis found the conversion viable in 2 of 5 cities.
Note on ADR for future dates: The estimated settled ADR for September–December 2026 in this article is an estimate based on sales prices published on OTAs at the time of the survey (September 27, 2026) and will change as the check-in date approaches. Please note that current prices may change through last-minute price cuts or increases. The simplified GOP estimate is an approximation based on assumptions; an actual investment decision requires a detailed feasibility study.
Conclusion — Going After the Mid-Sized × Upper-Tier Gap With F&B and Spa
Estimated settled ADR in Sapporo’s Chuo Ward averaged ¥14,400 over 12 months, up 11.1% from a year earlier, but the seasonal swing is large, with a 2.4x gap between February and April. Of the 137 hotels and 27,046 rooms within 1.5 km of Minami 2-jo Nishi 4-chome, only two large properties average above ¥30,000 over 12 months, and no mid-sized hotel of 50–250 rooms exceeds ¥30,000. TRUNK(HOTEL) SAPPORO, with 107 rooms and a 17% suite ratio, is planned to enter this empty band.
Across 143,163 reviews, the 13 hotels where both F&B and bath/spa are talked about had a median rate 26.0% higher than the rest. In the simplified estimate, the lower the rooms revenue share, the lower the GOP margin but the higher the GOP amount, and a ¥10,000 difference in ADR has about twice the effect of a 7–8 point difference in OCC. The 169,000 workers within 1 km and the 75,000 residents within 1.5 km form the base that supports F&B and spa in the off-season months. For developers considering lifestyle hotels and for owners of mixed-use buildings, Odori is one of the few catchments where the model of “raising the ceiling on room rates through F&B and spa” can be tested.
Related Reading
References and Sources
■ Data sources
Chuo Ward estimated settled ADR is monthly for September 2024–December 2026 (from September 2026 onward, estimates based on listed rate levels at the time of the survey). The 1.5 km positioning covers the 137 hotels with 27,046 rooms, among business, city, resort, ryokan and deluxe segment properties within a 1.5 km radius of Minami 2-jo Nishi 4-chome (43.057735 degrees north, 141.351959 degrees east), for which an estimated settled ADR could be calculated in at least 10 of the 12 months from September 2025 to August 2026. Inventory data are final values for stays on July 18, August 15 and September 19, 2026, and hotel-level tabulations are limited to hotels whose publicly listed allotment on OTAs and similar channels is 30% or more of total rooms. Reviews are guest reviews from the most recent 24 months analyzed by NLP; hotels were split into thirds by the number of favorable mentions divided by the number of reviews.
■ Estimate assumptions
Rooms revenue in the simplified GOP estimate is calculated as 107 rooms × 365 days × full-year OCC × ADR. The base case is ADR ¥45,100 (weighted average of ¥35,000 for standard rooms and ¥95,000 for suites, tax-exclusive equivalent), full-year OCC 72% and a rooms revenue share of 50%. Departmental profit margins are 72% for rooms, 25% for F&B and 35% for spa; undistributed expenses are 22% of each case’s total revenue (about ¥560 million in the base case, held at this amount in the ADR × OCC sensitivity table). All are assumptions set by this article as general rules of thumb for a full-service hotel and are not TRUNK’s planning figures. The office conversion is GOP / (rent per tsubo × 12 months).
■ Limitations and caveats
Estimated settled ADR and estimated occupancy are estimates from prices and inventory published on OTAs and similar channels and differ from each hotel’s actual results and accounting figures. Many upper-tier hotels have a small publicly listed OTA allotment, so the price-band comparison of inventory take-up rests on few hotels. The relationship between reviews and rates is a correlation and does not show causation (it includes differences in location, building age and brand). GOP is a figure before deducting operator fees, the FF&E reserve, property tax and insurance; it is not the owner’s take or an investment yield. The hotel floor area in the office comparison uses the hotel-portion gross floor area of about 16,000 sqm (about 4,800 tsubo) from the project outline Daibiru announced in October 2023.
■ Market data
- MetroEngines Research & Consulting — estimated settled ADR (Chuo Ward: 130–139 hotels per month; 1.5 km radius: N=137 hotels), booking curves and estimated occupancy (Chuo Ward: 98–107 hotels, based on listings on major booking sites), hotel-level inventory paths (publicly listed allotment of 30% or more on OTAs and similar channels: 69–70 hotels)
- HotelBank Editorial Team research (NLP analysis) — 143,163 guest reviews across 135 hotels (most recent 24 months)
■ Government statistics and public data
- MLIT Real Estate Information Library — official land prices (2024–2026) and zoning
- Ministry of Internal Affairs and Communications and Ministry of Economy, Trade and Industry, “Economic Census for Business Activity (2021)” (boundaries = 2020 Population Census small areas)
- MLIT National Land Numerical Information (250 m mesh population projections, FY2024 National Spatial Planning and Regional Policy Bureau estimates)
■ REIT and industry data
- Invincible Investment Corporation, “Hotel Portfolio” (GOP margin of 38.9% across 91 operating properties, fiscal period ended December 2024)
- Relo Hotel Solutions, “What Is GOP?”
- Miki Shoji, “Sapporo Office Rent Levels and Vacancy Rates” (August 2026)
■ News and press releases