

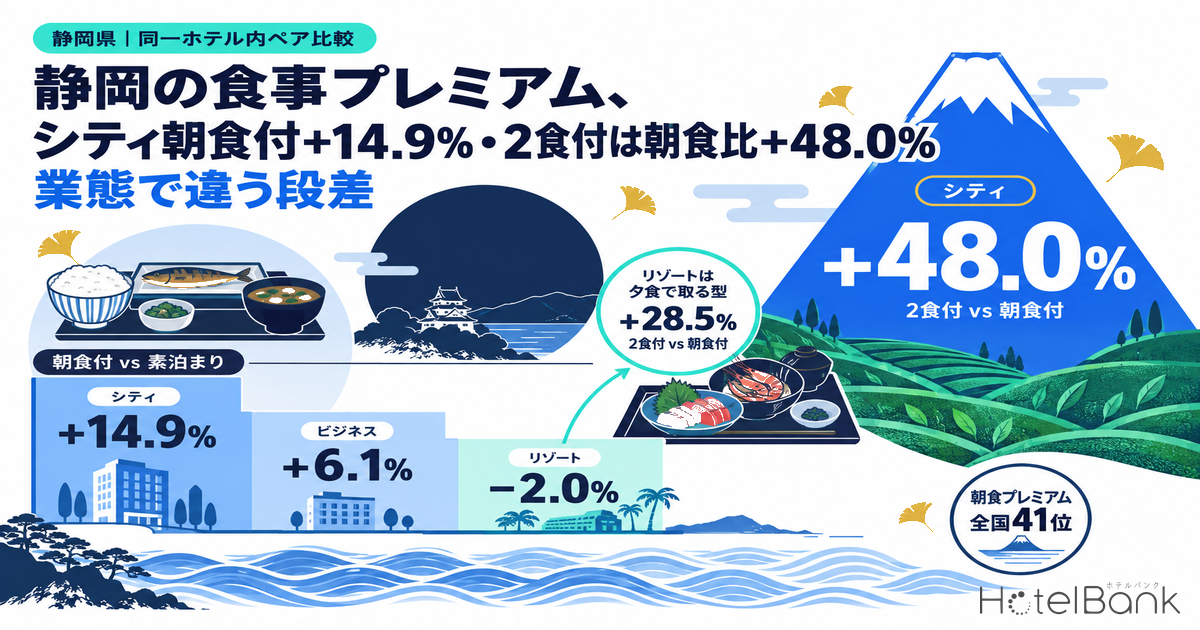
The “price step” between the meal-inclusive plans sold by hotels in Shizuoka Prefecture takes a very different shape depending on hotel type. Using a paired comparison — extracting only properties that sell both room-only and breakfast-included plans within the same hotel, and averaging the within-property difference — for September 2026 stays, City hotels sold breakfast-included plans at +14.9% above room-only (N=20 properties) and two-meal (dinner and breakfast) plans at +48.0% above breakfast-included (N=17). By contrast, the breakfast premium at business hotels was only +6.1% (N=132), and at resort hotels the gap between breakfast-included and room-only was -2.0% (N=39), leaving almost no visible step. This article lays out Shizuoka’s meal premiums by hotel type and by municipality, places Shizuoka among Japan’s 47 prefectures, overlays the context of estimated settled ADR and estimated OCC, and offers a yardstick for designing meal-inclusive plans for autumn and winter.
Scope: City hotels, business hotels and resort hotels in Shizuoka Prefecture (ryokan excluded). Meal premiums are paired comparisons limited to properties that sell both meal types within the same hotel; N= is the number of properties where a pair exists (City N=17-20, business N=13-132, resort N=12-39). The price-level metric in this article is estimated settled ADR (the transacted price level estimated from OTA and other sales data, tax-exclusive equivalent), and occupancy is an estimate based on OTA-listed inventory. Both are defined at the end of the article. Data as of October 4, 2026.
- — City hotels earn on both breakfast and dinner: breakfast-included is +14.9% above room-only (N=20) and two-meal is +48.0% above breakfast-included (N=17) (September 2026 stays, within-hotel paired comparison).
- — The business hotel breakfast step is +6.1% (N=132): the difference is +¥912, staying within a band of around ¥1,000 from May through September.
- — Resorts earn it on dinner: breakfast-included vs room-only is -2.0% (N=39), almost no step, while two-meal is +28.5% above breakfast-included (N=37).
- — Wide gaps within the prefecture: the business hotel breakfast premium is +18.5% in Aoi Ward, Shizuoka City (N=11) and +17.6% in Numazu (N=12), versus -11.0% in Yaizu (N=5).
- — 41st of 47 prefectures nationally: the all-types-combined figure of +5.6% (N=219) is 3.6pt below the prefecture median of +9.2%, and business hotels rank 42nd (median +10.3%).
Premise of the Analysis — Only Within-Hotel Paired Comparisons Are Used
The first thing to pin down is how the meal premium is measured. Simply comparing the average breakfast-included plan with the average room-only plan across all hotels mixes in the difference in price band between properties that sell breakfast-included plans and properties that sell room-only in the first place, so what you end up seeing is the difference in “the price of the property” rather than “the price of the meal.” This article therefore takes only hotels that sell both room-only and breakfast-included (or both breakfast-included and two-meal) plans themselves under the same stay month and the same number of guests, and averages the difference within each property. The figure shown as N= is the number of properties where such a pair exists, and combinations with N below 5 are not cited. Ryokan are excluded from the analysis because their rate structure assumes meals are included, which makes a comparison against room-only hard to establish.
The value obtained this way is close to “the amount that property’s guests pay on top for the meal,” and is easy to use as a yardstick for checking your own plan steps against the market. Below we focus on September 2026 stays and also show October stays (values based on current sales status) alongside.
Price Steps by Hotel Type — City Hotels Take 15% on Breakfast, Business Hotels 6%, Resorts Earn It on Two-Meal Plans
Lining up meal premiums by hotel type shows that the way steps are set falls into three patterns. City hotels priced breakfast-included at +14.9% above room-only (a difference of +¥4,450, N=20), and two-meal plans at +68.3% above room-only (+¥22,099, N=17) and +48.0% above breakfast-included (+¥17,660, N=17) — a pattern that takes a clear markup on both breakfast and dinner. Business hotels, by contrast, showed a small +6.1% for breakfast-included (+¥912, N=132), and even two-meal plans were only +25.8% above room-only (+¥3,928, N=48) and +20.4% above breakfast-included (+¥3,240, N=51). The design reads as positioning breakfast as an “inexpensive add-on,” prioritizing how easily it gets chosen over the price difference.
Resort hotels look different. The gap between breakfast-included and room-only was -2.0% (-¥800, N=39), so on paper breakfast-included is slightly cheaper. This does not mean breakfast is free, however. It is thought to include the effect of differences in plan composition — the room types sold room-only and the room types sold with breakfast do not line up within the same property (for example, room-only skews toward last-minute sales of higher-grade rooms) — and an inversion cannot be asserted. Two-meal plans, meanwhile, were +28.5% above breakfast-included (+¥11,711, N=37) and +23.6% above room-only (+¥10,102, N=36), so the dinner step is clearly captured. The resort meal premium can be described as a pattern of “earning it on dinner, not breakfast.”
| Hotel type | Pair compared | Sep difference | Sep premium | N= (Sep) | Oct premium (estimate) |
|---|---|---|---|---|---|
| City | Breakfast vs room-only | +¥4,450 | +14.9% | 20 | +14.5% (N=20) |
| City | Two-meal vs breakfast | +¥17,660 | +48.0% | 17 | +48.9% (N=17) |
| City | Two-meal vs room-only | +¥22,099 | +68.3% | 17 | +68.7% (N=17) |
| Business | Breakfast vs room-only | +¥912 | +6.1% | 132 | +5.7% (N=128) |
| Business | Two-meal vs breakfast | +¥3,240 | +20.4% | 51 | +20.7% (N=51) |
| Business | Two-meal vs room-only | +¥3,928 | +25.8% | 48 | +26.7% (N=47) |
| Business | Dinner-only vs room-only | +¥5,545 | +45.4% | 13 | +47.5% (N=13) |
| Resort | Breakfast vs room-only | -¥800 | -2.0% | 39 | +0.3% (N=40) |
| Resort | Two-meal vs breakfast | +¥11,711 | +28.5% | 37 | +29.3% (N=37) |
| Resort | Two-meal vs room-only | +¥10,102 | +23.6% | 36 | +28.8% (N=37) |
| Resort | Dinner-only vs room-only | +¥7,487 | +21.6% | 12 | +23.1% (N=14) |
Shizuoka Prefecture, September 2026 stays (October is an estimate based on current sales status). Within-hotel paired comparison, ryokan excluded. Source: MetroEngines Research; compiled by the HotelBank Editorial Team
Shizuoka Prefecture, September 2026 stays, within-hotel paired comparison (N= is the number of properties where a pair exists). Source: MetroEngines Research; compiled by the HotelBank Editorial Team
Looking across the three hotel types, the breakfast markup steps down like a staircase — “City 15%, business 6%, resort almost zero” — while the markup for two-meal plans, which include dinner, changes order to “City 48%, resort 29%, business 20%” (all relative to breakfast-included). The fact that the hotel types that can earn on breakfast differ from those that can earn on dinner is the first defining feature of Shizuoka’s meal premiums.
Breakfast Premium Trend — City Hotels Widened from 8.2% in May to 14.9% in September
Next, tracking the gap between breakfast-included and room-only month by month from May to October 2026 makes the differences in movement by hotel type even clearer. The City hotel breakfast premium was +8.2% in May (N=21), +9.3% in June (N=21), +11.8% in July (N=21), +13.0% in August (N=21) and +14.9% in September (N=20), widening every month from May through September, and it remains elevated at +14.5% in October (N=20, an estimate based on current sales status). A step that was below 10% in early spring had opened up to nearly 15% heading into autumn.
Business hotels moved the other way, narrowing from +7.8% in May (N=125) to +6.9% in June, +5.8% in July and +5.3% in August, then running at +6.1% in September (N=132) and +5.7% in October (N=128). On a yen basis too, the difference fell from +¥1,122 in May to +¥824 in August and then recovered only slightly to +¥912 in September, so the breakfast markup stays within a band of roughly ¥1,000. Resort hotels remained in negative territory at -4.6% in May (N=36), -2.2% in June, -3.1% in July, -0.4% in August and -2.0% in September (N=39), finally surfacing to around zero at +0.3% in October (N=40). For the prefecture as a whole (all hotel types combined) the premium widened gradually from +2.9% in May (N=206) to +6.4% in October (N=212), but the underlying picture can be read as City hotel expansion driving the move, with the narrowing at business hotels and the flat trend at resorts offsetting one another.
Shizuoka Prefecture, breakfast-included vs room-only premium (%), May-October 2026 stays (October is an estimate based on current sales status). N= is 20-21 for City, 125-132 for business and 36-40 for resort. Source: MetroEngines Research; compiled by the HotelBank Editorial Team
What this trend points to is the possibility that the City hotel breakfast premium is treated not as a “fixed breakfast charge” but as a variable element that moves with demand periods. The difference opened up about 1.8x, from +¥2,454 in May to +¥4,450 in September, which means that in a phase where room-only prices were rising, breakfast-included prices were raised by even more. This stands in contrast to business hotels, where the breakfast difference is stable at around ¥1,000, and the difference between pricing breakfast as a “product” and fixing it as an “add-on” shows up in the monthly movement.
By Municipality — Numazu and Aoi Ward (Shizuoka City) Around 18%, Hamamatsu and Yaizu Almost No Step
Within the prefecture, too, the level of the breakfast premium differs widely by city. Lining up the cities and wards where at least N=5 pairs existed among business hotels for September 2026 stays, Aoi Ward, Shizuoka City at +18.5% (+¥2,744, N=11) and Numazu at +17.6% (+¥2,636, N=12) were the highest, followed above 10% by Gotemba at +13.9% (N=7), Mishima at +13.3% (N=5) and Fuji at +11.1% (N=10). On the other hand, Naka Ward, Hamamatsu (classified by the former ward name) was -0.6% (N=17), Suruga Ward, Shizuoka City -3.1% (N=8) and Yaizu -11.0% (N=5), all negative, which means they include pairs where breakfast-included is sold for less. The prefectural average of +6.1% (N=132) can be described as the result of mixing these “high steps in the east and the prefectural capital” with “no step in the west and along the coast.”
Shizuoka Prefecture, business hotels, breakfast-included vs room-only premium (%), September 2026 stays, only cities and wards with N=5 or more pairs. Source: MetroEngines Research; compiled by the HotelBank Editorial Team
| City / ward | Hotel type | Difference | Premium | N= |
|---|---|---|---|---|
| Aoi Ward, Shizuoka City | Business | +¥2,744 | +18.5% | 11 |
| Numazu | Business | +¥2,636 | +17.6% | 12 |
| Naka Ward, Hamamatsu (former ward name) | City | +¥3,796 | +16.3% | 5 |
| Atami | Resort | +¥6,033 | +14.6% | 9 |
| Gotemba | Business | +¥2,236 | +13.9% | 7 |
| Mishima | Business | +¥2,340 | +13.3% | 5 |
| Fuji | Business | +¥1,466 | +11.1% | 10 |
| Kakegawa | Business | +¥970 | +7.3% | 10 |
| Fujieda | Business | +¥710 | +5.9% | 5 |
| Shimada | Business | +¥650 | +4.8% | 8 |
| Shimizu Ward, Shizuoka City | Business | +¥510 | +3.1% | 8 |
| Naka Ward, Hamamatsu (former ward name) | Business | -¥80 | -0.6% | 17 |
| Suruga Ward, Shizuoka City | Business | -¥519 | -3.1% | 8 |
| Ito | Resort | -¥1,761 | -3.8% | 14 |
| Yaizu | Business | -¥1,485 | -11.0% | 5 |
Shizuoka Prefecture, breakfast-included vs room-only, September 2026 stays, within-hotel paired comparison (only city/ward and hotel type combinations with N=5 or more pairs, ryokan excluded). Source: MetroEngines Research; compiled by the HotelBank Editorial Team
A gap also shows up between the two major resort areas. Atami’s breakfast premium is +14.6% (+¥6,033, N=9), captured at a level on par with City hotels, whereas Ito is negative at -3.8% (-¥1,761, N=14), and it is the Ito side that pulls down the prefectural resort average of -2.0%. It is possible that in Atami breakfast-included functions as a clear upper-tier plan while in Ito room-only is used to sell higher-grade rooms, suggesting that even within the same Izu area the design thinking behind plan composition differs. Among City hotels, the only city or ward where pairs existed was Naka Ward, Hamamatsu (former ward name), at +16.3% (+¥3,796, N=5), a level close to the prefectural City average of +14.9%.
Shizuoka in the National Picture — Breakfast Premium Ranks 41st of 47 Prefectures
Comparing Shizuoka’s step with the rest of Japan makes its position even clearer. Ranking the 47 prefectures by breakfast-included vs room-only premium for September 2026 stays (N=5 or more pairs), for all hotel types combined (which includes hotel types other than City, business and resort) Shizuoka was 41st at +5.6% (N=219), 3.6pt below the 47-prefecture median of +9.2%. At the top were Kyoto at +16.9% (N=113), Osaka at +15.1% (N=244) and Nara at +14.5% (N=26) — the Kansai region, where tourism demand is strong — while Tokyo was 8th at +13.4% (N=455).
By hotel type, Shizuoka’s business hotels ranked 42nd of 47 prefectures at +6.1% (median +10.3%), and its resort hotels ranked 18th of the 23 prefectures with N=5 or more at -2.0% (median +4.1%), both in the lower tier nationally. City hotels, on the other hand, ranked 26th of 44 prefectures at +14.9% (median +15.7%), almost exactly in the middle of the national field. In other words, Shizuoka’s breakfast premium is low by national standards not because the City hotel step is small, but because the step at business hotels, which account for a large number of properties, is about 4pt thinner than the national level and the resort step has all but disappeared.
| Hotel type | Shizuoka (N=) | National rank | Prefecture median | Examples at the top |
|---|---|---|---|---|
| All types combined | +5.6% (219) | 41st / 47 | +9.2% | Kyoto +16.9% (N=113), Osaka +15.1% (N=244) |
| Business hotels | +6.1% (132) | 42nd / 47 | +10.3% | Nara +23.9% (N=14), Kyoto +18.5% (N=71) |
| City hotels | +14.9% (20) | 26th / 44 | +15.7% | Hyogo +20.7% (N=37), Kyoto +18.4% (N=29) |
| Resort hotels | -2.0% (39) | 18th / 23 | +4.1% | Okinawa +9.1% (N=87), Hokkaido +8.5% (N=50) |
Breakfast-included vs room-only premium, September 2026 stays, within-hotel paired comparison (only prefectures with N=5 or more pairs are ranked, ryokan excluded). Source: MetroEngines Research; compiled by the HotelBank Editorial Team
Market Price and Occupancy Context — Estimated Settled ADR Flat YoY, September Estimated OCC in the 80% Range
As a premise for designing meal premiums, it is also worth confirming where room prices and occupancy currently stand in Shizuoka Prefecture. Comparing estimated settled ADR (tax-exclusive equivalent) year on year between finalized months, City hotels were at ¥12,741 in June 2026 (N=30) against ¥12,708 in the same month a year earlier (N=31), or +0.3%; ¥13,252 in July against ¥13,341, or -0.7%; and ¥13,522 in August (N=31) against ¥17,333 (N=31), or -22.0%. The large August decline is a reaction to the exceptionally high level in August of the previous year, and taken together with the flat June-July readings, City hotel room rates can be read as running broadly at last year’s level. Business hotels were at ¥6,589 in June (N=221) against ¥6,608 a year earlier (N=218), or -0.3%; ¥7,324 in July against ¥7,151, or +2.4%; and ¥7,854 in August (N=221) against ¥7,886 (N=219), or -0.4%, staying within +/-3% YoY in all three months.
| Hotel type | Month | 2025 (final) | 2026 (final) | YoY | N= (2026) |
|---|---|---|---|---|---|
| City | June | ¥12,708 | ¥12,741 | +0.3% | 30 |
| City | July | ¥13,341 | ¥13,252 | -0.7% | 30 |
| City | August | ¥17,333 | ¥13,522 | -22.0% | 31 |
| Business | June | ¥6,608 | ¥6,589 | -0.3% | 221 |
| Business | July | ¥7,151 | ¥7,324 | +2.4% | 221 |
| Business | August | ¥7,886 | ¥7,854 | -0.4% | 221 |
Shizuoka Prefecture, estimated settled ADR (tax-exclusive equivalent, area median), YoY between finalized months. N= for 2025 is 31 for City and 218-219 for business. Source: MetroEngines Research; compiled by the HotelBank Editorial Team
Estimated settled ADR for September and October is still an estimate based on current sales status: City hotels at ¥16,054 for September and ¥16,449 for October (N=31), and business hotels at ¥8,974 for September and ¥9,366 for October (N=220). These come out higher than the finalized months, but they reflect price levels partway through the sales period, and a simple comparison with final values has to wait until the figures are finalized at month-end. On the occupancy side, the monthly average of estimated OCC (OTA-listed inventory basis) for September 2026 was 85.5% for business hotels (117-126 properties and 12,460-13,292 rooms in scope), 83.2% for City hotels (19-21 properties and 2,011-2,217 rooms in scope) and 83.1% for resort hotels (108-115 properties and 6,004-6,449 rooms in scope), with all three hotel types running in the 80% range. If the breakfast step is becoming fixed by hotel type while rooms are selling steadily, one could also take the view that some hotel types still have room to build rate on the meal-plan side.
For Revenue Managers Running City, Business and Resort Hotels in Shizuoka — Implications and Action Plan
1. Check your own breakfast step against the market value for your hotel type. The yardstick in this article is “City +14.9%, business +6.1%, resort -2.0%” (September 2026, within-hotel paired comparison). Compare the price difference between your own breakfast-included and room-only plans with these values: if you are well below the average for your hotel type, there is room to re-price breakfast as a “product,” and if you are above it, check whether the take-up rate of breakfast-included plans is falling. Among business hotels, the markets that exceed the prefectural average — Aoi Ward, Shizuoka City at +18.5% and Numazu at +17.6% — can be referenced as examples where a breakfast markup is being accepted.
2. Decide whether to move the breakfast step by season. Shizuoka’s City hotels widened the breakfast premium from +8.2% in May to +14.9% in September, showing an operating practice of raising breakfast-included prices by more than room-only prices while the latter are rising. Business hotels keep the difference fixed at around ¥1,000. If your property is the “fixed add-on” type, there is room to test a switch to a variable type that widens the step only in demand periods; conversely, if you are the variable type, consider a design that narrows the step in the off-season to protect the take-up rate of breakfast-included plans.
3. For resorts, build on the premise that the money is in dinner, not breakfast. The prefecture’s resort hotels show almost no step between breakfast-included and room-only at -2.0%, while two-meal vs breakfast-included is clearly captured at +28.5% (N=37). Where pairs in which breakfast-included looks cheaper than room-only are included, the cause is often a mismatch in plan composition, such as using room-only for last-minute sales of higher-grade rooms. Take stock of which room types your room-only and breakfast-included plans are tied to, and confirm that no unintended inversion is occurring.
4. A step that is thin by national standards can also be read as room to raise prices. The breakfast premium at Shizuoka’s business hotels is +6.1% against a national median of +10.3%, ranking 42nd. In an environment where estimated settled ADR is running flat year on year and September estimated OCC is in the 80% range, moving the breakfast-included plan step closer to the national median may allow you to build rate without hurting how easily the plan gets chosen, rather than forcing room rates higher.
| Time frame | Action | Decision trigger (figures from this article) | Aim |
|---|---|---|---|
| Today to this week | Line up your own price differences across room-only, breakfast-included and two-meal plans against the market values for your hotel type | Your breakfast step is clearly below City +14.9% / business +6.1%, or your two-meal step is far off City +48.0% / business +20.4% / resort +28.5% | Make the step misalignment visible and identify the plans that are candidates for revision |
| Today to this week | Take stock of the room types tied to your room-only and breakfast-included plans | There are days when your breakfast-included plan looks cheaper than room-only (the same pattern as the prefectural resort figure of -2.0% and Ito at -3.8%) | Remove unintended inversions and make breakfast-included function as the upper-tier plan |
| Within 2 weeks | Set up a test allocation that widens the breakfast step only on demand dates in October-November | Your breakfast difference is almost fixed year-round, with no seasonal variation like the City hotels’ move from +¥2,454 in May to +¥4,450 in September | Test on a small scale whether rate can be built on the meal side in demand periods |
| Within 2 weeks | For resort and City hotels, review the two-meal step relative to breakfast-included | Your two-meal vs breakfast-included figure is well below resort +28.5% / City +48.0% | Make use of the earn-it-on-dinner structure and supplement RevPAR without relying on room rates |
| Toward next month | Record the relationship between breakfast-included take-up and the step monthly, and look for the upper limit of the step | Whether the take-up rate of breakfast-included plans holds when a business hotel moves its step closer to the national median of +10.3% | Hold, in your own data, the balance point between widening the step and maintaining take-up |
| Toward next month | Once final September estimated settled ADR is available, re-check the allocation between room rate and meal step | Post-finalization YoY for City and business hotels stays flat (within +/-3%), as in June-August | Back up the decision to build rate on the meal side in a phase where room rates are flat |
All decision-trigger figures are values compiled in this article (Shizuoka Prefecture, September 2026 stays, within-hotel paired comparison). Source: MetroEngines Research; compiled by the HotelBank Editorial Team
Summary — Three Yardsticks for Reading Shizuoka’s Meal Premiums
First, the shape of the step differs by hotel type. The breakfast markup steps down from City +14.9% to business +6.1% to resort -2.0%, while the two-meal markup (relative to breakfast-included) changes order to City +48.0%, resort +28.5%, business +20.4%. Hotel types that earn on breakfast and hotel types that earn on dinner need to be designed as different things.
Second, the breakfast step can be moved. The City hotel breakfast premium widened every month from May through September, from +8.2% in May to +14.9% in September, and the difference opened up about 1.8x. This contrasts with business hotels, where the difference is fixed at around ¥1,000, and shows that whether to treat breakfast as a variable element or as a fixed add-on is a choice made by the operator.
Third, Shizuoka’s step is thin by national standards. The all-types-combined breakfast premium of +5.6% ranks 41st of 47 prefectures and business hotels rank 42nd at +6.1%; given an environment in which estimated settled ADR is flat year on year and September estimated OCC is in the 80% range, it can be said that some hotel types still have room to build rate on the meal-plan step rather than on room rates. The fact that there are markets within the prefecture where a step of around +18% holds, such as Aoi Ward in Shizuoka City and Numazu, offers a clue when thinking about that room.
Frequently Asked Questions
Q. What is the meal premium?
A. It is the average within-property difference, in yen and in percent, taken only from properties that sell both of two meal types (for example, room-only and breakfast-included) within the same hotel under the same stay month and the same number of guests. N= is the number of properties where a pair exists, and ryokan are excluded from the analysis.
Q. How much does the breakfast premium in Shizuoka Prefecture differ by hotel type?
A. For September 2026 stays, it was +14.9% for City hotels (+¥4,450, N=20), +6.1% for business hotels (+¥912, N=132) and -2.0% for resort hotels (-¥800, N=39).
Q. Why does breakfast-included come out cheaper than room-only at resort hotels?
A. It does not mean breakfast is free. It is thought to include the effect of differences in plan composition, where the room types sold room-only and the room types sold with breakfast do not line up within the same property, and an inversion cannot be asserted. Two-meal plans are +28.5% above breakfast-included (N=37), so the dinner step is being captured.
Q. Where does Shizuoka Prefecture’s breakfast premium stand nationally?
A. For September 2026 stays (prefectures with N=5 or more pairs), the all-types-combined figure of +5.6% (N=219) ranks 41st of 47 prefectures, 3.6pt below the prefecture median of +9.2%. By hotel type, business hotels rank 42nd / 47, City hotels 26th / 44 and resort hotels 18th / 23.
About the Data
| Item | Definition and notes |
|---|---|
| Meal premium | The average within-property difference, in yen and in percent, taken only from properties that sell both of the two meal types being compared (for example, room-only and breakfast-included) within the same hotel under the same stay month and the same number of guests. N= is the number of properties where a pair exists, and combinations with N below 5 are not cited. Ryokan are excluded. Hotel types are City hotels, business hotels and resort hotels. September 2026 stays are observed values; October stays are estimates based on current sales status and may change. |
| Estimated OCC | Occupancy on an OTA-listed inventory basis = 100 – 100 x OTA-listed rooms remaining / total rooms. Covers properties that list 30% or more of their total rooms on OTAs (the number of properties in scope varies by stay date, so it is shown as a range in the text). It is an estimate based on the sell-through of inventory sold on OTAs and differs in definition from actual room occupancy (it comes out higher because rooms not listed are counted as sold). The month covered is September 2026 (Shizuoka Prefecture: 117-126 business hotels / 19-21 City hotels / 108-115 resort hotels, based on listings on major booking sites). |
| Booking curve | Based on observations from 45 days before the stay date up to the most recent date. |
| Estimated settled ADR | The transacted price level (tax-exclusive equivalent) estimated from OTA and other sales data (lowest-plan level x coefficient by hotel type, an ensemble across multiple channels). Past months are final values; current and future months are estimates based on current sales status. The median error is 6.6% when checked against published operating results. This article uses the area median for Shizuoka Prefecture’s City hotels (N=30-31) and business hotels (N=218-221). YoY is calculated between finalized months only. |
| Breakdown of N= | Meal premium (September 2026): City N=17-20, business N=13-132, resort N=12-39, all types combined N=36-219 (this includes hotel types other than the three, so it does not equal the sum of the three types’ N=). The municipality view covers 15 segments with N=5 or more pairs. The national comparison covers prefectures with N=5 or more pairs (47 for all types combined, 47 for business, 44 for City, 23 for resort). |
| Data date | Data as of October 4, 2026. Sales status and inventory change daily, so the figures in this article are a snapshot at the time of retrieval. |
Source: MetroEngines Research; compiled by the HotelBank Editorial Team
References and Sources
■ Data sources
OTA-listed plan, price and inventory data collected and compiled by MetroEngines Research (City hotels, business hotels and resort hotels in Shizuoka Prefecture; ryokan excluded). Meal premiums cover May-October 2026 stays; estimated settled ADR covers June-August of 2025 and 2026 (finalized months) and September-October 2026 (estimates); estimated OCC covers September 2026 stays. Data as of October 4, 2026.
■ Estimation assumptions
Meal premiums average the within-property difference, in yen and in percent, only for properties that sell the two meal types being compared within the same hotel under the same stay month and the same number of guests. N= is the number of properties where a pair exists, and combinations with N below 5 are not cited. National rankings cover only prefectures with N=5 or more pairs. YoY for estimated settled ADR is calculated only between finalized months.
■ Limitations and caveats
The paired comparison is a value limited to properties that sell both meal types and does not indicate the absolute price level of the market as a whole. The negative breakfast-included vs room-only figure for resort hotels includes the effect of differences in plan composition, and an inversion cannot be asserted. City and ward figures rest on small samples of N=5-17 and move easily when the properties in scope change. The meal premium for October stays and estimated settled ADR for September-October are estimates based on current sales status and may change. Estimated OCC is an estimate on an OTA-listed inventory basis and differs in definition from actual room occupancy.
■ Market data
MetroEngines Research, “Compiled data on OTA-listed plans, prices and inventory” (meal premium, estimated settled ADR, estimated OCC); compiled by the HotelBank Editorial Team.