

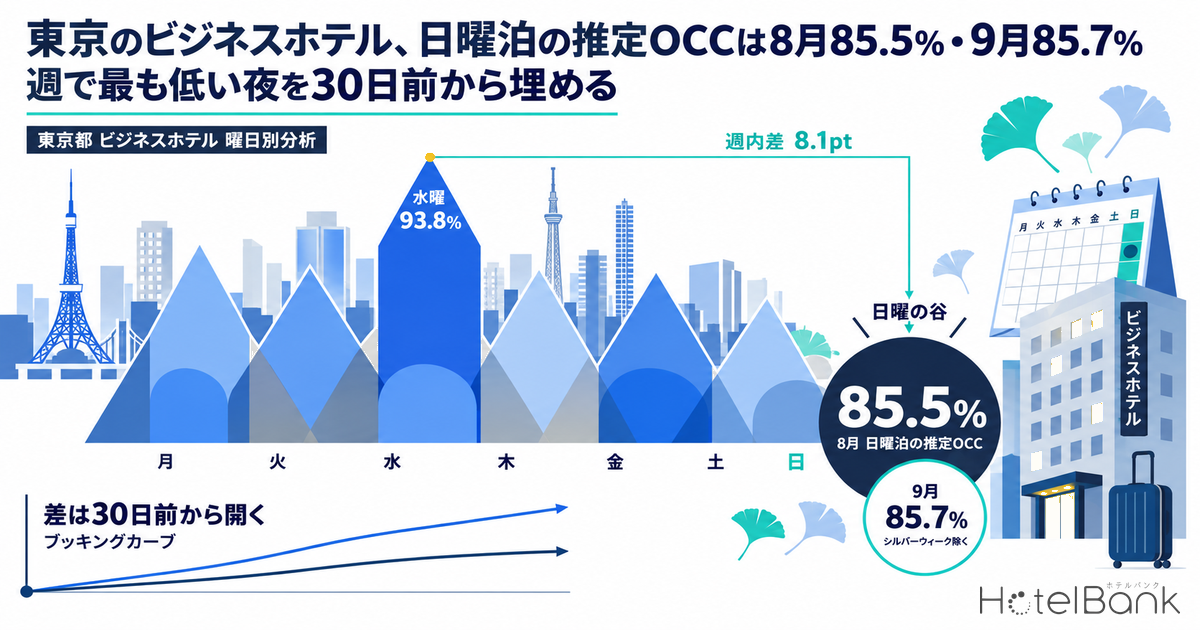
The HotelBank Editorial Team tallied estimated OCC (based on OTA-listed inventory) by day of week for Tokyo business hotels (N=529–561 properties) in August and September 2026. Sunday was the weakest night of the week in both months: 85.5% in August and 85.7% in September excluding Silver Week. The gap to the strongest day widened from 5.3 points (vs Thursday’s 90.8%) in August to 8.1 points (vs Wednesday’s 93.8%) in September. Overlaying booking curves shows that Sunday and Wednesday stood at almost the same level 45 days before the stay date, and that most of the gap opened between 30 and 14 days out. This article examines when and how this “Sunday trough” forms and sets out practical steps for filling Sunday nights heading into the regular autumn season.
Scope: Tokyo business hotels, N=529–561 properties (77,620–80,960 rooms; based on listings on major booking sites). The price metric in this article is estimated settled ADR (the settled price level estimated from OTA and other sales data, tax-excluded equivalent), and occupancy is an estimate based on OTA-listed inventory. Both are defined at the end of the article. Data as of: October 3, 2026.
- — Sunday is the weekly low — Estimated OCC at Tokyo business hotels was 85.5% in August 2026 and 85.7% in September (excluding Silver Week); the gap to the strongest day was 5.3pt in August (Thursday) and 8.1pt in September (Wednesday).
- — The gap opens between 30 and 14 days out — Sunday, Sep 27 and Wednesday, Sep 30 were level at 52.0% and 52.1% at 45 days out, but 8.5pt apart at 14 days out. Of the final 9.9pt gap, 8.4pt had already formed by 14 days out.
- — The last day of a holiday run is “another Sunday” — Wednesday, Sep 23 (holiday) was 81.0%, the lowest of September’s 30 nights. The trough appears on “holiday nights followed by a workday.”
- — Sunday is the lowest in all eight prefectures — Tokyo’s within-week gap (5.3pt in August) was the smallest of the eight regions compared; Kanagawa, Chiba and Saitama ran 8.3–16.5pt in both August and September.
- — What 1pt is worth — Estimated settled ADR was −8.9% YoY on August’s final figure. If a 100-room property lifts Sunday occupancy by 1pt, it adds about ¥600k a year (at ADR ¥11,600, 52 Sundays a year).
Estimated OCC by day of week — Sunday is the weekly low at 85.5% in August and 85.7% in September
We start with completed months, averaged by day of week. In August (31 days; N=529–539 properties / 77,620–78,439 rooms) the monthly average was 88.8%. Thursday (90.8%), Wednesday (90.3%) and Saturday (90.2%) led, while Sunday (85.5%) and Monday (86.2%) trailed. The shape is one of occupancy building toward the back half of the week, dropping on Sunday night and dragging into Monday.
September needs care. The 30-day monthly average was 90.3% (N=538–561 properties / 78,348–80,960 rooms), but that includes Silver Week from Saturday, September 19 to Wednesday, September 23 (holiday), and high holiday occupancy — 96.5% on the 19th and 98.0% on the 20th — pushes the average up. For the day-of-week comparison we therefore excluded those five days and counted only the remaining 25 days (the 1st–18th and 24th–30th). The 25-day average is 89.8%.
Even with the holidays removed, September had the same shape as August. Wednesday was highest at 93.8% and Sunday lowest at 85.7%, followed by Friday (88.5%) and Monday (88.6%). A trough bottoming out on Sunday sits between Tuesday–Thursday, when business-travel demand is thick, and Saturday, when leisure demand comes in.
Source: MetroEngines Research; compiled by the HotelBank Editorial Team (Tokyo business hotels, estimated OCC [based on OTA-listed inventory]; September covers the 25 days excluding Sep 19–23)
| Day | Aug: days | Aug: est. OCC | Aug: sold-out rate | Sep: days | Sep: est. OCC | Sep: sold-out rate |
|---|---|---|---|---|---|---|
| Mon | 5 | 86.2% | 13.0% | 3 | 88.6% | 12.9% |
| Tue | 4 | 89.8% | 17.4% | 4 | 90.3% | 19.4% |
| Wed | 4 | 90.3% | 17.6% | 4 | 93.8% | 32.7% |
| Thu | 4 | 90.8% | 20.7% | 4 | 90.5% | 24.1% |
| Fri | 4 | 89.5% | 15.7% | 4 | 88.5% | 13.7% |
| Sat | 5 | 90.2% | 22.2% | 3 | 90.0% | 23.4% |
| Sun | 5 | 85.5% | 12.1% | 3 | 85.7% | 11.2% |
Source: MetroEngines Research; compiled by the HotelBank Editorial Team (August N=529–539 properties, September N=538–561 properties; September covers the 25 days excluding Sep 19–23. Sold-out property rate = estimated share of properties with no listed inventory visible on OTAs and similar channels)
We should check, however, that August includes the Obon holidays. Sunday, August 16 was 80.3%, the lowest of the month, and may have pulled down the Sunday average. Recalculating without August 8–16 left Sunday unchanged at 85.5% (average of three days) and put Monday at 85.1% (four days). The Sunday trough is not a temporary post-Obon dip; it reads as a structure that appears in ordinary weeks too.
Lining up the sold-out property rate sharpens the outline of the trough. The share of properties with no listed inventory visible on OTAs and similar channels reached 32.7% on September Wednesdays, against just 11.2% on Sundays. In August, too, Thursday was 20.7% and Saturday 22.2% versus 12.1% for Sunday. Midweek, one property in three has nights where it sells out; on Sunday, nearly every property reaches the night with inventory still on hand. Applied to a base of about 78,000 rooms, August’s 5.3-point Sunday-vs-Thursday gap works out to a little over 4,000 rooms a night — not a small volume across the area. Note that the two metrics measure different things: estimated OCC tracks how much listed inventory the market as a whole has absorbed, while the sold-out property rate counts how many properties have nothing left to sell.
The last day of a holiday run is “another Sunday” — September 23 was 81.0%, the month’s low
The five Silver Week days left out of the day-of-week comparison hid the same pattern as Sunday. Estimated OCC ran high through the holidays — 96.5% on the 19th (Sat), 98.0% on the 20th (Sun), 94.5% on the 21st (Mon, holiday) and 92.9% on the 22nd (Tue, bridge holiday) — but the final day, the 23rd (Wed, holiday), fell to 81.0%, the lowest night of September’s 30. The following day, the 24th (Thu), recovered only to 83.5%, which held September’s Thursday average down to 90.5%.
What this shows is that the trough is created not by “Sunday” as a day of the week but by a position: “a holiday night followed by a workday.” Leisure guests head home on the last day off, and business travelers have not yet arrived. In an ordinary week this gap in the changeover shows up on Sunday; in a holiday run it shows up on the last day. Sunday the 20th hit 98.0% precisely because the next day was also a day off. Reading demand by position on the calendar rather than by day of week is what leads into the actions later in this article.
Regional comparison — Sunday is the lowest in all eight prefectures, and Tokyo’s trough is among the shallowest
Is the Sunday trough unique to Tokyo? Using the same method (business hotels, estimated OCC, September covering the 25 days excluding the five Silver Week days), we lined up three prefectures in the Tokyo metropolitan area and four in other major metro areas. The result is clear: in all eight prefectures compared, Sunday was the weakest night of the week in both August and September. The Sunday trough reads as a nationwide structure.
Within that picture, Tokyo’s trough is shallow. Its August within-week gap (strongest day − Sunday) of 5.3pt was the smallest of the eight regions, and its September gap of 8.1pt was third smallest after Fukuoka (6.7pt) and Aichi (7.7pt). On the Sunday level itself, Tokyo’s 85.5% was the highest of the eight in August, and its 85.7% in September tied with Fukuoka. By contrast, in neighboring Kanagawa, Chiba and Saitama, Sunday stood at only 72.8–80.2%, with within-week gaps of 8.3–16.5pt, wider than Tokyo’s. Tokyo’s Sunday appears to secure a baseline of demand from business travelers arriving the night before the work week and visitors from outside the metropolitan area, whereas the surrounding prefectures seem to have a thinner base for that demand.
There are two implications for Tokyo properties. First, because the market-wide trough is shallow, if your own Sunday falls below the market level, the cause is more likely to be on your side — location, selling conditions and the like. Second, even a shallow trough sits on a large base: as noted above, August’s 5.3-point gap equals a little over 4,000 rooms a night. The day-of-week pattern in Hokkaido is analyzed separately in our study of Hokkaido business hotels’ estimated OCC by day of week.
| Prefecture | Aug N (properties) | Aug: Sunday | Aug: strongest day | Aug: within-week gap | Sep N (properties) | Sep: Sunday | Sep: strongest day | Sep: within-week gap |
|---|---|---|---|---|---|---|---|---|
| Tokyo | 529–539 | 85.5% | Thu 90.8% | 5.3pt | 538–561 | 85.7% | Wed 93.8% | 8.1pt |
| Kanagawa | 114–117 | 79.7% | Wed 88.0% | 8.3pt | 115–124 | 80.2% | Wed 90.2% | 10.0pt |
| Chiba | 83–85 | 78.5% | Sat 89.3% | 10.8pt | 85–96 | 77.9% | Wed 87.7% | 9.8pt |
| Saitama | 57–59 | 73.8% | Sat 87.9% | 14.1pt | 59–66 | 72.8% | Wed 89.3% | 16.5pt |
| Aichi | 171–175 | 73.5% | Wed/Thu 87.9% | 14.4pt | 171–175 | 84.8% | Thu 92.5% | 7.7pt |
| Osaka | 282–288 | 72.5% | Sat 85.8% | 13.3pt | 285–300 | 67.9% | Sat 83.7% | 15.8pt |
| Fukuoka | 173–178 | 85.1% | Thu 93.9% | 8.8pt | 175–181 | 85.7% | Sat 92.4% | 6.7pt |
| Hokkaido | 215–222 | 84.4% | Thu 95.3% | 10.9pt | 219–231 | 85.2% | Thu 95.7% | 10.5pt |
Source: MetroEngines Research; compiled by the HotelBank Editorial Team (business hotels, estimated OCC [based on OTA-listed inventory]; day-of-week values are simple averages of daily values; September covers the 25 days excluding Sep 19–23; within-week gap = average of the strongest day − average of Sunday)
Booking curves — level at 45 days out, with the gap opening between 30 and 14 days out
So at what stage of booking does the Sunday trough form? Overlaying the booking curves for Sunday, September 27 (N=561 properties / 80,793 rooms) and Wednesday, September 30 of the same week (N=556 properties / 79,671 rooms) shows both starting from almost the same point 45 days before the stay: Sunday 52.0%, Wednesday 52.1%. At 30 days out they were 59.1% and 61.9%, 2.8pt apart; at 14 days out, 69.3% and 77.8%, with the gap widened to 8.5pt. On the day before the stay they stood at 85.2% and 95.1%, a 9.9pt gap.
In other words, 8.4pt of the final 9.9pt gap had already formed between 45 and 14 days out. Over the last seven days, Sunday added +10.8pt and Wednesday +11.1pt — almost the same, with virtually no day-of-week difference in late pickup. Between 30 and 14 days out, Wednesday picked up +15.9pt of bookings while Sunday built only +10.2pt over the same period. That difference in mid-window pickup carries straight through to the gap on the night.
Source: MetroEngines Research; compiled by the HotelBank Editorial Team (Tokyo business hotels, estimated OCC [based on OTA-listed inventory]; Sep 27 stays N=561 properties, Sep 30 stays N=556 properties; observed from 45 days before to the day before the stay date)
The same pattern holds for the pair two weeks earlier, Sunday, September 13 and Wednesday, September 16. Here there was already a 4.4pt gap at 45 days out, but it widened from 5.9pt at 30 days out to 10.9pt at 14 days out, settling at 10.1pt on the day before the stay (84.9% vs 95.0%). Over the last seven days Sunday added +12.6pt and Wednesday +11.1pt — again, Sunday did not lag in the final week.
| Stay date | N (properties / rooms) | 45 days out | 30 days out | 14 days out | 7 days out | Day before |
|---|---|---|---|---|---|---|
| Sep 13 (Sun) | 547 / 78,839 rooms | 48.7% | 55.5% | 66.0% | 72.3% | 84.9% |
| Sep 16 (Wed) | 549 / 79,399 rooms | 53.1% | 61.4% | 76.9% | 83.9% | 95.0% |
| Gap (Wed − Sun) | — | 4.4pt | 5.9pt | 10.9pt | 11.6pt | 10.1pt |
| Sep 27 (Sun) | 561 / 80,793 rooms | 52.0% | 59.1% | 69.3% | 74.4% | 85.2% |
| Sep 30 (Wed) | 556 / 79,671 rooms | 52.1% | 61.9% | 77.8% | 84.0% | 95.1% |
| Gap (Wed − Sun) | — | 0.1pt | 2.8pt | 8.5pt | 9.6pt | 9.9pt |
Source: MetroEngines Research; compiled by the HotelBank Editorial Team (Day before = observation as of the day before the stay date)
October booking progress is starting to show the same signs. Comparing Sunday, October 18 (N=542 properties / 78,403 rooms) and Wednesday, October 21 (N=541 properties / 78,340 rooms) at the same days-out, they were 61.0% and 62.6% at 45 days out (1.6pt apart) and still only 1.8pt apart at 30 days out (69.5% and 71.3%), but at 20 days out the gap had opened to 4.9pt (75.1% and 80.0%). As of October 2, the 18th stood at 78.6% with 16 days to go and the 21st at 80.9% with 19 days to go. Sales move daily, so we cannot be definitive, but October appears to be following the same path as September, with the gap opening in the middle of the window.
Estimated settled ADR — August final figure −8.9% YoY, a phase where lifting occupancy pays off
It is worth checking the value of filling the within-week trough from the price side too. Estimated settled ADR for Tokyo business hotels was about ¥11,600 on the final figure for August 2026 (N=915 properties), −8.9% against about ¥12,700 a year earlier (N=900 properties). June was −4.7% and July −5.3%, so summer ran below the prior year for three consecutive months. Even in August, when estimated OCC was high at a monthly average of 88.8%, rates fell short of the prior year. This is a phase that calls not only for pushing rates on high-occupancy nights but also for lifting low-occupancy nights to support monthly revenue.
Current levels, on the other hand, are turning up. September is about ¥13,400 (N=900 properties) and October about ¥18,900 (N=897 properties) — both estimates based on current sales that may change. The prior year’s final figures were about ¥13,100 for September and about ¥15,300 for October, but a straight comparison between estimates and final figures should wait until the months are finalized. Note that estimated settled ADR is a monthly metric; this article does not address rate differences by day of week.
Source: MetroEngines Research; compiled by the HotelBank Editorial Team (Tokyo business hotels, estimated settled ADR [tax-excluded equivalent]; September 2026 onward are estimates based on current sales and may change)
What filling Sunday is worth — lifting a 100-room property by 1pt adds about ¥600k a year
How much effort to put into filling the trough depends on what filling it is worth. We therefore estimated how annual room revenue changes as a 100-room property lifts Sunday occupancy. For rate we used the final August 2026 estimated settled ADR (about ¥11,600), and counted 52 Sundays a year. Adding the last nights of holiday runs would raise the count further.
We set three scenarios. The pessimistic case adds 1pt (one room a night at 100 rooms); the middle case adds 2.6pt, half of August’s 5.3pt market within-week gap; the optimistic case closes the gap entirely, adding 5.3pt to reach Thursday’s level. Even the middle case yields about ¥1.57M a year and the optimistic case about ¥3.2M: a single empty room on Sunday may look small, but over a year it is not a negligible sum. Applied to the whole market (about 78,000 rooms), the middle case equals roughly 2,000 additional rooms a night.
| Scenario | Sunday uplift | Extra rooms per night (100 rooms) | Extra room-nights per year (×52) | Incremental annual revenue (ADR ¥11,600) | Whole-market equivalent per night (~78,000 rooms) |
|---|---|---|---|---|---|
| Pessimistic | +1.0pt | 1.0 room | 52 room-nights | ~¥603k | 778 rooms |
| Middle | +2.6pt | 2.6 rooms | 135 room-nights | ~¥1.568M | ~2,000 rooms |
| Optimistic | +5.3pt | 5.3 rooms | 276 room-nights | ~¥3.197M | ~4,100 rooms |
| Sunday uplift \ Rate | ¥10,000 (assumes a lower Sunday rate) | ¥11,600 (August final) | ¥13,400 (September estimate) |
|---|---|---|---|
| +1pt (1 room/night) | ~¥520k | ~¥603k | ~¥697k |
| +2pt (2 rooms/night) | ~¥1.040M | ~¥1.206M | ~¥1.394M |
| +3pt (3 rooms/night) | ~¥1.560M | ~¥1.810M | ~¥2.090M |
| +4pt (4 rooms/night) | ~¥2.080M | ~¥2.413M | ~¥2.787M |
| +5pt (5 rooms/night) | ~¥2.600M | ~¥3.016M | ~¥3.484M |
Source: HotelBank Editorial Team estimates (rate = estimated settled ADR [tax-excluded equivalent]; ¥10,000 is an assumed value for the estimate; incremental annual revenue = uplift pt × 100 rooms ÷ 100 × rate × 52)
Moving the rate from ¥10,000 to ¥13,400 keeps the annual gain per point within roughly ¥520k–¥700k; what drives the result is how many points can be added, more than the rate. That said, actual Sunday rates are often below the monthly average, and chasing most of the uplift through discounting would erode the rate side. Priority should go to measures that get guests to choose stays including Sunday without breaking rate — such as the multi-night and add-on conditions set out below. Also, estimated OCC is a metric based on OTA-listed inventory, and the estimate assumes that a property’s actual occupancy rises by the same number of points.
For revenue managers running Tokyo business hotels — implications and action plan
Let us translate the data so far into terms of running your own property. Sunday nights are weak across the whole market, so there is no need to see this as a problem unique to your hotel. Rather, the room to act lies in the fact that the curves show at which stage intervention could narrow the gap.
Operational insights
1. Hold your own “within-week gap” against the market yardstick.In the market, the gap between Sunday and the strongest day was 5.3pt in August and 8.1pt in September. Lining up your own day-of-week occupancy in the same way, excluding holidays, and checking whether your gap is wider or narrower than this makes it easier to judge how much priority Sunday measures deserve.
2. The decisive stretch is the middle of the window, not the final days.Of the 9.9pt gap between Sunday and Wednesday, 8.4pt formed between 45 and 14 days before the stay. Late pickup over the last seven days was similar — Sunday +10.8pt, Wednesday +11.1pt — so closing the gap with last-minute measures alone looks difficult. A design that captures bookings including Sunday before the 30-days-out point is likely to work better.
3. Treat “holiday nights followed by a workday” as a management category of their own.Wednesday, September 23 (holiday) was 81.0%, lower than an ordinary Sunday. The nights of Monday, October 12 (holiday), Tuesday, November 3 (holiday) and Monday, November 23 (holiday) sit in the same position. Handling Sundays and the last nights of holiday runs together as “trough nights” makes measures easier to reuse.
4. Connect near-full midweek nights with Sunday’s remaining inventory.In September the sold-out property rate was 32.7% on Wednesdays against 11.2% on Sundays. Business travelers arriving the night before a Monday-morning start and leisure guests extending from Saturday fit well with Sunday inventory. Consider ways to make stays including Sunday easier to choose from three angles: multi-night conditions, selling conditions and channels.
Concrete measures are easiest to organize under three headings: multi-night conditions, selling conditions and channels. For multi-night conditions, one approach is to attach benefits to stays spanning Saturday–Sunday or Sunday–Monday, selling Sunday in combination with the nights around it rather than on its own. For selling conditions, there may be room to offer add-ons that appeal to guests heading to work the next morning, such as late checkout or early check-in limited to Sunday check-ins. For channels, aim to deliver offers to corporate accounts and your own members in the 30-to-14-days-out window, when Sunday bookings stall. The actions are summarized along a timeline below.
| Timing | Measure | Decision trigger (figures in this article) | Aim |
|---|---|---|---|
| Up to 45 days out | Set up multi-night plans spanning Sat–Sun and Sun–Mon to make stays including Sunday easier to choose | In the market, Sunday 52.0% and Wednesday 52.1% were level at 45 days out; put this in place while your own property has no gap yet | Capture bookings including Sunday before the gap opens |
| Up to 45 days out | Put the last nights of holiday runs — Oct 12, Nov 3, Nov 23, etc. — in the same management category as Sundays | Wednesday, Sep 23 (holiday) was 81.0%, the lowest of September | Avoid overlooking trough nights |
| 30 days out | Review booking progress for Sunday side by side with the Wednesday of the same week | If your gap exceeds the market’s 30-days-out gap (2.8–5.9pt), bring the next measure forward | Catch any lag early |
| 30–14 days out | Promote add-ons for Sunday check-ins (e.g., extended stay time for night-before arrivals) to corporate accounts and your own members | The period when the market gap widens from 2.8pt to 8.5pt (Wednesday +15.9pt vs Sunday +10.2pt) | Narrow the difference in mid-window pickup |
| 14–7 days out | In weeks when midweek nights are nearing full, prioritize accepting multi-night stays starting on Sunday | September sold-out property rate: Wednesday 32.7%, Sunday 11.2% | Channel midweek demand into Sunday inventory |
| Last 7 days | Release all Sunday inventory to every channel to capture last-minute demand | Sunday also builds +10.8–12.6pt over the last 7 days | Don’t miss late pickup |
| Monthly review | Tally day-of-week occupancy excluding holidays and record the gap between Sunday and midweek | Market Sunday 85.5% (Aug) and 85.7% (Sep); within-week gap 5.3–8.1pt | Track the effect of measures on the same yardstick |
Note that estimated OCC is a metric based on OTA-listed inventory and tends to read higher than actual room occupancy. When comparing with your own results, it is better to compare the gaps between days and the shape of the curves rather than the levels themselves.
Summary — three yardsticks for measuring the Sunday trough
To sum up, Sunday nights at Tokyo business hotels can be captured with three yardsticks. The first is level: Sunday estimated OCC was at the bottom of the week in both months, at 85.5% in August and 85.7% in September, 5.3–8.1pt below the strongest day. The second is timing: there is barely any gap between Sunday and Wednesday at 45 days out, and it opens between 30 and 14 days out. The third is position: as the 81.0% on September 23, the last day of a holiday run, shows, the trough appears on “holiday nights followed by a workday.”
August’s estimated settled ADR was −8.9% YoY on the final figure, a situation in which it has been hard to rely on rate growth. Autumn is a season when business demand returns and midweek occupancy tends to rise, which makes lifting Sundays and the last nights of holiday runs a potential lever for supporting revenue across the whole month. A good place to start is to line up your own day-of-week results in the same framework and compare them with the market curves at three points: 45 days out, 30 days out and the day before.
Frequently asked questions
Q. Which day of the week has the lowest occupancy at Tokyo business hotels?
On estimated OCC (based on OTA-listed inventory) for August and September 2026, Sunday nights were the lowest in both months: 85.5% in August and 85.7% in September excluding Silver Week. The strongest day was Thursday (90.8%) in August and Wednesday (93.8%) in September.
Q. At what stage of booking does the gap between Sunday and weekdays open?
Comparing Sunday, September 27 with Wednesday, September 30, they were almost level at 45 days out (52.0% and 52.1%), but the gap widened to 2.8pt at 30 days out and 8.5pt at 14 days out. Of the final 9.9pt gap, 8.4pt had formed by 14 days out, and pickup over the last seven days was almost the same for Sunday and Wednesday.
Q. Does occupancy also drop on the last day of a holiday run?
Yes. The last day of Silver Week, Wednesday, September 23 (holiday), was 81.0% — the lowest night of September’s 30. Managing holiday nights followed by a workday in the same way as ordinary Sundays lets you apply the same measures to both.
Q. Is Tokyo’s Sunday trough deeper than in other regions?
Sunday was the lowest night in all eight prefectures compared, but Tokyo’s within-week gap of 5.3pt in August was the smallest of the eight, and its Sunday level was among the highest. Kanagawa, Chiba and Saitama had wider within-week gaps than Tokyo, at 8.3–16.5pt.
Q. How much does revenue change if Sunday occupancy is raised?
If a 100-room property lifts Sunday occupancy by 1pt, the estimate — at an estimated settled ADR of about ¥11,600 and 52 Sundays a year — is about ¥600k more a year. Closing half of August’s market within-week gap (2.6pt) yields about ¥1.57M, and closing it entirely (5.3pt) about ¥3.2M.
About the data
| Estimated OCC | OTA-listed-inventory occupancy = 100 − 100 × OTA-listed rooms remaining ÷ total rooms. Covers a fixed cohort (the same set of properties for every stay date) of properties listing at least 30% of their total rooms on OTAs. It is an estimate based on how inventory sold on OTAs is being absorbed and is defined differently from actual room occupancy (it reads higher, because rooms not listed are counted as absorbed). Completed-month results are for August (31 days) and September (30 days) 2026; day-of-week averages are simple averages of daily values for each day. The September day-of-week comparison uses the 25 days excluding Silver Week (September 19–23). |
| Booking curve | Based on observations from 45 days before the stay date to the latest. “Day before” is the value as of the day before the stay date. |
| Sold-out property rate | Estimated share of properties with no listed inventory visible on OTAs and similar channels. Day-of-week values are simple averages of daily values for each day. |
| Estimated settled ADR | Settled price level (tax-excluded equivalent) estimated from OTA and other sales data (lowest-plan level × category-specific factor, ensemble across multiple channels). Past months are final figures; current and future months are estimates based on current sales. Median error against published operating results: 6.6%. In this article, figures through August 2026 are final and September onward are estimates. |
| Scope | Business hotels in Tokyo. Estimated OCC: August N=529–539 properties (77,620–78,439 rooms), September N=538–561 properties (78,348–80,960 rooms), October stay dates N=541–542 properties (78,340–78,403 rooms) — all based on listings on major booking sites. Estimated settled ADR: N=897–915 properties (900 properties for August 2025). |
| Data as of | Data as of: October 3, 2026. Sales and inventory change daily, so the figures in this article are snapshots as of the time of retrieval. |
Source: MetroEngines Research; compiled by the HotelBank Editorial Team
References and Sources
■ Data sources
MetroEngines Research estimated OCC (based on OTA-listed inventory, fixed cohort): completed-month results (daily values for August and September 2026) and booking curves by stay date (from 45 days before to the day before the stay date), plus estimated settled ADR (August 2025–October 2026). The comparison set is business hotels in Kanagawa, Chiba, Saitama, Aichi, Osaka, Fukuoka and Hokkaido, tallied with the same definitions and the same period as Tokyo (data as of October 3, 2026).
■ Estimate assumptions
Day-of-week averages are simple averages of daily values for each day. For September, the five Silver Week days (September 19–23) were excluded in every region. The within-week gap is the average of the strongest day minus the Sunday average. The revenue estimate in Table 4 assumes 100 rooms, 52 Sundays a year and a rate of ¥10,000–¥13,400 (centered on the August final estimated settled ADR of about ¥11,600), calculated as uplift pt × 100 rooms ÷ 100 × rate × 52.
■ Limitations and caveats
Estimated OCC is an estimate based on OTA-listed inventory and reads higher than actual occupancy, because unlisted rooms and stop-sells are counted as absorbed. The pickup from 3 days out to the day before (+5.9pt for September 27, +5.3pt for the 30th) may include the effect of stop-sells, so late pickup should be read as an upper bound. Estimated settled ADR is a monthly metric and does not cover rates by day of week; September and October are estimates based on current sales. Cohort sizes differ across the regional comparison (Saitama has 57–66 properties), and smaller cohorts show larger day-to-day swings.
■ Market data
- MetroEngines Research, “Estimated OCC (based on OTA-listed inventory) and booking curves,” business hotels in Tokyo and seven other prefectures (August–October 2026)
- MetroEngines Research, “Estimated settled ADR,” Tokyo business hotels (August 2025–October 2026)