

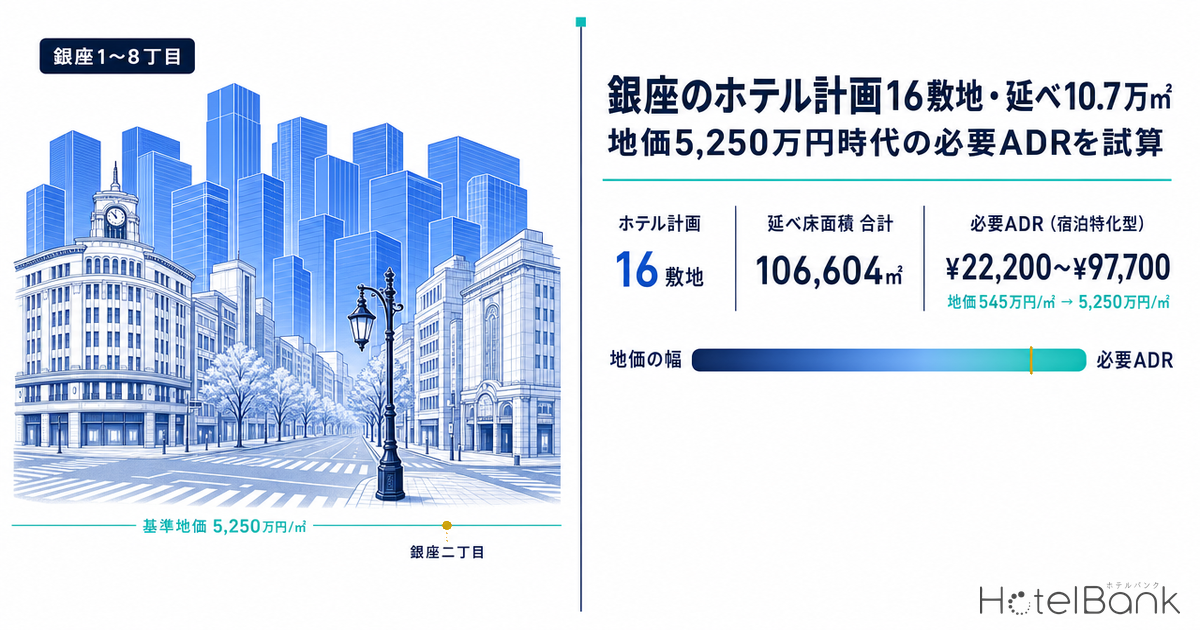
In Ginza, building plans whose principal use is hotel have piled up on 16 sites. Scheduled completions run from December 2026 to March 2030, and total floor area comes to 106,604 m². Of that, 99,094 m², or 93.0%, is concentrated on 10 sites due for completion in the second half of 2028 or later. Over the same period, the 2026 Prefectural Land Price Survey put the benchmark site in Ginza 2-chome at ¥52.5M per m² (+11.9% YoY). This article organizes the plans site by site, converts Ginza’s land prices—which vary more than tenfold even within Ginza—into “land cost per room,” and works backward to the average daily rate (ADR) each of limited-service and full-service hotels would require. Finally, it overlays those required levels on the rate distribution of the 39 hotels and 6,902 rooms already in Ginza to show which hotel types offer investment opportunities in which land-price bands.
Metric Definitions Used in This Article
- ADR (average daily rate): An estimated settled rate (tax-excluded equivalent), calculated by applying a segment-specific adjustment factor to the lowest-plan rate each hotel publishes on OTAs (2 guests per room, per-room rate, tax included). Checked against property-level results disclosed by listed hotel REITs (91 hotels, most recent 3 months), the median error is about 7%. These are estimates and differ from each hotel’s actual settled prices and accounting figures. Area-level ADR is the median of the hotels covered (the level of a typical hotel in the area).
- Required ADR: The room rate (tax-excluded equivalent) at which an investment meets its target yield, derived by multiplying the per-room investment in land and the building itself by the target yield and dividing back by the assumed occupancy and the NOI ratio to room revenue. This is an estimate made for this article and does not represent actual project economics. Assumptions are listed at the end under “■ Estimate Assumptions.”
- Floor-area multiple: Total floor area of a building plan ÷ site area. Because it includes floor space not counted toward the floor-area ratio (FAR), such as retail and parking, it does not match the designated FAR.
- Pipeline: Building plan summaries (building-confirmation-application basis) based on the Ministry of Land, Infrastructure, Transport and Tourism (MLIT) Building Dynamics Statistics Survey and other sources. They do not indicate opening dates, operators or brands.
- Occupancy: Published figures from the Japan Tourism Agency’s Overnight Travel Statistics Survey (2025 final figures).
- Data sources: MetroEngines Research & Consulting / MLIT Building Dynamics Statistics Survey / MLIT Real Estate Information Library (Official Land Prices and Prefectural Land Price Survey)
Source: MetroEngines Research & Consulting / MLIT Building Dynamics Statistics Survey / MLIT Prefectural Land Price Survey (as of July 1, 2026)
- Excluding duplicates, hotel building plans in Ginza 1–8-chome cover 16 sites and 106,604 m² of floor area. They split into two waves: 6 small sites of around 1,000 m² in 2026–2027, and 7 large sites of more than 9,000 m² each from the second half of 2028 onward.
- Official land prices at 19 commercial points in Ginza range from ¥3.65M to ¥67.1M per m², an 18-fold spread. Since 2019, high-priced points have risen +16.6%, while low-priced points around ¥5M have risen +43.5%—the lower the price band, the faster the growth.
- The required ADR for a limited-service hotel (40 m² of floor area per room) is ¥22,200 at a point priced at ¥5.45M/m² and ¥29,700 at ¥10.1M/m². Compared with the ¥30,400 median estimated settled ADR of 32 existing Ginza hotels, the low-to-mid land-price bands offer investment opportunities reachable at existing rates.
- At a point priced at ¥52.5M/m², land accounts for 86% of per-room investment, and the required ADR for a limited-service hotel rises to ¥97,700. At high-priced points, designs that share the land cost through full-service operations or combinations with retail floors become a prerequisite.
- 59.7% of planned floor area is concentrated in 7- and 8-chome, exceeding the two districts’ 33.0% share of existing rooms. Required ADR is more sensitive to the NOI ratio than to occupancy (about 12–17% per 5 pt), so operating design such as the direct-booking share is the lever that can widen the land-price bands in which a project works.
Ginza’s pipeline: 16 sites, 106,604 m² — consolidating duplicate rows into sites
From building plan data based on the MLIT Building Dynamics Statistics Survey and other sources, we extracted hotel-use plans located in Ginza, Chuo-ku, with scheduled completion in October 2026 or later. Because the same site is often registered in 2–4 rows owing to different lot-number notations (e.g., “Ginza 7-16-3” and “Ginza 7-205-1”) or different information sources, we merged rows with matching floor area, number of floors, owner and scheduled completion into one site. The result is the 16 sites below: 38 rows on a row basis become 16 on a site basis.
Almost none of the plans state a room count. The sole exception is the plan at Ginza 8-chome 16, which Accor has announced as Pullman Tokyo Ginza (プルマン東京銀座), a 12-story, 145-room hotel scheduled to open at the end of 2027 (scheduled completion in the building plan: October 2028). Dividing its 9,990 m² of floor area by 145 rooms gives 68.9 m² of floor area per room. In addition, Mitsubishi Corporation Urban Development announced in April 2025 that the plan at Ginza 8-chome 15-2 would “start construction in spring 2027 and open in autumn 2029 or later.” For all other plans, we do not estimate room counts and treat them by floor area.
| No. | Site / plan name | Owner (as stated in plan) | Total floor area | Site area | Floor-area multiple | Floors | Principal use | Scheduled completion |
|---|---|---|---|---|---|---|---|---|
| 1 | Ginza 3-14-16, Chuo-ku (tentative) Ginza 3-chome Hotel | Higashi Nihon Toshi Kaihatsu | 999.66 m² | 129.46 m² | 7.7x | 11F | Hotel | Dec 2026 |
| 2 | Ginza 8-10, Chuo-ku (tentative) Ginza 8-chome Project | CREAL | 757.47 m² | 95.87 m² | 7.9x | 13F | Hotel | Jan 2027 |
| 3 | Ginza 7-18-15, Chuo-ku (tentative) Ginza 7-chome Hotel Plan | Daiichi Realtor | 1,352.25 m² | 211.74 m² | 6.4x | 10F | Ryokan / hotel | Jan 2027 |
| 4 | Ginza 1-23, Chuo-ku (tentative) Ginza 123 PJ | An Consulting | 1,352.17 m² | — | — | 10F | Hotel | Mar 2027 |
| 5 | Ginza 1-19-16, Chuo-ku (tentative) Chuo-ku Ginza 1-chome Plan | Daiwa House Industry | 2,445.00 m² | 244.00 m² | 10.0x | 13F | Hotel | Aug 2027 |
| 6 | Ginza 2-14-8, Chuo-ku (tentative) G.D.P.H Ginza | Lead Real Estate | 603.70 m² | 98.82 m² | 6.1x | 9F/B1 | Hotel, restaurant | Oct 2027 |
| 7 | Ginza 8-16-10, Chuo-ku (tentative) Ginza 8-chome Hotel (Pullman Tokyo Ginza) | Ginza no Hotel GK | 9,990.00 m² | — | — | 12F/B1 | Hotel | Oct 2028 |
| 8 | Ginza 7-13-8, Chuo-ku (tentative) Ginza 7-chome Showa-dori Development Plan | Hulic | 14,495.40 m² | 1,174.24 m² | 12.3x | 15F/B1 | Hotel, parking garage | Jun–Dec 2028 |
| 9 | Ginza 8-3, Chuo-ku (tentative) Ginza Hotel Project | Kasumigaseki Capital | 2,547.00 m² | 258.00 m² | 9.9x | 12F/B1 | Hotel | Mar 2029 |
| 10 | Ginza 8-2-8, Chuo-ku (tentative) Kyoto Shimbun Ginza 8-chome Project | Kyoto Shimbun Properties | 3,774.18 m² | 325.77 m² | 11.6x | 14F/B2 | Hotel, retail, office | Apr 2029 |
| 11 | Ginza 7-16-3, Chuo-ku (tentative) Kobiki Building Hotel Plan | Nippon Steel Kowa Real Estate | 9,744.38 m² | 1,047.00 m² | 9.3x | 12F/B1 | Hotel, restaurant, parking garage | Apr 2029 |
| 12 | Ginza 2-5-6, Chuo-ku (tentative) Ginza 2-chome Project | Heisei Jisho | 3,922.48 m² | 584.00 m² | 6.7x | 7F/B2 | Hotel | Jul 2029 |
| 13 | Ginza 7-2-22, Chuo-ku (tentative) G7 Plan | Sumitomo Corporation | 11,400.20 m² | 1,123.78 m² | 10.1x | 13F/B1 | Hotel | Aug 2029 |
| 14 | Ginza 2-7-18, Chuo-ku (tentative) Ginza Boeki Building Redevelopment Plan | Ginza Boeki | 20,200.00 m² | 1,539.58 m² | 13.1x | 14F/B3 | Hotel, retail store | Oct 2029 |
| 15 | Ginza 3-2-17, Chuo-ku (tentative) Ginza 3-chome Development Plan | Toei | 13,420.60 m² | 1,100.98 m² | 12.2x | 14F/B2 | Hotel, retail, parking | Oct 2029 |
| 16 | Ginza 8-15-2, Chuo-ku (tentative) Chuo-ku Ginza 8-chome New Construction | Mitsubishi Estate / Mitsubishi Corporation Urban Development | 9,600.00 m² | 835.00 m² | 11.5x | 14F/B1 | Hotel | Mar 2030 |
Of the 16 sites, 7 are large plans exceeding 9,000 m² of floor area, totaling 88,851 m², or 83.3% of the whole. Owners include a general trading company, real estate companies, a steel-group developer, a film company, a newspaper-affiliated property company and local Ginza firms, and many plans choose hotel use when rebuilding existing buildings (such as the Ginza Boeki Building Redevelopment Plan). For the 14 plans that state site area, the floor-area multiple ranges from 6.1x to 13.1x, with a median of 9.9x. The estimates below use 10x, the rounded median, as “the floor area that one m² of site generates in a Ginza plan.”
Completions come in two waves — small sites in 2027, large sites in H2 2029
Lining up scheduled completions by half-year makes the structure of the pipeline clear. The 6 sites from H2 2026 to H2 2027 are small sites of 604–2,445 m² of floor area, totaling only 7,510 m². Many are slender 9–13-story buildings, a typical scale for limited-service hotels. From H2 2028 onward, by contrast, floor area builds to a peak in H2 2029: 24,485 m² in H2 2028 (2 sites), 16,066 m² in H1 2029 (3 sites), 48,943 m² in H2 2029 (4 sites) and 9,600 m² in H1 2030 (1 site).
Figure 1. Hotel plans in Ginza: floor area and number of sites by half-year of scheduled completion (N=16 sites, 106,604 m²). No. 8 is counted at the later date (December 2028). Source: compiled by MetroEngines Research & Consulting from the MLIT Building Dynamics Statistics Survey
Scheduled construction starts show that this peak is still at a stage where it can shift. Of the 7 large plans, 4 list construction starts in 2027 or later (January, April, June and September 2027). For large projects with long construction periods, the final investment decision is often made on construction costs and interest rates at the time of groundbreaking. Shifts of six months to a year in scheduled completion are not unusual, so the H2 2029 peak is best read as “the peak in the current plans.” From the perspective of anyone evaluating hotel land, openings may cluster in 2028–2030, while 2027 through H1 2028 will be a period with almost no new large-scale supply.
Ginza land prices span 18x — the lower the price, the faster the growth
From the MLIT Real Estate Information Library, we obtained official land prices for commercial land in Ginza 1–8-chome (standard sites of the Official Land Prices and benchmark sites of the Prefectural Land Price Survey). 2026 prices at 19 points range from ¥3.65M to ¥67.1M per m². The benchmark site “Ginza 2-chome 2-19 et al.,” reported as the highest price in Japan, is ¥52.5M, up +11.9% from ¥46.9M the previous year. The highest standard site in the Official Land Prices (as of January 1), “Ginza 4-chome 2-4,” is ¥67.1M (+10.9%).
| Location (lot number) | Type / point number | 2026 price/m² | YoY | vs. 2019 | Designated FAR |
|---|---|---|---|---|---|
| Ginza 4-chome 2-4 | Standard site (Official Land Price, Jan 1) Chuo 5-22 | ¥67.1M | +10.9% | +17.3% | 800% |
| Ginza 5-chome 103-16 | Standard site (Official Land Price, Jan 1) Chuo 5-41 | ¥57.0M | +10.3% | +16.1% | 800% |
| Ginza 2-chome 2-19 et al. | Benchmark site (Prefectural Land Price Survey, Jul 1) Chuo 5-13 | ¥52.5M | +11.9% | +21.5% | 800% |
| Ginza 2-chome 2-19 et al. | Standard site (Official Land Price, Jan 1) Chuo 5-29 | ¥49.6M | +11.7% | +16.4% | 800% |
| Ginza 7-chome 1-2 et al. | Standard site (Official Land Price, Jan 1) Chuo 5-23 | ¥47.6M | +10.4% | +13.3% | 800% |
| Ginza 6-chome 4-13 et al. | Benchmark site (Prefectural Land Price Survey, Jul 1) Chuo 5-14 | ¥37.0M | +12.1% | +16.7% | 700% |
| Ginza 4-chome 103-1 et al. | Standard site (Official Land Price, Jan 1) Chuo 5-18 | ¥35.6M | +10.9% | +20.7% | 800% |
| Ginza 6-chome 4-13 et al. | Standard site (Official Land Price, Jan 1) Chuo 5-2 | ¥35.0M | +13.6% | +12.2% | 700% |
| Ginza 3-chome 3-1 | Standard site (Official Land Price, Jan 1) Chuo 5-4 | ¥19.7M | +11.3% | +16.6% | 700% |
| Ginza 8-chome 109-7 | Standard site (Official Land Price, Jan 1) Chuo 5-53 | ¥15.2M | +6.3% | -3.2% | 700% |
| Ginza 5-chome 201-4 et al. | Standard site (Official Land Price, Jan 1) Chuo 5-44 | ¥11.7M | +11.4% | +29.6% | 800% |
| Ginza 2-chome 203-17 | Benchmark site (Prefectural Land Price Survey, Jul 1) Chuo 5-17 | ¥10.2M | +9.6% | +30.8% | 800% |
| Ginza 7-chome 5-2 | Benchmark site (Prefectural Land Price Survey, Jul 1) Chuo 5-5 | ¥10.1M | +14.1% | +21.7% | 700% |
| Ginza 7-chome 5-2 | Standard site (Official Land Price, Jan 1) Chuo 5-54 | ¥9.39M | +10.3% | — | 700% |
| Ginza 7-chome 102-19 et al. | Benchmark site (Prefectural Land Price Survey, Jul 1) Chuo 5-15 | ¥7.51M | +10.0% | +4.7% | 800% |
| Ginza 2-chome 103-6 | Standard site (Official Land Price, Jan 1) Chuo 5-27 | ¥7.10M | +10.1% | +24.1% | 700% |
| Ginza 7-chome 205-14 | Benchmark site (Prefectural Land Price Survey, Jul 1) Chuo 5-27 | ¥5.45M | +19.5% | +75.8% | 700% |
| Ginza 2-chome 213-14 | Standard site (Official Land Price, Jan 1) Chuo 5-1 | ¥4.77M | +18.4% | +62.8% | 600% |
| Ginza 3-chome 205-10 | Benchmark site (Prefectural Land Price Survey, Jul 1) Chuo 5-18 | ¥3.65M | +16.2% | — | 600% |
Even within Ginza, there is an 18-fold gap between high- and low-priced points. Dividing them into three price bands and indexing the 17 points with a complete eight-year series from 2019 (2019 = 100), the 8 high-priced points of ¥30M or more had a median of 116.6, the 5 mid-priced points of ¥9M–¥20M 121.7, and the 4 low-priced points under ¥8M 143.5. The lower the price, the faster the recovery from the 2021–2022 decline. In 2026 as well, the median YoY change was +11.3% for high- and mid-priced points versus +14.2% for low-priced points, and the benchmark site “Ginza 7-chome 205-14” rose +19.5%, the highest rate among Ginza’s 19 points.
Figure 2. Official land prices in Ginza: index by price band (2019 = 100, median of each band; high N=8, mid N=5, low N=4 points; only points with all eight years). Source: compiled by MetroEngines Research & Consulting from the MLIT Real Estate Information Library
Overlaying the hotel plans, most of the 16 sites are not near the high-priced points but in blocks close to mid- and low-priced points in 7- and 8-chome and in 1–3-chome (13 of the 16 sites have a nearest official land price point below ¥20M per m²). The period of strong land-price growth at low-priced points coincides with the run of hotel plans in these blocks. However, official land prices are appraisals of individual points and do not represent the acquisition price of any particular planned site. In a separate analysis of 394 transactions in 10 markets, commercial land traded at 0.86 times the official land price, and at 1.19 times for the top 25%. In the estimates below, we use land prices not as the economics of any specific site but as a guide to “how much per room it costs to build a hotel on land in this price band in Ginza.”
Land cost per room — ¥21.8M at a ¥5.45M point, ¥210M at a ¥52.5M point
Land cost per room is obtained as “land price × site area ÷ number of rooms.” Site area ÷ number of rooms can be rewritten as “floor area per room ÷ floor-area multiple,” so setting the floor-area multiple at 10x, the median of Ginza’s plans, gives land cost per room = land price × floor area per room ÷ 10. Floor area per room, including common areas, was set at 40 m² for limited-service and 70 m² for full-service hotels. The latter is close to Pullman Tokyo Ginza’s published figures (9,990 m² for 145 rooms = 68.9 m²).
For the construction cost of the building itself, we applied the 2025 average for steel-frame (S) construction based on MLIT’s Building Construction Starts Statistics, ¥2.405M per tsubo (3.3 m²), to limited-service hotels, and this article’s assumed value of ¥3.3M per tsubo, intended to reflect the luxury tier, to full-service hotels. In addition, since completions are concentrated in 2028–2029, we set the midpoint of the construction period at 2028 and compounded Turner & Townsend’s construction cost forecasts (+5.3% for 2026 and +5.0% for 2027) together with this article’s assumption of +4.5% for 2028, reflecting an expected slowdown in growth (+15.5% vs. 2025). Construction cost per room for a limited-service hotel is ¥29.1M on a 2025-actual basis and ¥33.62M after inflation.
| Land price (2026, per m²) | Reference point | Land cost per room | Construction cost (after inflation) | Investment per room | Land share |
|---|---|---|---|---|---|
| ¥5.45M | Ginza 7-chome 205-14 (benchmark site) | ¥21.8M | ¥33.62M | ¥55.42M | 39.3% |
| ¥10.1M | Ginza 7-chome 5-2 (benchmark site) | ¥40.4M | ¥33.62M | ¥74.02M | 54.6% |
| ¥19.7M | Ginza 3-chome 3-1 (standard site) | ¥78.8M | ¥33.62M | ¥112.42M | 70.1% |
| ¥52.5M | Ginza 2-chome 2-19 et al. (benchmark site) | ¥210.0M | ¥33.62M | ¥243.62M | 86.2% |
At a point priced at ¥5.45M, land is only 39.3% of per-room investment, and construction cost is the larger component. The land share rises to 54.6% at ¥10.1M, 70.1% at ¥19.7M and 86.2% at ¥52.5M. At high-priced points, per-room investment barely moves even if construction costs are trimmed, and project viability is determined almost entirely by how the land cost is absorbed. Conversely, at low-to-mid points, rising construction costs feed directly into the economics, making the design of price-escalation clauses and procurement methods a key issue—in particular, how increases in construction cost are shared between owner and contractor under the price-escalation provisions of the revised Construction Business Act.
Chuo Ward rates: 12-month average ¥19,100, +9.5% YoY — existing Ginza hotels median ¥30,400
First, the market-side level to compare against required ADR. On MetroEngines Research’s estimated settled ADR, the 12-month average for Chuo Ward as a whole from September 2025 to August 2026 was ¥19,100 (148–152 hotels covered), up +9.5% from ¥17,400 in the prior-year period. By segment, business hotels were ¥17,900 (127–129 hotels, +9.8%) and city hotels ¥40,700 (19–20 hotels, +4.7%). For comparison, Chiyoda Ward was ¥16,300, Minato Ward ¥17,700 and Taito Ward ¥14,400, placing Chuo Ward in a higher rate band than all three.
Figure 3. Chuo Ward estimated settled ADR, monthly (overlaid by year, median of all segments, 148–152 hotels, settled months September 2024–August 2026). Source: MetroEngines Research & Consulting
Monthly, April 2026 at ¥23,800 was the peak of the last 24 months, and there is clear seasonality: higher in autumn (October–November) and spring (March–April), lower in summer. Meanwhile, June–August 2026 came in 5.5%, 6.8% and 15.0% below the same months a year earlier. Although the 12-month average exceeds the prior year, summer rates have not grown as much as last year, so seasonal rate swings also need to be factored in ahead of the cluster of openings in 2028–2030.
Ginza itself sits well above the area as a whole. Of the 39 hotels and 6,902 rooms in Ginza 1–8-chome with sales confirmed in at least 10 of the last 12 months, the 32 hotels (6,003 rooms) for which estimated settled ADR can be calculated had a median 12-month average of ¥30,400, a lower quartile of ¥22,100 and an upper quartile of ¥39,400. Among the 32 hotels with a full prior-year comparison, the median change was +4.2%, and 24 hotels were above the prior year. Note that upper-tier hotels (deluxe, etc.) outside the scope of estimated settled ADR are not included in this distribution, so the upper end of Ginza’s rate distribution is in fact wider still.
Working back to required ADR — limited-service opportunities in low-to-mid land-price bands
Multiplying per-room investment by the target yield gives the annual net operating income (NOI) required per room. Dividing this by the NOI ratio to room revenue converts it back to annual room revenue, and dividing by 365 days × occupancy gives the required ADR. The target yield is based on the 4.1% expected yield for limited-service hotels in Tokyo from the Japan Real Estate Institute’s 54th Real Estate Investor Survey (as of April 2026), with three cases at ±0.5 pt. Occupancy was set at 80%, reflecting the 81.5% for Tokyo business hotels in the Japan Tourism Agency’s Overnight Travel Statistics Survey (2025 final figures), and the NOI ratio at 35% of room revenue.
| Land price (per m²) | Yield 3.6% | Yield 4.1% (base) | Yield 4.6% | Ref.: at 2025 construction cost (4.1%) | Existing Ginza hotels (of 32) at or above base |
|---|---|---|---|---|---|
| ¥5.45M | ¥19,500 | ¥22,200 | ¥24,900 | ¥20,400 | 22 hotels |
| ¥10.1M | ¥26,100 | ¥29,700 | ¥33,300 | ¥27,900 | 17 hotels |
| ¥19.7M | ¥39,600 | ¥45,100 | ¥50,600 | ¥43,300 | 4 hotels |
| ¥52.5M | ¥85,800 | ¥97,700 | ¥109,700 | ¥95,900 | 0 hotels |
Figure 4. Required ADR by land-price band (limited-service and full-service, yield 4.1%) and market rate levels. Full-service: 70 m² of floor area per room, construction cost ¥3.3M/tsubo × 1.155, occupancy 77% (full-year assumption; 2025 full-year actual for Tokyo city hotels: 77.2%), NOI = room revenue × 30%. Source: MetroEngines Research & Consulting
The required ADR of ¥22,200 at a ¥5.45M point is above Chuo Ward’s overall ¥19,100 but below the ¥30,400 median of existing Ginza hotels, and 22 of the 32 existing hotels with an estimated settled ADR are already selling at or above this level. The ¥29,700 at a ¥10.1M point is also roughly in line with the existing median. In other words, in Ginza’s low-to-mid land-price bands, even a limited-service hotel reaches its target yield if it can ride Ginza’s existing rate band—which is where investment opportunities appear to concentrate. The small-site plans due for completion in 2026–2027 sit squarely in this zone.
At a ¥19.7M point, by contrast, the required ADR is ¥45,100, and only 4 of the 32 existing hotels reach it. At a ¥52.5M point it is ¥97,700, which is hard to make work with a limited-service configuration. At high-priced points, the prerequisite is full-service or luxury formats that can command higher per-room rates, or mixed-use designs that devote the lower floors to retail and share the land cost through rental income. We also estimate required ADR levels for converting existing commercial floors to hotels in Department Store Sites: 6 of 14 Go Hotel, ADR Needs 1.4-3.1x Market. That 4 of the 7 large plans include retail, restaurants or parking is consistent with this structure.
For full-service hotels (70 m² of floor area per room), the required ADR is ¥57,800 even at the low ¥5.45M point and ¥73,600 at ¥10.1M. These far exceed the ¥40,700 median for Chuo Ward city hotels, so full-service viability presupposes pricing as an upper-tier format capturing high-spending inbound demand, rather than the existing city-hotel rate band. That Mitsubishi Corporation Urban Development has stated an upscale-to-luxury hotel development for its Ginza 8-chome plan is consistent with this back-calculation.
| Sensitivity axis | ¥5.45M | ¥10.1M | ¥19.7M | ¥52.5M |
|---|---|---|---|---|
| Occupancy 75% (full year) | ¥23,700 | ¥31,700 | ¥48,100 | ¥104,300 |
| Occupancy 80% (full year, base) | ¥22,200 | ¥29,700 | ¥45,100 | ¥97,700 |
| Occupancy 85% (full year) | ¥20,900 | ¥27,900 | ¥42,400 | ¥92,000 |
| NOI ratio 30% | ¥25,900 | ¥34,600 | ¥52,600 | ¥114,000 |
| NOI ratio 40% | ¥19,500 | ¥26,000 | ¥39,500 | ¥85,500 |
Moving occupancy by 5 pt shifts required ADR by about 6–7%, while moving the NOI ratio by 5 pt shifts it by about 12–17%. The latter is more sensitive because the NOI ratio sums up operating profitability (labor costs, distribution fees, rent structure). In locations like Ginza, where land carries a large weight, operational measures that raise the NOI ratio—such as increasing the direct-booking share to curb distribution fees—not just rate setting, are the lever that can widen the viable land-price bands by a notch.
Table 5 moves only one assumption at a time, but in practice occupancy and the NOI ratio move together. Table 6 shows combinations moving both at once for a ¥10.1M point, close to the existing Ginza median. At 85% occupancy (full year) and a 40% NOI ratio, required ADR falls to ¥24,500, and 21 of the 32 existing hotels sell at or above this level. Conversely, at 75% occupancy (full year) and a 30% NOI ratio it is ¥37,000, reached by only 9 existing hotels. Even at the same land price, operating assumptions move the required level from “the upper half of the existing rate band” to “the top 30%.”
| Occupancy (full year) \ NOI ratio | 30% | 35% (base) | 40% |
|---|---|---|---|
| 75% | ¥37,000 (9 hotels) | ¥31,700 (11 hotels) | ¥27,700 (18 hotels) |
| 80% (base) | ¥34,600 (10 hotels) | ¥29,700 (17 hotels) | ¥26,000 (19 hotels) |
| 85% | ¥32,600 (11 hotels) | ¥27,900 (18 hotels) | ¥24,500 (21 hotels) |
How the pipeline overlaps existing supply — 60% of planned floor area in 7- and 8-chome
We tallied the 39 operating hotels (6,902 rooms) in Ginza 1–8-chome by chome and set them alongside the floor area of the 16 planned sites. Existing rooms are concentrated in 6-chome (7 hotels, 1,298 rooms), 7-chome (6 hotels, 1,161 rooms) and 8-chome (6 hotels, 1,118 rooms), followed by 1-chome and 5-chome with about 900 rooms each. On the plan side, 7-chome (4 sites, 36,992 m²) and 8-chome (5 sites, 26,669 m²) together total 63,661 m², or 59.7% of floor area. Since 7- and 8-chome account for 33.0% of existing rooms, new floor space is skewed further south (toward Shimbashi) than existing supply.
Figure 5. Existing rooms (39 operating hotels, 6,902 rooms) and planned floor area (16 sites, 106,604 m²) by chome in Ginza. No plans in 4–6-chome. Source: MetroEngines Research & Consulting (based on confirmed OTA listings, N=39 hotels) / MLIT Building Dynamics Statistics Survey
2-chome also stands out: existing supply is small at 4 hotels and 506 rooms (7.3% of the total), while plans cover 3 sites and 24,726 m² (23.2%). Two of these are a roughly 20,000 m²-class plan (the Ginza Boeki Building Redevelopment Plan) and a roughly 4,000 m²-class plan, so a new cluster may emerge on Ginza’s northern side. Meanwhile, no new plans were found within the scope of this tally in 4–6-chome, where existing supply is dense. Rather than new floor space piling onto blocks where hotels already cluster, it spreads into blocks with thin supply—a positive factor for the market’s overall absorption capacity, since it makes head-to-head competition for the same guests between existing and new hotels less likely.
Figure 6. The 16 hotel plan sites in Ginza (blue numbers = No. in Table 1), 39 existing operating hotels (gray; circle size = rooms) and 19 official land price points (small navy circles; values in units of ¥10,000 per m²). Source: MetroEngines Research & Consulting / MLIT Real Estate Information Library
By opening date, 29 of the 39 existing hotels (5,217 rooms, 75.6% of rooms) opened in 2014 or later or reopened after a rebrand. Ginza already went through one supply wave centered on limited-service hotels in the late 2010s, and most of those hotels continue to sell in the current rate band (median ¥30,400). The wave of large sites from H2 2028 differs from the previous one in scale and format, and is likely to be configured to capture a higher rate band.
Figure 7. Rooms of existing operating hotels in Ginza by opening period (N=39 hotels, 6,902 rooms; opening dates include reopenings after rebrands; excludes 1 hotel with 14 rooms whose opening date is unknown). Source: MetroEngines Research & Consulting
Conclusion — Ginza land decisions hinge on the “land-price band × hotel type” combination
Ginza’s hotel pipeline comprises 16 sites and 106,604 m², split into a 2027 wave of small sites and a wave of large sites peaking in H2 2029. Converting land prices, which span 18x from ¥3.65M to ¥67.1M per m², into land cost per room, the required ADR for a limited-service hotel is ¥22,200 at a ¥5.45M point and ¥29,700 at ¥10.1M, within range of the ¥30,400 median of existing Ginza hotels. The low-to-mid land-price bands are serving, as in the late 2010s, as the home for limited-service hotels—investment opportunities that can work at existing rates.
Above ¥19.7M, by contrast, the required ADR for a limited-service hotel is ¥45,100 or more, making designs that share the land cost through full-service or upper-tier formats or combinations with retail floors a prerequisite. Given that 4 of the 7 large plans are mixed-use, and that land prices are rising fastest at the lower-priced points, the shortcut to judging viability when evaluating hotel land in Ginza is to first check “which hotel type, in that land-price band, brings required ADR within the existing rate distribution”—rather than the land price itself.
Frequently Asked Questions (FAQ)
Q1. How many hotels are planned in Ginza?
According to building plan data based on the MLIT Building Dynamics Statistics Survey and other sources, hotel-use plans in Ginza 1–8-chome, Chuo-ku, with scheduled completion from December 2026 to March 2030 cover 16 sites (after consolidating duplicate rows) and a total floor area of 106,604 m². This is a lower bound on a building-confirmation-application basis and may increase as further applications are filed.
Q2. Do any of the new hotel plans in Ginza disclose room counts?
Almost none of the building plans state a room count. For the plan at Ginza 8-chome 16, Accor has announced Pullman Tokyo Ginza with 145 rooms, scheduled to open at the end of 2027. For the others, floor area is the appropriate measure.
Q3. How much land cost per hotel room do Ginza land prices imply?
Assuming 40 m² of floor area per room and a floor-area multiple of 10x, land cost per room = land price × 4. On 2026 official land prices, that is ¥21.8M at a ¥5.45M/m² point, ¥40.4M at ¥10.1M/m², and ¥210M at a ¥52.5M/m² point.
Q4. What room rate does a limited-service hotel in Ginza need?
In this article’s estimate, which factors in rising construction costs and assumes a 4.1% yield, 80% occupancy (full year) and a 35% NOI ratio, it is ¥22,200 at a ¥5.45M/m² point and ¥29,700 at ¥10.1M/m² (both tax-excluded equivalent). The median estimated settled ADR of 32 existing Ginza hotels is ¥30,400, so in the low-to-mid land-price bands the required level is reachable within the existing rate band.
Q5. Is the redevelopment of the former Tsukiji Market site included?
No. The market-site redevelopment in Tsukiji 5-chome is a large integrated development including two hotel buildings, a different kind of project from Ginza’s small and mid-sized sites. Separately, 7 hotel plans totaling 10,149 m² are registered in Tsukiji 1–7-chome.
■ Estimate Assumptions
(1) Land cost per room = official land price (2026) × floor area per room ÷ floor-area multiple. The floor-area multiple is 10x, the rounded median (9.9x) of 14 Ginza plans that state site area. (2) Floor area per room: 40 m² for limited-service, 70 m² for full-service (with reference to Pullman Tokyo Ginza’s published 68.9 m²). (3) Construction cost: for limited-service, the 2025 S-construction figure of ¥2.405M/tsubo based on MLIT Building Construction Starts Statistics; for full-service, this article’s assumed value of ¥3.3M/tsubo, intended to reflect the luxury tier. With the midpoint of the construction period set at 2028, costs are adjusted by compounding Turner & Townsend forecasts (+5.3% for 2026, +5.0% for 2027) and this article’s assumption of +4.5% for 2028 (×1.155). (4) Target yield (NOI yield): three cases of 3.6%, 4.1% and 4.6%, based on the 4.1% expected yield for limited-service hotels in Tokyo from the Japan Real Estate Institute’s 54th Real Estate Investor Survey (as of April 2026). (5) Occupancy: 80% for limited-service and 77% for full-service (with reference to 81.5% for Tokyo business hotels and 77.2% for Tokyo city hotels in the Japan Tourism Agency’s Overnight Travel Statistics Survey, 2025 final figures). (6) NOI = annual room revenue × 35% for limited-service and 30% for full-service. Food and beverage, banquet and retail rent are not included. (7) Design fees, FF&E, pre-opening costs, interest and the ramp-up of taxes and public charges are not included, so required ADR is a guide close to the lower bound. (8) Comparisons with existing hotels use the 12-month average estimated settled ADR (September 2025–August 2026; hotels with at least 10 months calculable).
Related Articles
References and Sources
■ Data sources
Building plans: plans on a building-confirmation-application basis based on the MLIT Building Dynamics Statistics Survey and other sources (as of September 25, 2026; 38 hotel-use rows in Ginza, Chuo-ku, with scheduled completion in October 2026 or later, consolidated into 16 sites). Official land prices: Official Land Prices and Prefectural Land Price Survey from the MLIT Real Estate Information Library (2019–2026, 19 commercial points in Ginza 1–8-chome). Estimated settled ADR: monthly estimates by MetroEngines Research & Consulting (148–152 hotels in Chuo Ward, 32 existing Ginza hotels, settled months September 2024–August 2026). Existing supply: 39 hotels and 6,902 rooms in Ginza 1–8-chome with sales confirmed in at least 10 of the last 12 months (based on confirmed OTA listings). Occupancy: Japan Tourism Agency, Overnight Travel Statistics Survey, 2025 final figures (Table 8, annual). Expected yield: Japan Real Estate Institute, 54th Real Estate Investor Survey.
■ Limitations and caveats
Most building plans do not state room counts, so they are treated by floor area, and per-room estimates depend on the 40 m² and 70 m² floor-area assumptions. The 10x floor-area multiple is the rounded median of 14 sites (6.1–13.1x), so land cost varies up or down for individual sites. Official land prices are appraisals of individual points, not acquisition prices of planned sites. The +4.5% construction cost growth for 2028 and the ¥3.3M/tsubo for full-service are this article’s assumptions. Estimated settled ADR is an estimate with a median error of about 7% against REIT-disclosed results, and upper-tier formats such as deluxe are not included in the existing-hotel distribution. Scheduled completions may change with construction costs and interest rates at groundbreaking, so the H2 2029 peak should be read as of the planning stage.
■ Market data
- MetroEngines Research & Consulting — Estimated settled ADR (Chuo, Chiyoda and Taito wards, settled months September 2024–August 2026, 19–177 hotels covered); operating hotels in Ginza 1–8-chome (based on confirmed OTA listings, N=39 hotels, 6,902 rooms)
■ Government statistics and public data
- Compiled by MetroEngines Research & Consulting from the MLIT Building Dynamics Statistics Survey — hotel building plans in Ginza 1–8-chome (16 sites, as of September 25, 2026)
- MLIT Real Estate Information Library — Official Land Prices and Prefectural Land Price Survey (2019–2026)
- MLIT, Prefectural Land Price Survey
- MLIT, 2026 Official Land Prices (Reiwa 8)
- Japan Tourism Agency, Overnight Travel Statistics Survey 2025 (final figures), Table 8: Occupancy
- MLIT, Building Construction Starts Statistics
■ Industry reports
■ News and press releases
- Accor to open Pullman Tokyo Ginza at the end of 2027 (PR TIMES, December 2024)
- Mitsubishi Corporation Urban Development: notice of launch of the Ginza 8-chome, Chuo-ku hotel development project (April 24, 2025)
- MLIT releases benchmark land prices: national land prices rise for a 5th straight year (Kenbiya, September 15, 2026)
- [Benchmark Land Prices 2026] Ginza Meidi-ya at “¥52.5M per m²” (Gold Online)