

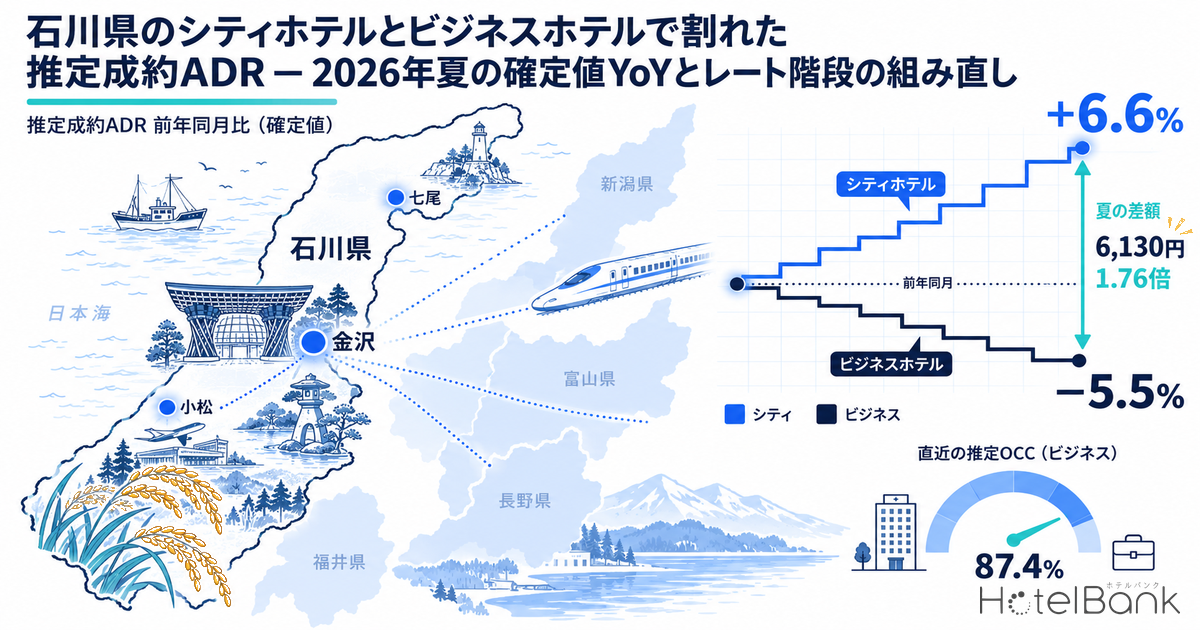
In Ishikawa Prefecture’s hotel market, prices moved in different directions by category in summer 2026. Comparing our estimated settled ADR (monthly, finalized) with the same month a year earlier, city hotels (N=10 properties) were up for three straight months — +7.8% in June, +7.4% in July and +5.1% in August — while business hotels (N=109–110 properties) were down for three straight months: −4.7% in June, −6.8% in July and −4.9% in August. On a June–August average, city hotels rose +6.6% against −5.5% for business hotels: within the same prefecture, the upper category grew its rates while the lower category gave rate up. This article examines how the split emerged month by month, how far the price gap between the two categories (the step in the rate ladder) widened, and how estimated business-hotel occupancy and October booking pace corroborate it, then sets out pricing strategy for a market whose categories are moving in opposite directions.
Coverage: city hotels in Ishikawa Prefecture, N=10 properties; business hotels, N=107–110 properties (varies by month). The price metric in this article is estimated settled ADR (the settled price level estimated from OTA and other sales data, tax-excluded equivalent); occupancy is an estimate based on OTA-listed inventory. Definitions for both are at the end of the article. Data as of October 2, 2026.
• ADR (average daily rate) = an estimated settled rate (tax-excluded equivalent), calculated by applying a property-type correction factor to the lowest-priced plan each property publishes on OTAs (two guests per room, per-room rate, tax included). These are estimates and differ from each property’s actual settled prices and accounting figures.
• Area-level ADR (prefecture or municipality) is the median estimated settled rate of the properties covered (the level of a typical property in the area).
• Where listed prices are mentioned, they are the per-room rate for two guests per room (tax included).
• OCC (occupancy) = rooms sold as a share of total rooms in the area (an estimate based on OTA sales inventory).
• Source: MetroEngines Research (continuously tracks published OTA prices for about 27,000 verified operating properties in Japan). For details on accuracy, sample sizes and data dates, see “About the Data” at the end of the article.
- — In June–August 2026, estimated settled ADR (finalized) moved in opposite directions year on year: city hotels +6.6% (N=10 properties), business hotels −5.5% (N=109–110 properties).
- — The same-month gap between city and business hotels widened by ¥1,000 or more in each of June, July and August, reaching ¥6,130 (1.76x) in August.
- — Business hotels in the four neighboring prefectures (Toyama, Fukui, Niigata, Nagano) rose +3.9% to +9.0% year on year on a June–August average. Of the five prefectures, only Ishikawa saw business-hotel rates fall.
- — Estimated business-hotel OCC (based on OTA-listed inventory) rose from 79.3% in July 2026 to 87.4% in September. For the night of Saturday, October 10, 75.4% was already filled 45 days out.
- — RevPAR could only have held at last year’s level if prior-year estimated OCC for August was 80.4% or lower. The starting point is to re-defend rates, beginning with weekends.
Monthly YoY — both sank in winter, rose together in spring, and split from June
First, we compare each of the eight finalized months of January–August 2026 with the same month a year earlier. At the start of the year both city and business hotels were below the prior year: in January city hotels were ¥9,176 (prior year ¥9,902, −7.3%) and business hotels ¥6,837 (prior year ¥6,899, −0.9%), and February also saw lower levels, with city −7.6% and business −3.8%. Up to this point the market read as “the whole prefecture is weaker than last winter.”
The trend changed from March. City hotels began to exceed the prior year with ¥12,528 in March (+4.3%) and ¥14,972 in April (+4.6%), and in May posted the year’s largest gain at ¥15,680 (prior year ¥14,046, +11.6%). Business hotels moved the same way, rising to ¥8,344 in April (+3.9%) and ¥8,750 in May (+2.8%), so during the spring demand season both categories were able to capture rate together.
From June, however, the two moved apart. City hotels sustained their gains at ¥10,081 in June (+7.8%), ¥11,878 in July (+7.4%) and ¥14,204 in August (+5.1%), whereas business hotels stayed below the prior year in all three months: ¥6,994 in June (prior year ¥7,338, −4.7%), ¥7,224 in July (prior year ¥7,755, −6.8%) and ¥8,074 in August (prior year ¥8,486, −4.9%). On a January–August cumulative average, city hotels were ¥12,275 (prior year ¥11,834, +3.7%) and business hotels ¥7,582 (prior year ¥7,721, −1.8%), so the year-to-date record diverges too. How this split first emerged in the first half (January–July) is tracked finalized month by finalized month in Ishikawa ADR H1 2026: City +3.6%, Business −1.3%, a 14.2pt Gap.
| Month | City 2025 | City 2026 | YoY | Business 2025 | Business 2026 | YoY |
|---|---|---|---|---|---|---|
| Jan | ¥9,902 | ¥9,176 | −7.3% | ¥6,899 | ¥6,837 | −0.9% |
| Feb | ¥10,476 | ¥9,678 | −7.6% | ¥7,173 | ¥6,900 | −3.8% |
| Mar | ¥12,006 | ¥12,528 | +4.3% | ¥7,580 | ¥7,535 | −0.6% |
| Apr | ¥14,313 | ¥14,972 | +4.6% | ¥8,028 | ¥8,344 | +3.9% |
| May | ¥14,046 | ¥15,680 | +11.6% | ¥8,511 | ¥8,750 | +2.8% |
| Jun | ¥9,350 | ¥10,081 | +7.8% | ¥7,338 | ¥6,994 | −4.7% |
| Jul | ¥11,063 | ¥11,878 | +7.4% | ¥7,755 | ¥7,224 | −6.8% |
| Aug | ¥13,519 | ¥14,204 | +5.1% | ¥8,486 | ¥8,074 | −4.9% |
| Jan–Aug avg. | ¥11,834 | ¥12,275 | +3.7% | ¥7,721 | ¥7,582 | −1.8% |
Estimated settled ADR, tax-excluded equivalent, all finalized months. City N=10 properties; business N=107–111 properties (2025) / 109–110 properties (2026). The January–August average is the simple mean of the monthly values. Source: MetroEngines Research; compiled by HotelBank Editorial Team
Plotting the years on top of each other shows that the seasonal shape of both categories has not changed much from last year. City hotels follow a two-peak pattern, with peaks in April–May and October–November and troughs in June and December–February; business hotels are also high in April–May and October–November, and their 2025 peak was ¥9,465 in November. In 2026 that shape holds, but from June the city line has moved above last year’s while the business line has moved below it. Same shape, different heights: that is Ishikawa this summer.
Figure 1: Ishikawa Prefecture estimated settled ADR, year over year (January–December). 2026 shows finalized values for January–August only. City N=10, business N=107–111. Source: MetroEngines Research; compiled by HotelBank Editorial Team
Figure 2: Estimated settled ADR, year on year (January–August 2026, finalized months compared with finalized months). Source: MetroEngines Research; compiled by HotelBank Editorial Team
Note that September onward are estimates based on current sales, so a straight comparison with finalized values has to wait until those months close. Every YoY figure in this article compares finalized months with finalized months.
The step in the rate ladder — the June–August price gap widened by ¥1,000 or more
In practical terms, the split matters because it widened the step in the “rate ladder” between city and business hotels. Comparing the same-month gap in estimated settled ADR between the two categories with last year, it widened by more than ¥1,000 in every month: from ¥2,012 to ¥3,087 in June, from ¥3,308 to ¥4,654 in July and from ¥5,033 to ¥6,130 in August. As a multiple, it went from 1.27x to 1.44x in June, 1.43x to 1.64x in July and 1.59x to 1.76x in August, so city hotels’ price relative to business hotels sat higher than a year earlier in all three months.
| Month | Gap 2025 | Gap 2026 | Change in gap | Multiple 2025 | Multiple 2026 |
|---|---|---|---|---|---|
| Apr | ¥6,285 | ¥6,628 | +¥343 | 1.78x | 1.79x |
| May | ¥5,535 | ¥6,930 | +¥1,395 | 1.65x | 1.79x |
| Jun | ¥2,012 | ¥3,087 | +¥1,075 | 1.27x | 1.44x |
| Jul | ¥3,308 | ¥4,654 | +¥1,346 | 1.43x | 1.64x |
| Aug | ¥5,033 | ¥6,130 | +¥1,097 | 1.59x | 1.76x |
Gap = city estimated settled ADR − business estimated settled ADR; multiple = city ÷ business. All finalized months. Source: MetroEngines Research; compiled by HotelBank Editorial Team
One piece of background worth noting is that business-hotel supply is growing. In our property data, 15 lodging facilities with 541 rooms in Ishikawa Prefecture had a 2026 opening date recorded as of October 1, of which 2 business hotels with 447 rooms (one in Komatsu in July, one in Kanazawa in September) account for over 80% of the rooms. The count of openings is based on confirmed OTA listings, and openings in the most recent months may rise as further listings are confirmed. The number of business hotels in the prefecture covered by our price tracking also grew from 111 in 2025 to 117 in August 2026 (110 of them used for estimated settled ADR), so with more rooms splitting the same demand, the business category was likely inclined to put occupancy ahead of rate. City hotels, by contrast, are a small sample of 10 properties and appear to have moved to capture the full rate of spring-to-summer leisure demand.
Comparison with four neighboring prefectures — Ishikawa is the only one where business hotels fell year on year
To check whether this split is common across Hokuriku and Koshinetsu, we lined up estimated settled ADR for the same categories in the four neighboring prefectures (Toyama, Fukui, Niigata, Nagano) over the same finalized months (June–August of 2025 and 2026). Business hotels were up year on year in all four (+3.9% to +9.0%), so of the five prefectures only Ishikawa saw a decline. Among city hotels, Fukui rose +11.4%, more than Ishikawa, while Toyama, Niigata and Nagano were below the prior year. The combination “city up, business down” appears only in Ishikawa among the five, which is hard to explain by the strength or weakness of regional demand alone. The fall in Ishikawa’s business-hotel rates is best read together with factors specific to the prefecture (rising supply and changes in guest mix).
| Prefecture | City YoY | City N | Business YoY | Business N |
|---|---|---|---|---|
| Ishikawa | +6.6% | 10 properties | −5.5% | 109–110 properties |
| Toyama | −1.8% | 16 properties | +4.5% | 71–72 properties |
| Fukui | +11.4% | 14 properties | +9.0% | 45–47 properties |
| Niigata | −8.7% | 18 properties | +4.8% | 124–126 properties |
| Nagano | −4.1% | 16 properties | +3.9% | 166–167 properties |
YoY compares the three-month averages of June–August estimated settled ADR (tax-excluded equivalent, finalized months). N is the number of properties used for estimated settled ADR in June–August 2026. Source: MetroEngines Research; compiled by HotelBank Editorial Team
Putting this together, the step widened because city hotels raised rates and business hotels cut them; neither alone explains the move. Next, we use estimated business-hotel occupancy and recent booking pace to check whether the rate given up was made back in occupancy.
Business-hotel occupancy and October booking pace — occupancy is high, and weekends are already three-quarters full 45 days out
Estimated business-hotel OCC (based on OTA-listed inventory; 69–71 properties / about 9,300 rooms; based on listings on the main booking sites) for July–September 2026 was a monthly average of 79.3% in July, 84.5% in August and 87.4% in September, stepping up from summer into autumn. By day of week, Friday–Saturday was 83.4% in July, 86.2% in August and 89.1% in September, and Sunday–Thursday was 77.6%, 83.7% and 86.8%, so the weekend–weekday gap narrowed from 5.8pt in July to 2.3pt in September. The monthly average rose as weekdays were lifted. Rates below the prior year, yet rooms selling: that was the reality for business hotels in June–August.
| Stay month | Monthly avg. | Fri–Sat | Sun–Thu | Weekend − weekday | Properties / rooms |
|---|---|---|---|---|---|
| Jul 2026 | 79.3% | 83.4% | 77.6% | 5.8pt | 70 properties / 9,336 rooms |
| Aug 2026 | 84.5% | 86.2% | 83.7% | 2.5pt | 69 properties / 9,318 rooms |
| Sep 2026 | 87.4% | 89.1% | 86.8% | 2.3pt | 71 properties / 9,353 rooms |
Estimated OCC for each stay date, split by day of week and simple-averaged. Properties and rooms are the median within the month. Source: MetroEngines Research; compiled by HotelBank Editorial Team
Recent booking pace shows the same pattern. For the night of Saturday, October 10, estimated OCC was 75.4% at 45 days out, 84.6% at 30 days out and 89.3% at the latest reading (9 days out), building 13.9pt over the observation window. Weekends are already three-quarters full 45 days out and then add gradually. Wednesday, October 14, a weekday, was 57.3% at 45 days out, 63.5% at 30 days out and 73.6% at the latest reading (13 days out), building 16.3pt over the same window — a larger gain than the weekend. Weekdays start slowly and pick up late; weekends fill early and add less at the end. The difference in pace is clear.
Figure 3: Ishikawa Prefecture business-hotel booking curves (estimated OCC, based on OTA-listed inventory) — Saturday, October 10 and Wednesday, October 14; 71 properties / 9,378 rooms. Observed from 45 days before the stay date to the latest reading. Source: MetroEngines Research; compiled by HotelBank Editorial Team
Setting this high occupancy and early booking against the year-on-year fall in estimated settled ADR, June–August for business hotels reads as a phase of “giving up rate to take occupancy.” In a market where weekends are more than 75% full 45 days out, there may have been little need to give up rate, at least on weekends. That is the starting point for the pricing strategy in the next section.
So was the rate given up recovered through occupancy? The estimated OCC cohort has only been observed for stay dates from March 2026, so it cannot be compared directly with prior-year estimated OCC. Instead, we set prior-year estimated OCC as an assumed value and, dividing by the year-on-year change in estimated settled ADR, worked back to the estimated OCC needed this year to bring RevPAR back to the prior-year level (Table 5). Set against this year’s actuals, if prior-year estimated OCC was above 73.9% in July or above 80.4% in August, RevPAR comes out below the prior year. In other words, unless prior-year estimated OCC was at least 5.4 points lower than this year in July and at least 4.1 points lower in August, the extra occupancy alone could not have made up for the lower rates.
| Prior-year estimated OCC (assumed) | ADR YoY −3.0% | ADR YoY −4.9% (Aug) | ADR YoY −5.5% (Jun–Aug) | ADR YoY −6.8% (Jul) |
|---|---|---|---|---|
| 70% | 72.2% | 73.6% | 74.1% | 75.1% |
| 75% | 77.3% | 78.9% | 79.4% | 80.5% |
| 80% | 82.5% | 84.1% | 84.7% | 85.8% |
| 85% | 87.6% | 89.4% | 89.9% | 91.2% |
Required estimated OCC this year = prior-year estimated OCC (assumed) ÷ (1 + year-on-year change in estimated settled ADR). Approximates RevPAR = ADR × OCC and does not account for changes in room count. This year’s actuals: estimated OCC for Ishikawa business hotels was 79.3% in July 2026 and 84.5% in August (based on OTA-listed inventory). Source: MetroEngines Research; compiled by HotelBank Editorial Team
For revenue managers running city and business hotels in Ishikawa — implications and action plan
Operational insights
1. Which line does your summer follow?In Ishikawa, city hotels were +6.6% and business hotels −5.5% in June–August, moving in opposite directions. Start by checking which line your own settled rate for the period is closer to year on year. If you are a business hotel that came in below last year, set that against the fact that market estimated OCC rose from 79.3% in July to 87.4% in September: the question is whether your property gained enough occupancy to justify the rate you gave up. If you are a city hotel that came in above last year, note that the gain narrowed from +11.6% in May to +5.1% in August; there is room to review whether your settings can sustain growth into the autumn peak (October–November last year).
2. Measure the step in the rate ladder with market numbers.The fact that the price gap between city and business hotels in the same area widened by more than ¥1,000 is a reference point for pricing upper-tier rooms at business hotels and lower-tier rooms at city hotels. The market step was ¥4,654 (1.64x) in July and ¥6,130 (1.76x) in August. If you are a city hotel, position your floor against the business-hotel market level (¥7,224 in July, ¥8,074 in August); if you are a business hotel, position how far your upper-tier rooms can reach against the city-hotel market level (¥11,878 in July, ¥14,204 in August), all within this step. When the step widens, opportunities tend to open up for room types that fill the price band left between the two categories (the top of business, the bottom of city).
3. Defend the lower category’s prices from the weekends.In October booking pace for business hotels, weekends fill early, at 75.4% 45 days out and 84.6% 30 days out, while weekdays start slowly at 57.3% 45 days out and 63.5% 30 days out. As an order for defending price, one approach is to set weekend rates first, since they fill early, and adjust weekdays step by step while watching the late pickup (10.1pt from 30 days out to the latest reading for October 14). Rather than restoring the rates that fell below last year in June–August across the board, separate the days to defend from the days to go after by day of week.
4. Build tax thresholds into the ladder design.Kanazawa City’s accommodation tax is assessed on the tax-excluded room charge per person per night. For stays from October 2024 it has three tiers: under ¥5,000 is exempt, ¥5,000 to under ¥20,000 is ¥200, and ¥20,000 and over is ¥500. When building the rate ladder, which side of these thresholds the per-person rate falls on feeds directly into the guest’s total payment, so check the steps not only by room rate but also by per-person rate for each occupancy.
| Timeframe | Action | Decision trigger (figures from this article) | Aim |
|---|---|---|---|
| Today–this week | Check your own June–August settled rate year on year and set it against the market lines (city +6.6% / business −5.5%) | If you are a business hotel below last year, and your occupancy is as high as market estimated OCC (84.5% in August, 87.4% in September) | Identify the days and days of week where too much rate was given up |
| Today–this week | Review settings for the remaining October weekends (3 weeks) | If market weekends are filling to 84.6% at 30 days out and 89.3% at the latest reading, and your weekends are filling to a similar degree | Defend rates on days that fill |
| Within 2 weeks | Rebuild the ladder by room type against the market step (¥4,654 in July, ¥6,130 in August) | If business-hotel upper-tier rooms are not placed in the band between the business market level (¥8,074 in August) and the city market level (¥14,204 in August) | Capture the price band left open between categories |
| Within 2 weeks | Check per-person rates by occupancy against the accommodation tax thresholds (¥5,000 and ¥20,000 tax-excluded) | If any room has a two-guest per-person rate sitting just above a threshold | Align the ladder on a total-payment basis |
| For next month | Set rules for late weekday adjustments (watch three points: 45 days out, 30 days out and the latest reading) | If your weekdays are tracking below the market’s 57.3% at 45 days out and 63.5% at 30 days out | Respond early to slow weekday starts |
| For next month | Check ceilings for the November peak against last year’s market values (city ¥15,586, business ¥9,465) | If your November settings remain below last year’s market estimated settled ADR | Capture the full autumn demand season |
All trigger figures are aggregates from this article. Source: MetroEngines Research; compiled by HotelBank Editorial Team
Summary — three yardsticks for a market moving in opposite directions
Summer 2026 in Ishikawa was a phase in which the categories moved in opposite directions: city hotels raised estimated settled ADR +6.6% year on year on a June–August average, while business hotels fell −5.5%. We offer three reusable yardsticks.
The first is whether the directions match. If both categories’ YoY moves in the same direction (April–May this year), prefecture-wide demand explains it; if they split (from June), changes in supply or guest mix should be seen as working differently by category. The second is the width of the step: the same-month gap and multiple between city and business hotels (¥4,654 and 1.64x in July, ¥6,130 and 1.76x in August) give you coordinates for placing your own ladder by room type. The third is the combination of occupancy and rate: a phase like the one business hotels are in, with estimated OCC rising while rates sit below last year, is the signal to check, day of week by day of week, whether the price given up is being recovered in occupancy.
Once autumn’s finalized figures are in, it will be possible to judge whether this split was a summer-only phenomenon or has become a year-round structure. September onward will be compared again once those months are finalized, finalized month against finalized month.
Frequently Asked Questions
Q. How did estimated settled ADR for city and business hotels in Ishikawa move in summer 2026?
A. Comparing finalized June–August values with the same months a year earlier, city hotels (N=10 properties) were +6.6% and business hotels (N=109–110 properties) −5.5%, moving in opposite directions. By month, city hotels were +7.8% in June, +7.4% in July and +5.1% in August; business hotels were −4.7% in June, −6.8% in July and −4.9% in August.
Q. How much did the price gap between city and business hotels (the step in the rate ladder) widen?
A. The same-month gap widened by more than ¥1,000 in all three months: from ¥2,012 to ¥3,087 in June, from ¥3,308 to ¥4,654 in July and from ¥5,033 to ¥6,130 in August. As a multiple, August went from 1.59x to 1.76x.
Q. Are business hotels in neighboring prefectures also below last year?
A. No. On a June–August 2026 average, estimated settled ADR for business hotels was up in all four neighboring prefectures: Toyama +4.5%, Fukui +9.0%, Niigata +4.8% and Nagano +3.9%. Of the five prefectures, only Ishikawa fell year on year.
Q. Was the rate given up made back in occupancy?
A. Prior-year estimated OCC was not observed, so this cannot be confirmed directly. Working back from the year-on-year change in estimated settled ADR, if prior-year estimated OCC was above 73.9% in July or above 80.4% in August, RevPAR comes out below the prior year. Estimated OCC for 2026 (based on OTA-listed inventory) was 79.3% in July and 84.5% in August.
Q. How does Kanazawa City’s accommodation tax relate to rate design?
A. Kanazawa City’s accommodation tax is assessed on the tax-excluded room charge per person per night. For stays from October 2024, under ¥5,000 is not taxed, ¥5,000 to under ¥20,000 is ¥200, and ¥20,000 and over is ¥500. Which tier the per-person rate for each occupancy falls into changes the guest’s total payment.
About the Data
| Item | Details |
|---|---|
| Estimated OCC | Occupancy based on OTA-listed inventory = 100 − 100 × OTA-listed rooms remaining ÷ total rooms. Covers a fixed cohort of properties listing at least 30% of their total rooms on OTAs (the same set of properties for every stay date; the property count is recorded per stay date). It is an estimate based on how inventory sold on OTAs is being absorbed and is defined differently from actual room occupancy (rooms not listed are counted as sold, so it runs high). Estimated OCC in this article covers Ishikawa business hotels (67–72 properties / 9,172–9,468 rooms depending on stay date; monthly medians of 69–71 properties / 9,318–9,353 rooms; 71 properties / 9,378 rooms for the two booking-pace stay dates), for stay months July–September 2026 and, for booking pace, the stay dates of October 10 and October 14, 2026. |
| Booking curves | Based on observations from 45 days before the stay date to the latest reading. |
| Estimated settled ADR | The settled price level (tax-excluded equivalent) estimated from OTA and other sales data (lowest-plan level × property-type factor, ensemble of multiple channels). Past months are finalized values; current and future months are estimates based on current sales. Median error of 6.6% against published operating results. Every YoY figure in this article compares finalized months (January 2025–August 2026). |
| Sample N= | Ishikawa Prefecture city hotels N=10 properties (all months); business hotels N=107–111 properties (2025) / 109–110 properties (January–August 2026). The count of openings covers properties with a 2026 opening date recorded in our property data (as of October 1: 15 properties, 541 rooms). |
| Data as of | Data as of October 2, 2026. Sales and inventory change daily, so the figures in this article are a snapshot at the time of retrieval. |
References and Sources
■ Data sources
Estimated settled ADR is the median, by prefecture and category (city hotel / business hotel), of estimated settled rates (tax-excluded equivalent) obtained by applying property-type factors to the published OTA prices we collect continuously (lowest-plan level, two guests per room, per room). Estimated OCC is the listed-inventory absorption rate for a fixed cohort of business hotels that list at least 30% of their total rooms on OTAs. Booking pace is the same cohort observed from 45 days before each stay date to the latest reading. The comparison with the four neighboring prefectures uses the same method.
■ Calculation assumptions
All YoY figures are calculated between finalized months (January 2025–August 2026); months from September that are still on sale are not used for comparison. June–August YoY is the ratio of the simple averages of the three months’ estimated settled ADR. The required estimated OCC in Table 5 is “prior-year estimated OCC (assumed) ÷ (1 + ADR YoY)”, based on the approximation RevPAR = ADR × OCC, and does not account for changes in room count.
■ Limitations and caveats
City hotels are a small sample of 10 properties, so a price change at a single property can move the prefectural median. Estimated OCC is an estimate based on OTA-listed inventory and counts unlisted rooms as sold, so it runs higher than actual room occupancy. Estimated OCC is observed only for stay dates from March 2026 and cannot be compared with prior-year estimated OCC. The count of openings covers properties with an opening date recorded in our property data; the most recent months may change as further listings are confirmed.
■ References
Kanazawa City, “Notice of Changes to the Kanazawa City Accommodation Tax System (effective October 2024)” https://www4.city.kanazawa.lg.jp/soshikikarasagasu/shiminzeika/gyomuannai/1/4/26669.html