

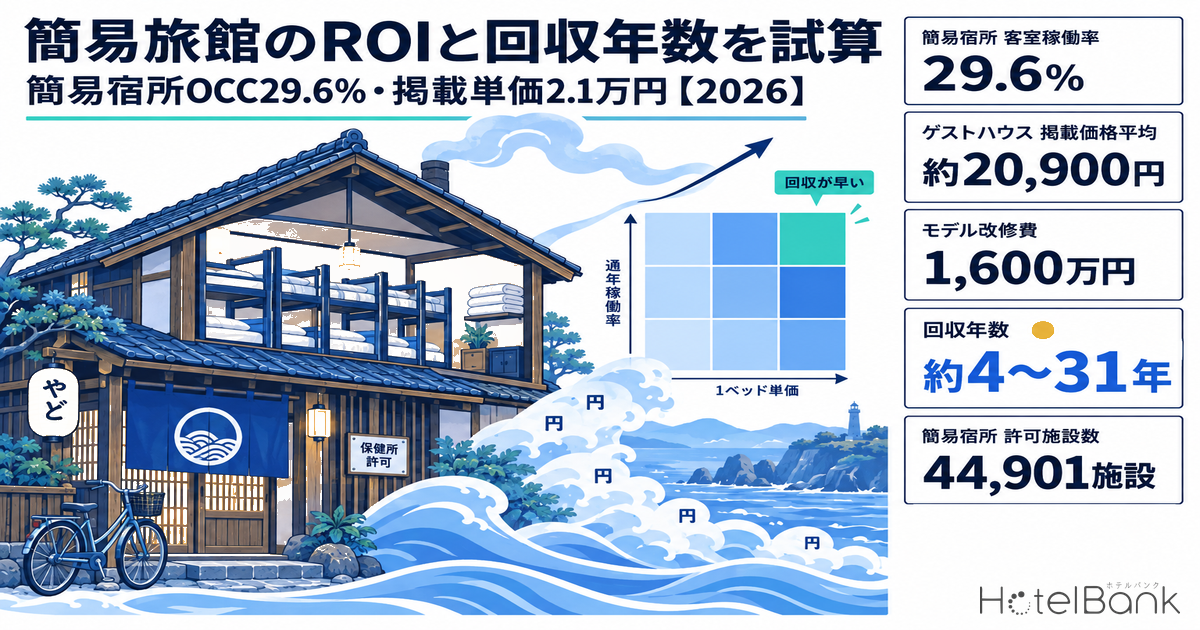
“What is the ROI (return on investment) of a simple inn?” The short answer: in a model with 12 guest capacity and ¥16 million in renovation costs, the payback period ranges from about 4 to 31 years — a nearly eightfold spread depending on how occupancy and the per-bed rate combine. This article first outlines the “simple lodging business” (簡易宿所営業) license under Japan’s Inns and Hotels Act, then combines MetroEngines Research listed prices for September 2026 (guesthouse average of about ¥20,900, N=2,305 properties, etc.), the Japan Tourism Agency’s 29.6% guest-room occupancy for simple lodgings, the Japan Finance Corporation’s management indicators for simple lodgings, and a renovation case published by a municipality to show the sensitivity of the payback period from both the revenue and cost sides.
Metric Definitions Used in This Article
- Listed price (average): Publicly listed selling prices compiled by MetroEngines Research. It is the average per-room rate for two guests sharing one room (tax included), not the median. All plans (room-only through meal-inclusive) are included. It is not an estimated achieved rate (ADR) and differs from actual transaction prices.
- Conversion to a per-bed rate: For dormitory-based (shared-room) formats, we assume the two-guest listed rate covers “two beds” and take half of it as the per-bed rate. Because the average is pulled up by private rooms and higher-priced listings, the going rate for a dormitory bed is likely lower.
- Guest-room occupancy (Japan Tourism Agency): Occupancy by property type from the Japan Tourism Agency’s “Overnight Travel Statistics Survey.” We cite the national, prefectural, and monthly figures for simple lodgings from the 2025 annual data (final figures, released July 6, 2026).
- Year-round occupancy (model assumption): The annual average bed occupancy assumed in this article’s projections. These are not actual results but three assumed levels: 30%, 45%, and 60%.
- Data sources: MetroEngines Research (listed prices); Japan Tourism Agency, Ministry of Health, Labour and Welfare, Japan Finance Corporation, and Suzu City (published materials). September 2026 listed prices are compiled through the survey date (September 27, 2026).
- — In a model with 12 guest capacity and ¥16 million in renovation costs, the payback period for a simple inn is about 4 to 31 years. The combination of year-round occupancy and per-bed rate creates a nearly eightfold spread (projection).
- — Guest-room occupancy for simple lodgings is 29.6% nationwide (2025 final figure), but by prefecture it ranges from 73.6% in Osaka to 8.9% in Akita — the candidate site’s figure should be the starting point.
- — Average listed prices in September 2026 were ¥20,883 for guesthouses (N=2,305) and ¥21,500 for hostels (N=1,985). The per-bed assumption (÷2) gives about ¥10,000, but there are cases where dormitory beds actually go for around ¥3,500.
- — Japan Finance Corporation indicators for simple lodgings show a pre-depreciation ordinary profit margin of 11.2% and a break-even point ratio of 98.7%. A swing of just a few percent in revenue flips profit and loss.
- — The year-round occupancy needed for a 10-year payback is 35–47% at ¥7,000 per bed, but 69–93% at ¥3,500. The assumed rate moves the required occupancy by a factor of two to three (projection).
What Is a Simple Inn? — The “Simple Lodging Business” Under the Inns and Hotels Act
The business format commonly called a “simple inn” (簡易旅館, kan’i ryokan) falls under the “simple lodging business” (簡易宿所営業, kan’i shukusho eigyo) under the Inns and Hotels Act. The Act defines it as “a business that provides facilities whose structure and equipment are mainly designed for the lodging space to be shared by many people, and accommodates guests for a fee.” Mountain huts and youth hostels fall into this category, and most guesthouses, hostels, and capsule hotels operate under this license. There is no minimum number of guest rooms (the minimum room requirement for the ryokan/hotel license was also abolished in the 2018 amendment), and the ease of converting a detached house or small building makes it an entry point for individual investors. The Act has three license categories — ryokan/hotel, simple lodging, and boarding house — and was amended significantly in 2018 and 2023.
The core structural requirement is the total floor area of guest rooms. The rule is 33㎡ or more, but an April 2016 amendment allows a license to be granted “for facilities that accommodate fewer than 10 guests at a time, if the floor area is at least 3.3㎡ per guest multiplied by the number of guests” (Ministry of Health, Labour and Welfare, “Q&A on Private Lodging Services and the Inns and Hotels Act”). Where bunk beds are installed, the gap between the upper and lower bunks must be roughly 1m or more, and bathing, washbasin, toilet, ventilation, and other facilities are also required.
Compared with the frequently contrasted Private Lodging Business Act (the so-called “minpaku” law), the differences are as follows. The biggest difference is whether there is a cap on operating days, which changes the very premise on which a revenue model is built.
| Item | Simple lodging business (Inns and Hotels Act) | Private lodging business (Private Lodging Business Act) |
|---|---|---|
| Procedure | License from the prefecture, etc. (public health center) | Notification to the prefectural governor, etc. |
| Annual operating days | No cap | Up to 180 days per year |
| Guest room area | Total floor area of 33㎡ or more (for fewer than 10 guests: 3.3㎡ × number of guests or more) | 3.3㎡ or more of habitable room per guest |
| Building | Change of use (building confirmation required if lodging use exceeds 200㎡); installation of fire safety equipment | Remains a residence (safety measures depending on size and layout) |
| Implication for the revenue model | Payback plan can assume year-round operation | Cap on operating days tends to lengthen the payback period |
Source: Compiled by the HotelBank Editorial Team from the Ministry of Health, Labour and Welfare, “Q&A on Private Lodging Services and the Inns and Hotels Act”; Japan Tourism Agency, “Minpaku System Portal Site”; and Suzu City, “Guidebook for Opening Lodging Facilities Using Vacant Houses” (March 2020)
On the supply side, the number of licensed simple lodgings keeps rising. According to the Ministry of Health, Labour and Welfare’s “Report on Public Health Administration and Services,” there were 44,901 simple lodging businesses at the end of FY2024, up 2,992 (+7.1%) from the previous year. Over the four years since the end of FY2020 (37,847 facilities), the count has grown by about 7,000, a faster rate than ryokan/hotel businesses (52,946 facilities, +3.7%). A wave of new entrants signals depth of demand, but it also means that, depending on the location, investors need to factor in more competition. How prefectural supply rankings change once these 44,901 facilities are included is examined in Lodging Supply Denominator: 44,901 Simple Lodgings Move Kyoto 21st→5th.
Source: Compiled by the HotelBank Editorial Team from the Ministry of Health, Labour and Welfare, “Overview of the FY2024 Report on Public Health Administration and Services” (as of each fiscal year-end)
Revenue Side, Measured — Guesthouses Average About ¥20,900, Hostels About ¥21,500
In MetroEngines Research’s nationwide data for September 2026, the average listed price was about ¥20,900 for guesthouses (N=2,305 properties), about ¥21,500 for hostels (N=1,985 properties), and about ¥19,100 for capsule hotels (N=107 properties). All are averages of the per-room rate for two guests sharing one room (tax included), not medians. For reference, business hotels averaged about ¥15,600 (N=7,900 properties) in the same month.
It may seem surprising that the simple-lodging formats average more than business hotels, but this stems from the “two guests, per room” basis. Guesthouses and hostels include whole-building rentals, private Japanese-style rooms, and large rooms for groups, and these higher-priced listings pull the average up. For dormitory-based properties, treating two guests as two beds gives a per-bed rate of about ¥10,400 for guesthouses, about ¥10,800 for hostels, and about ¥9,500 for capsule hotels. However, it is reasonable to assume dormitory beds actually sell for less: in an opening case published by Suzu City, dormitory beds were priced from ¥3,500–3,800 per person and private rooms from ¥4,500 per person.
| Format | Average listed price (2 guests/room, tax incl.) | Per-bed equivalent (÷2 assumption) | Properties | Same month last year (Sep 2025) |
|---|---|---|---|---|
| Guesthouses | ¥20,883 | ¥10,442 | N=2,305 | ¥20,323 (N=1,523) |
| Hostels | ¥21,500 | ¥10,750 | N=1,985 | ¥20,524 (N=1,288) |
| Capsule hotels | ¥19,050 | ¥9,525 | N=107 | ¥14,720 (N=74) |
| (Reference) Business hotels | ¥15,625 | — | N=7,900 | ¥14,955 (N=6,935) |
Source: MetroEngines Research & Consulting (September 2026 based on listings through the survey date). Note that the year-over-year comparison includes compositional changes because the number of properties differs.
Source: MetroEngines Research & Consulting (September 2026, nationwide, average listed price for 2 guests per room)
Year over year, guesthouses were up 2.8% and hostels up 4.8%, so price levels in both formats are holding firm. However, the number of properties covered has increased sharply since July 2026 (guesthouses went from 1,500 in June to 2,294 in July), so the year-over-year difference includes compositional changes. Capsule hotels have a small base at N=107, and the comparison with the same month last year (N=74) should be treated as reference only. Overlaying the monthly trend by year shows a seasonal peak in August for both formats in 2025.
Source: MetroEngines Research & Consulting (nationwide, average listed price for 2 guests per room). September 2026 compiled through the survey date.
Actual Occupancy — Simple Lodging Guest-Room Occupancy Is 29.6% Nationwide
Alongside the rate, occupancy determines revenue. In the Japan Tourism Agency’s “Overnight Travel Statistics Survey” 2025 annual data (final figures, released July 6, 2026), guest-room occupancy for simple lodgings was 29.6% (+0.6pt year over year), less than half the overall figure of 61.6% and the 75.3% for business hotels. Note that this national average includes mountain huts, seasonal properties, and small family-run inns, so it differs in character from urban simple lodgings.
By month, 2025 swung by about 15pt, from 24.5% in December to 39.1% in August. In 2024, August was also the highest at 37.9%, so the pattern of demand concentrating in the summer holiday period held for two years running. An annual payback plan needs to use a year-round average that includes these slow months.
Source: Compiled by the HotelBank Editorial Team from the Japan Tourism Agency, “Overnight Travel Statistics Survey (2025 Annual, Final Figures)” (final figures for both 2024 and 2025)
Regional differences are even larger. In the survey’s prefectural data, guest-room occupancy for simple lodgings was highest in Osaka at 73.6%, followed by Kyoto at 52.0%, Tokyo at 48.6%, and Fukuoka at 44.8%. Meanwhile, the lowest, Akita, was 8.9% — not even one in ten. For investment decisions, starting from the candidate site’s prefectural figure is closer to reality than the national average of 29.6%.
| Prefecture | Simple lodging guest-room occupancy (2025, JTA) | Guesthouse avg. listed price | Hostel avg. listed price |
|---|---|---|---|
| Osaka | 73.6% | ¥14,593 (N=89) | ¥13,756 (N=142) |
| Kyoto | 52.0% | ¥20,979 (N=164) | ¥21,237 (N=251) |
| Tokyo | 48.6% | ¥21,485 (N=141) | ¥22,725 (N=374) |
| Fukuoka | 44.8% | ¥22,598 (N=36) | ¥20,408 (N=191) |
| Okinawa | 34.7% | ¥20,305 (N=151) | ¥16,923 (N=304) |
| Hokkaido | 25.2% | ¥18,950 (N=151) | ¥25,782 (N=150) |
| (Nationwide) | 29.6% | ¥20,883 (N=2,305) | ¥21,500 (N=1,985) |
Source: Japan Tourism Agency, “Overnight Travel Statistics Survey (2025 Annual, Final Figures)”; MetroEngines Research & Consulting (September 2026, average listed price for 2 guests per room; prefectural figures calculated from municipal averages within each prefecture)
Osaka has the highest occupancy in the country, yet its average listed prices for both guesthouses and hostels are roughly ¥6,000–9,000 lower than in Tokyo or Kyoto. High occupancy may go hand in hand with attracting guests through lower prices, so a “high-occupancy area” is not necessarily a “high-profit area.” Conversely, even in areas with high rates, revenue plateaus if occupancy does not climb. The sensitivity tables in the next section are designed to move these two axes at the same time.
Cost Side — Initial Investment and Operating Costs from Published Cases
We build the cost side only from figures in published materials, not estimates. For initial investment, the “Guidebook for Opening Lodging Facilities Using Vacant Houses,” published by Suzu City in Ishikawa Prefecture in March 2020, gives concrete benchmarks. The guide puts the renovation cost for a simple lodging at around ¥400,000 per tsubo (1 tsubo ≈ 3.3㎡) and gives the examples “40 tsubo × ¥400,000 = ¥16 million” and “80 tsubo × ¥400,000 = ¥32 million.”
In an actual case featured in the guide (a 40-year-old, two-story wooden house converted into a guesthouse with two dormitory rooms and two private rooms), renovation costs initially estimated at ¥4.5 million ended up at ¥6.5 million — about 40% over the original plan. The additional work included added air conditioning, self-closing doors, increased electrical capacity, and additional fire alarms, and the guide notes that the building confirmation application took five months. The guideline renovation period is one to four months, but including procedures, it is realistic to allow about a year until opening.
| Cost item | Published figure | Source |
|---|---|---|
| Renovation cost benchmark (simple lodging) | ¥400,000/tsubo | Suzu City guidebook |
| Renovation cost of model (40 tsubo) | ¥16 million | Same as above (example of 40 tsubo × ¥400,000) |
| Renovation cost in actual case (initial → final) | ¥4.5 million → ¥6.5 million | Same as above (40-year-old, two-story wooden house) |
| Combined septic tank installation (municipality-installed type) | 5-person ¥200,000 / 14-person ¥320,000 / 30-person ¥580,000 | Same as above (Suzu City example) |
| Operations: labor cost to sales | 29.4% | Japan Finance Corporation (simple lodgings, average) |
| Operations: other expenses to sales | 41.4% | Same as above |
| Ordinary profit margin (pre-depreciation) | Average 11.2% / profitable-firm average 15.1% | Same as above (24 firms surveyed) |
| Break-even point ratio | 98.7% | Same as above |
Source: Compiled by the HotelBank Editorial Team from Suzu City, “Guidebook for Opening Lodging Facilities Using Vacant Houses in Suzu City” (March 2020), and Japan Finance Corporation, “Survey of Management Indicators for Small Businesses” (Restaurants & Accommodation / by industry, simple lodgings)
For operating costs, the Japan Finance Corporation’s “Survey of Management Indicators for Small Businesses” for simple lodgings (24 firms surveyed) provides a guide. Labor costs were 29.4% of sales and other expenses 41.4%; the pre-depreciation ordinary profit margin averaged 11.2%, rising to 15.1% for firms that were both profitable and had positive equity. The break-even point ratio was 98.7%, showing a business structure highly sensitive to occupancy, in which a swing of just a few percent in revenue flips profit and loss. Put the other way, it is also a format with upside: modest gains in occupancy or rate can lift profit significantly.
Note that the renovation cost benchmark in the Suzu City guide dates from 2020. Given the subsequent rise in construction prices, current estimates are likely to exceed it. The projections below use ¥16 million as the base case while also showing how to adjust for different investment amounts.
Sensitivity of ROI and Payback — Nine Combinations of Year-Round Occupancy × Per-Bed Rate
Based on the published figures above, we projected the payback period with the following model. The premise is a vacant house with 40 tsubo of total floor area, renovated and operated year-round as a simple lodging with 12 guest capacity (12 beds), with an investment equal to the ¥16 million renovation benchmark (the property is assumed to be already acquired or owned, so acquisition cost is excluded). Revenue = beds × 365 days × year-round occupancy × per-bed rate; the cash available for payback is revenue multiplied by the Japan Finance Corporation’s pre-depreciation ordinary profit margin for simple lodgings (average 11.2% / profitable-firm average 15.1%).
We set three per-bed rates: ¥3,500, close to the dormitory price in Suzu City’s published case; ¥7,000 as an intermediate assumption; and about ¥10,400, half of our nationwide guesthouse average. For year-round occupancy we set three levels: 30%, close to the Japan Tourism Agency’s national figure for simple lodgings (29.6%), and 45% and 60%, which bracket the levels of Tokyo (48.6%) and Kyoto (52.0%).
| Annual revenue (tax incl.) | ¥3,500 per bed | ¥7,000 per bed | ¥10,400 per bed |
|---|---|---|---|
| Year-round occupancy 30% | ¥4.6M Pre-depreciation profit ¥0.52–0.69M | ¥9.2M Pre-depreciation profit ¥1.03–1.39M | ¥13.67M Pre-depreciation profit ¥1.53–2.06M |
| Year-round occupancy 45% | ¥6.9M Pre-depreciation profit ¥0.77–1.04M | ¥13.8M Pre-depreciation profit ¥1.55–2.08M | ¥20.5M Pre-depreciation profit ¥2.30–3.10M |
| Year-round occupancy 60% | ¥9.2M Pre-depreciation profit ¥1.03–1.39M | ¥18.4M Pre-depreciation profit ¥2.06–2.78M | ¥27.33M Pre-depreciation profit ¥3.06–4.13M |
Source: Compiled by MetroEngines Inc. and the HotelBank Editorial Team (projection; pre-depreciation profit = revenue × 11.2%–15.1%)
| Payback period (investment ¥16M) | ¥3,500 per bed | ¥7,000 per bed | ¥10,400 per bed |
|---|---|---|---|
| Year-round occupancy 30% | 31.1 yrs / 23.0 yrs Yield 3.2% / 4.3% | 15.5 yrs / 11.5 yrs Yield 6.4% / 8.7% | 10.5 yrs / 7.8 yrs Yield 9.6% / 12.9% |
| Year-round occupancy 45% | 20.7 yrs / 15.4 yrs Yield 4.8% / 6.5% | 10.4 yrs / 7.7 yrs Yield 9.7% / 13.0% | 7.0 yrs / 5.2 yrs Yield 14.3% / 19.3% |
| Year-round occupancy 60% | 15.5 yrs / 11.5 yrs Yield 6.4% / 8.7% | 7.8 yrs / 5.8 yrs Yield 12.9% / 17.4% | 5.2 yrs / 3.9 yrs Yield 19.1% / 25.8% |
Source: Compiled by MetroEngines Inc. and the HotelBank Editorial Team (projection). Each cell shows “at 11.2% margin / at 15.1% margin.” Yield = annual pre-depreciation profit ÷ investment. Darker shading means faster payback (within 8 years / within 15 years).
Source: Compiled by MetroEngines Inc. and the HotelBank Editorial Team (projection; pre-depreciation ordinary profit margin of 11.2%)
Three things stand out from the projections. First, at a year-round occupancy of 30% — in line with the national average — and a dormitory-level rate of ¥3,500, payback takes 23–31 years, making a ¥16 million investment hard to justify. Second, raising either the rate to ¥7,000 or occupancy to 45% on its own only brings payback down to about 11–21 years. Third, when year-round occupancy of 45% or more is combined with a rate of ¥7,000 or more, the payback period shrinks to about 4–10 years, and the pre-depreciation investment yield reaches roughly 10% or higher.
If the investment amount differs, the payback period scales proportionally. If costs stay around the level of the Suzu City case (¥6.5 million), payback is about 0.41 times the table values; if acquisition costs and inflation push it to ¥24 million, it is about 1.5 times. Either way, whether both occupancy and rate can be set in line with what the location actually achieves is the biggest variable determining the ROI of a simple inn investment.
Working backward, we can derive the year-round occupancy needed for a target payback period. Table 7 shows, for each per-bed rate, the year-round occupancy required to achieve a 10-year or 15-year payback (projection; at 11.2% / 15.1% margin). At a dormitory-level ¥3,500, a 10-year payback requires 69–93% year-round occupancy: even sustaining Osaka’s level (73.6%, the highest for simple lodgings in 2025) all year falls short at the average 11.2% margin and only gets there at the profitable-firm average of 15.1%. At ¥7,000 the requirement is 35–47%, around the levels of Tokyo (48.6%) and Fukuoka (44.8%); at ¥10,400 it is 23–31%, around the national average (29.6%), that brings a 10-year payback within reach. The choice of rate alone moves the required occupancy level by a factor of two to three.
| Target payback | ¥3,500 per bed | ¥7,000 per bed | ¥10,400 per bed |
|---|---|---|---|
| 10-year payback | 93.2% / 69.1% | 46.6% / 34.6% | 31.4% / 23.3% |
| 15-year payback | 62.1% / 46.1% | 31.1% / 23.0% | 20.9% / 15.5% |
Source: Compiled by the HotelBank Editorial Team (projection). Each cell shows the required year-round occupancy “at 11.2% margin / at 15.1% margin” = investment ÷ target years ÷ margin ÷ (12 beds × 365 days × per-bed rate). The prefectural figures used for comparison are the Japan Tourism Agency’s simple lodging guest-room occupancy from the “Overnight Travel Statistics Survey (2025 Annual, Final Figures),” a reference value defined differently from bed occupancy.
| Investment | Occupancy 30% × ¥3,500 | Occupancy 45% × ¥7,000 | Occupancy 60% × ¥10,400 |
|---|---|---|---|
| ¥6.5M (Suzu City case) | 12.6 yrs / 9.4 yrs | 4.2 yrs / 3.1 yrs | 2.1 yrs / 1.6 yrs |
| ¥16M (this article’s base case) | 31.1 yrs / 23.0 yrs | 10.4 yrs / 7.7 yrs | 5.2 yrs / 3.9 yrs |
| ¥24M (allowing for acquisition and inflation) | 46.6 yrs / 34.6 yrs | 15.5 yrs / 11.5 yrs | 7.8 yrs / 5.8 yrs |
Source: Compiled by the HotelBank Editorial Team (projection). Occupancy is year-round bed occupancy (model assumption). Each cell shows “at 11.2% margin / at 15.1% margin.”
Risk Factors — Price In Licensing, Fire Safety, and Seasonality Up Front
The payback projections implicitly assume that the license is granted on schedule and that the property reaches its assumed occupancy right after opening. In practice, three factors tend to push plans back.
1. Licensing and change of use: If the portion used for lodging exceeds 200㎡, a building confirmation application for the change of use is required. In the Suzu City case, the building confirmation application alone took five months. In addition, some zoning districts do not permit buildings for inn/hotel use, so the most effective risk measure is to confirm “whether this property can be licensed” through advance consultation with the public health center and building department before acquiring it. Whether a confirmation application is needed also depends on floor area and number of stories, and the scope of the so-called “Category 4 exemption” for small buildings was narrowed in April 2025, so more renovations now require one.
2. Fire safety equipment: Lodging facilities are in principle required to install automatic fire alarm systems and exit lights; at 150㎡ or more of total floor area, fire extinguishers are required, and at a capacity of 30 or more people, a fire prevention manager must be appointed and a fire prevention plan prepared. After installation, inspections are required twice a year and reports once a year. Much of the 40% cost overrun in the actual case came from this kind of additional safety and equipment work.
3. Seasonality and location: Guest-room occupancy for simple lodgings moved within a monthly range of 24.5% to 39.1% nationwide in 2025, and by prefecture it ranges from under 10% to the 70% range. Preparing both a funding plan that can cover fixed costs in slow months and a pricing design that raises rates in peak season is how to move annual occupancy and rate toward the lower-right corner of the projection table.
Summary — Simple Inn ROI Is Determined by “Occupancy × Rate”
A simple inn (simple lodging) is a lodging format that individual investors and small operators can enter relatively easily: it is licensed, can operate year-round, and has no minimum room count. In our September 2026 listed prices, guesthouses averaged about ¥20,900 and hostels about ¥21,500, showing firm price levels, and the number of licensed facilities rose to 44,901 at the end of FY2024. On the other hand, the Japan Tourism Agency’s guest-room occupancy for simple lodgings stays at 29.6% nationwide, and the Japan Finance Corporation’s management indicators show a break-even point ratio of 98.7% — a structure that is clearly sensitive to occupancy and rate.
In this article’s model (12 guest capacity, ¥16 million renovation), the payback period ranged widely from about 4 to 31 years. The starting point for an investment decision is to set two figures: the candidate site’s occupancy rather than the national average, and a realistic per-bed rate that reflects whether the product is dormitory or private rooms. If additional licensing and fire-safety work and seasonality are then priced in from the outset, it becomes clear which cell of the projection table is achievable.
Frequently Asked Questions
Q. Are a “simple inn” (kan’i ryokan) and a “simple lodging” (kan’i shukusho) the same thing?
A. The format commonly called a “simple inn” corresponds to the “simple lodging business” under the Inns and Hotels Act. These are facilities whose lodging space is shared by many people, including guesthouses, hostels, capsule hotels, and mountain huts.
Q. What is a typical ROI (payback period) for a simple inn?
A. In this article’s projection (12 guest capacity, ¥16 million renovation), it ranged from about 4 to 31 years depending on the combination of year-round occupancy and per-bed rate. With occupancy of 45% or more and ¥7,000 or more per bed, the payback period shrinks to about 4–10 years.
Q. What is the occupancy rate of simple lodgings?
A. It was 29.6% nationwide in the Japan Tourism Agency’s “Overnight Travel Statistics Survey” 2025 annual data (final figures). Regional differences are large — Osaka 73.6%, Kyoto 52.0%, Tokyo 48.6%, and so on — so it is important to check the figure for the candidate site.
Q. How does it differ from minpaku (private lodging business)?
A. A simple lodging requires a license under the Inns and Hotels Act, but in exchange has no cap on operating days. A private lodging business can be started by notification, but annual operating days are limited to 180.
References and Sources
■ Data sources
The revenue side uses MetroEngines Research listed prices by format (average across all plans of the per-room rate for two guests sharing one room, tax included; September 2026 covers listings through the survey date of September 27, 2026, and the year-over-year and monthly trend cover October 2024 to September 2026). Occupancy is from the Japan Tourism Agency’s “Overnight Travel Statistics Survey” 2025 annual data (final figures), supply from the Ministry of Health, Labour and Welfare’s “Report on Public Health Administration and Services,” and the cost side uses only published figures from the Suzu City guidebook and the Japan Finance Corporation’s “Survey of Management Indicators for Small Businesses” (simple lodgings, 24 firms surveyed).
■ Projection assumptions
12 guest capacity (12 beds), 365 operating days; investment is ¥16 million in renovation costs (excluding property acquisition costs, financing terms, and taxes). Revenue = 12 beds × 365 days × year-round occupancy (assumed 30% / 45% / 60%) × per-bed rate (assumed ¥3,500 / ¥7,000 / ¥10,400). Cash for payback = revenue × pre-depreciation ordinary profit margin (JFC simple lodging average 11.2% / average for profitable firms with positive equity 15.1%); payback period = investment ÷ cash for payback. Tables 7 and 8 apply the same formula in reverse and with different investment amounts.
■ Limitations and caveats
Listed prices are not estimated achieved rates, and because the number of properties covered has increased since July 2026, year-over-year changes include compositional effects. The “÷2” per-bed rate is an assumption, and actual dormitory rates may be lower. The Japan Tourism Agency figures are guest-room occupancy, which is defined differently from the bed occupancy used in this article’s model. The profit margin is applied uniformly regardless of revenue scale or occupancy level and may be overstated at low occupancy for small properties with a high fixed-cost ratio. The Suzu City renovation cost benchmark is a 2020 figure.
■ Market data
- MetroEngines Research & Consulting — Listed prices by format (September 2026, nationwide: guesthouses N=2,305, hostels N=1,985, capsule hotels N=107, business hotels N=7,900)
■ Government statistics and public materials
- Japan Tourism Agency, “Overnight Travel Statistics Survey (2025 Annual, Final Figures)” (July 6, 2026)
- Japan Tourism Agency, “Overnight Travel Statistics Survey”
- Ministry of Health, Labour and Welfare, “Overview of the FY2024 Report on Public Health Administration and Services” (October 21, 2025)
- Ministry of Health, Labour and Welfare, “Q&A on Private Lodging Services and the Inns and Hotels Act”
- Japan Tourism Agency, “Minpaku System Portal Site”
- Japan Finance Corporation, “Survey of Management Indicators for Small Businesses” (Restaurants & Accommodation / by industry)
- Suzu City, “Guidebook for Opening Lodging Facilities Using Vacant Houses in Suzu City” (March 2020)