

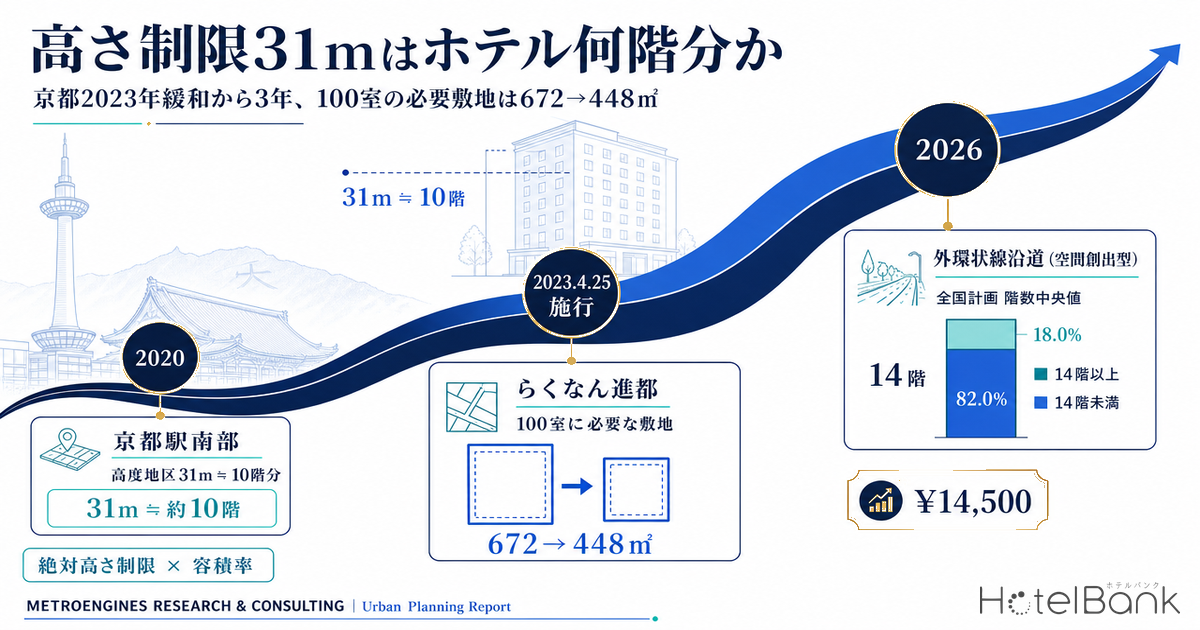
A 31m height limit translates to roughly 10 hotel floors. The city-planning revision that Kyoto City put into effect on April 25, 2023 raised the height control district cap along the main avenues south of JR Kyoto Station from 20–25m to 31m, and introduced a “space-creation height control district” along the Sotokanjo-sen (Outer Ring Road) corridor around Yamashina Station, where qualifying sites have no maximum height at all. Three years on, how far has this “vertical deregulation” changed the conditions for room supply? We work backward from the measured floor counts of 70 lodging construction plans nationwide (15,517 rooms) and from estimated settled ADR within Kyoto City.
Metric Definitions Used in This Article
- ADR (Average Daily Rate): An estimated settled rate (tax-exclusive equivalent) calculated by applying segment-specific adjustment factors to the lowest-plan price level each property publishes on OTAs (two guests per room, per-room rate, tax included). When checked against property-level results disclosed by listed hotel REITs (91 properties, most recent three months), the median error is about 7%. These are estimates and differ from each property’s actual transacted rates and accounting figures. Area-level ADR is the median of the properties covered (the level of a typical property in the area).
- OCC (Occupancy): Rooms sold as a share of total rooms in the area (an estimate based on OTA sales inventory). In this article it is used only as an assumption in the investment calculations.
- Height control district cap: The maximum building height set by city planning (an absolute height limit). In this article it is converted to floors assuming a 3.1m floor-to-floor height, with the ground floor treated as common space.
- Data sources: MetroEngines Research & Consulting / MLIT “Building Dynamics Statistics Survey” / Kyoto City, City Planning Bureau
How this differs from our earlier articles. This article is about “vertical” regulation — the absolute height limit imposed by height control districts — and it takes a time-series view, testing the results three years after deregulation. The horizontal side of regulation (zoning, FAR and land prices) was covered in Hotel Development Capacity 2026: Zoning, FAR & Land Price in 5 Markets. Hotel Build Times: 2.80-Year Median, 1.96 Solo vs 4.00 Mixed-Use uses the same construction-plan data, but its angle is construction duration, not floor count. Kyoto City’s landscape policy as a whole is outside the scope of this article.
- — A 31m height limit equals about 10 floors (at a 3.1m floor height). On April 25, 2023, Kyoto City raised the height control district cap south of Kyoto Station from 20–25m to 31m, and introduced a “space-creation height control district” with no maximum height along the Sotokanjo-sen corridor.
- — The absolute height limit sets the effective ceiling on FAR. At 80% building coverage, the most FAR that can be used is 480% under a 20m cap and 800% under a 31m cap. Even if FAR remains on paper, floor area cannot be built where the height cap is low.
- — The site needed for 100 rooms shrinks 33.3%, from 672㎡ to 448㎡ (south of Kyoto Station, before vs. after). Along the Sotokanjo-sen corridor it shrinks 42.9%, from 672㎡ to 384㎡.
- — The median floor count of 70 construction plans nationwide (15,517 rooms) is 14 floors. On a room basis, 82.0% sit in buildings taller than 10 floors and would not fit within a 31m height control district.
- — The break-even ADR in the post-deregulation case is ¥10,600, 36% below Minami Ward’s actual estimated settled ADR of ¥14,500 (11-month average, September 2025–July 2026, N=55 properties). Even at a construction cost of ¥2.8M per tsubo it is ¥11,200.
Three Layers Determine Height — Slant Planes, Absolute Limits and Landscape: Which One Binds?
The rules that constrain building height are not a single block. In hotel site development at least three layers overlap. Each has a different legal basis, works differently, and is relaxed through a different counterpart.
| Layer | Basis | How it works | Effect on hotel plans |
|---|---|---|---|
| 1. Slant-plane height limits | Building Standards Act (road, adjacent-lot and north-side slant planes); slant-type designations in height control districts | The ceiling rises with distance from the site boundary. The deeper into the site, the taller you can build | Narrow-frontage sites are at a disadvantage. Setbacks leave some room to work around it |
| 2. Absolute height limits | The height control district cap set by city planning (“must not exceed X m”) | A uniform ceiling regardless of site conditions. Cannot be designed around | FAR becomes unusable even if it remains on paper. Relaxation requires a city-planning change |
| 3. Landscape and view regulations | Landscape plans under the Landscape Act; view-preservation ordinances; outdoor advertising rules | Extends beyond height to form, design, colour and roof shape | Even when layers 1 and 2 are satisfied, design consultation can move the floor count and elevations. Affects the schedule |
In site-development practice, the bottleneck tends to be layer 2. Layer 1 has design escape routes through setbacks and the relaxation provisions for slant-plane limits, and layer 3 allows a landing point to be found through consultation. The absolute height limit in layer 2, by contrast, does not move unless the city-planning cap itself changes. Moreover, the increments differ from one municipality to the next. Setagaya Ward (Tokyo) operates seven caps — 15m, 16m, 19m, 25m, 28m, 31m and 45m — for residential zones other than low-rise exclusive residential zones, quasi-industrial zones and some neighbourhood commercial zones (effective April 1, 2019). Kyoto City, since its New Landscape Policy of 2007, has designated height control districts over about 95.3% of its urbanization promotion area, a designation rate that stands out nationally.
It is no accident that 31m occupies a special position among the seven caps. It corresponds to the “100 shaku” limit dating back to the old Urban Building Act, and is the threshold most widely used in Japanese city planning. Dividing by a hotel floor height of 3.1m, 31m comes to exactly 10 floors. The calculations that follow rest on this conversion.
What Kyoto City Changed on April 25, 2023 — Three Areas Before and After
On April 25, 2023, Kyoto City put into effect changes to zoning, height control districts, fire-prevention districts and related designations (some took effect on September 25 of the same year). The areas covered include Rakunan Shinto, the Sotokanjo-sen corridor on the eastern side of the city, the industrial zones in the western urban area, the areas around Mukomachi and Yodo stations, and the area south of Kyoto Station. The so-called “Tanoji” district, the heart of the city centre that includes Shijo-Karasuma, was not changed. Below we set out the three areas that bear directly on hotel development, based on the before/after table in the revision pamphlet published by the city.
| Area | Before | After | What it means for hotel sites |
|---|---|---|---|
| South of Kyoto Station (Minami Ward, along main avenues) |
Building coverage 60% / 80% FAR 200% / 400% Height district 20m Types 2–4 / 25m |
Building coverage 80% FAR 600% Height district 31m Type 1, etc. |
FAR was raised 1.5x and, at the same time, enough height was secured to use it. The height relaxation is built in as a necessary condition of the FAR relaxation |
| Rakunan Shinto (Fushimi Ward, north of the Kamo River) |
Building coverage 60% / 80% FAR 300% Height district 20m Type 4 |
Building coverage 80% FAR 400% Height district 31m Type 7 *Maximum FAR set as high as 1,000% in the special use inducement district |
A framework that induces high FAR on condition of minimum site areas (10,000㎡ / 5,000㎡ / 2,000㎡) and exterior-wall setbacks (10m / 5m). Suited to mixed-use development premised on large sites |
| Sotokanjo-sen corridor, eastern side (Yamashina Ward and others) |
Building coverage 60% / 80% FAR 200% / 300% / 400% / 600% Height district 20m Types 1–4 / 31m Type 1 |
Building coverage 80% FAR up to 700% “Space-creation” height district Sotokanjo-sen corridor special use district, Category 1 |
Buildings that meet the requirements have no maximum height; those that do not are capped at 31m. The design trades open space for vertical freedom |
| Tanoji district (city centre in Nakagyo and Shimogyo Wards) |
Outside this revision (no change) | The height environment of the city centre was left as is. It can serve as a control group when measuring the effect of deregulation | |
The requirements of the “space-creation height control district” are specific. On the premise that the site abuts the Sotokanjo-sen or Shin-Jujo-dori for at least 2m, (a) at least half of the ground-floor area must be given over, continuously, to activity-generating uses (anything other than houses, apartment buildings, dormitories, boarding houses, garages, car parks and warehouses); (b) a sidewalk-like open space at least 3m wide must be provided along the Sotokanjo-sen or Shin-Jujo-dori; and (c) a 2m setback must be taken from other road boundaries and adjacent-lot boundaries. Only buildings that meet all three are exempt from the maximum height. If any requirement is missing, the 31m ceiling remains.
Height and FAR Multiply — Under a 20m Cap, Usable FAR Tops Out at About 480%
What is easily overlooked in discussions of height limits is that the absolute height limit and FAR are not independent constraints. With building coverage b and floor count F, the maximum total floor area that can actually be built on a site is set by b × F. In other words, there is such a figure as “the maximum FAR that can be used under a given height cap.”
| Height district cap | Floors (3.1m floor height) | Usable FAR at 80% coverage | Usable FAR at 60% coverage |
|---|---|---|---|
| 15m | 4 floors | 320% | 240% |
| 20m | 6 floors | 480% | 360% |
| 25m | 8 floors | 640% | 480% |
| 31m | 10 floors | 800% | 600% |
| 45m | 14 floors | 1,120% | 840% |
Applying this table to the changes south of Kyoto Station reveals the thinking behind the deregulation. Under the previous 20m (6 floors), only 480% could be used even with the full 80% building coverage. Raising FAR to 600% while leaving the cap at 20m would have left it unusable. The new 600% can, on paper, be reached in 8 floors (about 25m) if 80% coverage is used in full, but in practice the building footprint often falls to around 60% of the site once car-park access and open space are secured, in which case exactly 10 floors — 31m — are required. The required number of parking spaces itself differs by a factor of 2.5 from city to city. The relationship that emerges here is that a height relaxation is meaningless unless it comes as a set with a FAR relaxation.
The maximum FAR of 1,000% set for Rakunan Shinto would require about 17 floors (roughly 52m) at 60% building coverage, or about 25 floors (roughly 78m) at 40% coverage. Under a 31m height control district it is physically impossible to use. That is precisely why this framework is combined with conditions such as a 10,000㎡ minimum site area and a 10m exterior-wall setback, opening up the vertical dimension in exchange for open space on large sites. Talking about development capacity from the FAR figure alone means counting floor area that cannot actually be built.
Three Years On, How Has Kyoto Prefecture’s Room Supply Moved? — Reading It With Lead Times Factored In
Three years have passed since the April 2023 enforcement. Within the scope tracked by MetroEngines Research & Consulting, new openings in Kyoto Prefecture (confirmed by OTA listing) line up by year as follows.
From a peak of 172 properties and 6,321 rooms in 2021, the room count has contracted: 3,298 in 2022, 3,558 in 2023, 2,517 in 2024 and 1,806 in 2025. The 618 rooms for 2026 are a part-year tally, and because OTA listings only appear a few months before opening, the figure will rise as further listings come through.
Reading this trend as “deregulated, yet nothing is being built” mistakes the time axis. As confirmed in our earlier article Hotel Build Times, lodging facilities take an average of 2.80 years from construction start to completion (1.96 years for single-use, 4.00 years for mixed-use). On top of that comes the preceding period for site acquisition, design and building-confirmation application. Projects that secured sites on the basis of the April 2023 city-planning change will complete in 2026 or later even for single-use buildings, and around 2028 for mixed-use. The properties that opened in 2024–2025 were all planned before the deregulation. The lead time for deregulation to convert into room supply is still only at its halfway point.
Indeed, extracting Kyoto Prefecture projects from construction plans (50 rooms or more) based on MLIT’s “Building Dynamics Statistics Survey” yields five: Higashikujo, Minami Ward, Kyoto City (270 rooms, 9 floors, completion scheduled April 2026); Kamigyo Ward (135 rooms, 3 floors, completion scheduled September 2027); Higashiyama Ward (55 rooms, 7 floors, completion scheduled April 2026; and 53 rooms, 4 floors, completion scheduled December 2028); and Kumiyama Town, Kuze District (224 rooms, 9 floors). The count is limited, but because building-confirmation applications are normally filed one to two years before opening, this is the lower bound of the confirmed pipeline at this point. The number of projects and rooms is expected to increase as further applications are added; it should not be read as an upper bound.
The actual price level also needs to be pinned down. We line up monthly estimated settled ADR for Minami Ward, which is covered by the deregulation, the city-centre wards outside it (Shimogyo and Nakagyo), and Higashiyama Ward, a tourist-destination location.
On an 11-month average, Minami Ward is ¥14,500, Shimogyo Ward ¥16,000, Nakagyo Ward ¥17,400 and Higashiyama Ward ¥24,100. Minami Ward’s level is 90.6% of Shimogyo’s, 83.4% of Nakagyo’s and 60.0% of Higashiyama’s. As the area targeted by the deregulation, Minami Ward sits only 10–20% below the city centre, and given its proximity to Kyoto Station the market has sufficient depth. Note that Yamashina Ward has only one property within the scope of our estimated settled ADR, so we do not cite it as an area level. Fushimi Ward is also thin at five properties and is treated the same way.
On the land-price side, too, Minami Ward’s standing is changing. In the Official Land Price announcement (Chika Koji) released by MLIT in March 2026, the average price of commercial land in Kyoto Prefecture exceeded ¥1 million per square metre for the first time in 32 years, and the highest growth among commercial land in the prefecture was recorded in Minami Ward, Kyoto City. On an all-use average by ward, Minami Ward is ¥571,000/㎡ (+11.05% YoY), Yamashina Ward ¥166,000/㎡ (+3.84%), Shimogyo Ward ¥1,882,000/㎡ (+9.27%) and Nakagyo Ward ¥1,729,000/㎡ (+9.31%).
Measured Floor Counts of 70 National Plans — 82% of Rooms Sit in Buildings Above 10 Floors
To generalize beyond Kyoto, we measure the floor counts of construction plans nationwide (50 rooms or more, N=70 plans, 15,517 rooms in total). The floor count is known for 66 plans and 14,965 rooms.
The median is 14 floors, the maximum is 63 floors, and 20 plans have 20 floors or more. Low-rise buildings of 1–3 floors number only six. The 14-floor median converts to about 43m at a 3.1m floor height. In other words, the standard form of the hotels being planned across Japan does not fit within a 31m height control district.
Viewed on a room basis, the implication becomes clearer still. For each height ceiling, we show cumulatively the share of total rooms accounted for by plans that fit within that floor count.
Only 9 plans with 1,234 rooms, 8.2% of the total, fit within the equivalent of 20m (6 floors), and even within the equivalent of 31m (10 floors) it is just 18 plans with 2,697 rooms, or 18.0%. Only when the ceiling is widened to the equivalent of 45m (14 floors) does coverage reach 41 plans with 8,409 rooms, or 56.2%. Put the other way, if a 31m absolute height limit applied uniformly nationwide, 82.0% of currently planned rooms would have to be redesigned.
Differences in use mix also matter. The 30 plans whose principal use is “hotel” alone have a median of 12 floors, whereas the 36 mixed-use plans combining offices, residences or retail have a median of 20 floors. In mixed-use developments the hotel sits on the upper floors, so the building as a whole grows taller. This structure is why mixed-use schemes are hard to assemble in areas with strict height limits.
Rooms per floor (rooms ÷ floors) has an overall median of 15.0; by floor band it is 22.4 for 1–9 floors, 18.2 for 10–14 floors, 15.4 for 15–19 floors and 6.7 for 20 floors or more. The sharp drop at 20 floors and above arises because the hotel occupies only part of the building; limited to the 30 hotel-only plans, the median is 15.6 rooms per floor. For the 29 plans that are hotel-only and have a known total floor area, the median total floor area per room is 26.9㎡ (first quartile 17.4㎡, third quartile 63.2㎡).
Stacking 100 Rooms at 31m, 45m and No Height Cap — Required Site Area and Break-Even ADR
Using the measured values so far, we work backward to the site area needed to make a 100-room hotel work. The assumptions: total floor area per room at the measured median of national plans, 26.9㎡, giving a required total floor area of 2,690㎡ (813.7 tsubo); a 3.1m floor height; and a simple stacking calculation that does not treat the ground floor as common space.
| Height ceiling | Floors | Required typical floor plate | Required site (80% coverage) | FAR needed on that site |
|---|---|---|---|---|
| 20m | 6 floors | 448㎡ | 560㎡ | 480% |
| 31m | 10 floors | 269㎡ | 336㎡ | 800% |
| 45m | 14 floors | 192㎡ | 240㎡ | 1,120% |
| No height cap (20 floors assumed) | 20 floors | 134㎡ | 168㎡ | 1,600% |
The higher you build, the smaller the site can be, but the FAR needed on that site jumps. Stacking 100 rooms on a 336㎡ site at 31m requires FAR of 800%. South of Kyoto Station the post-deregulation FAR is 600%, so it does not work on this site. We therefore re-solve for the solutions that actually work, with both FAR and height as constraints.
| Case | Regulatory conditions | Required site | Floors | Binding constraint | Land cost (approx.) |
|---|---|---|---|---|---|
| South of Kyoto Station, before | FAR 400% / 20m Coverage 80% | 672㎡ | 5 floors | FAR | ¥384M |
| South of Kyoto Station, after | FAR 600% / 31m Coverage 80% | 448㎡ | 8 floors | FAR | ¥256M |
| Sotokanjo-sen corridor, before | FAR 400% / 20m Coverage 80% | 672㎡ | 5 floors | FAR | ¥112M |
| Sotokanjo-sen corridor, after | FAR 700% / no height cap Effective coverage 55% | 384㎡ | 13 floors | FAR | ¥64M |
South of Kyoto Station, the site needed for 100 rooms shrinks 33.3%, from 672㎡ to 448㎡, saving roughly ¥128 million in land cost. Along the Sotokanjo-sen corridor it shrinks 42.9%, from 672㎡ to 384㎡. From the standpoint of how hard it is to acquire a site, this difference is large. Securing a consolidated commercial plot in the 700㎡ class within Kyoto City and securing one in the 400㎡ class involve entirely different pools of properties for sale.
This calculation also explains why the height ceiling was removed in the “space-creation height control district.” Factoring in the 3m sidewalk-like open space and the 2m setback from adjacent lots, the building footprint that can actually be built on a 400㎡ site (assumed to be a 20m square) is 240㎡, and effective building coverage falls to 60%. Using up FAR of 700% under these conditions requires 12 floors, or about 37m. Even on a 500–600㎡ site it takes 11 floors, about 34m. Only at 800㎡ does it fit within 10 floors, about 31m. In other words, on small and mid-sized sites, 700% cannot be used up while the 31m ceiling remains. If open space is to be demanded while FAR is granted, the height ceiling had to be removed.
Finally, we work backward to the ADR needed for each case to pencil out. For construction cost, we start from the 2025 steel-frame (S) unit cost of ¥2.405 million per tsubo based on MLIT’s Building Starts Statistics, assume a 2029 opening, factor in two years of inflation at +5% per year up to the midpoint of construction, and arrive at ¥2.65 million per tsubo. We assume a target NOI yield of 5.0%, a GOP margin of 35%, full-year occupancy of 80% (a modelling assumption, not measured occupancy) and room revenue at 90% of total revenue.
| Case | Land | Building | Total investment | Required revenue | Break-even ADR |
|---|---|---|---|---|---|
| South of Kyoto Station, before | ¥384M | ¥2,158M | ¥2,542M | ¥363M | ¥11,200 |
| South of Kyoto Station, after | ¥256M | ¥2,158M | ¥2,414M | ¥345M | ¥10,600 |
| Sotokanjo-sen corridor, before | ¥112M | ¥2,158M | ¥2,269M | ¥324M | ¥10,000 |
| Sotokanjo-sen corridor, after | ¥64M | ¥2,158M | ¥2,221M | ¥317M | ¥9,800 |
Minami Ward’s estimated settled ADR averages ¥14,500 over the latest 11 months. That is 36% above the ¥10,600 required in the post-deregulation case. The compression of land cost from the height relaxation lowers the required ADR by only about ¥600, from ¥11,200 to ¥10,600, because land accounts for a small share — around 15% — of total investment. The effect of deregulation shows up less in a lower required ADR than in a wider range of workable site sizes — that is, in a larger population of candidate sites.
Because construction cost makes up about 90% of total investment, the unit-cost assumption moves the conclusion more than anything else. We vary the inflation built into the starting unit cost three ways and show the resulting range of break-even ADR.
| Scenario | Construction unit-cost assumption | Building | Total investment | Required ADR | Gap to actual |
|---|---|---|---|---|---|
| Optimistic | ¥2.53M per tsubo (2025 steel-frame ¥2.405M + 2.5% per year × 2 years) | ¥2,059M | ¥2,315M | ¥10,200 | +42% |
| Base (this article’s assumption) | ¥2.65M per tsubo (same + 5.0% per year × 2 years) | ¥2,156M | ¥2,412M | ¥10,600 | +37% |
| Pessimistic | ¥2.80M per tsubo (same + 8.0% per year × 2 years) | ¥2,278M | ¥2,534M | ¥11,200 | +30% |
Even at a construction unit cost of ¥2.8 million per tsubo, the required ADR is ¥11,200, 30% below Minami Ward’s actual level. Conversely, the required ADR only reaches the actual ¥14,500 at around ¥3.7 million per tsubo (+54% versus 2025), a level that is hard to envisage from current inflation rates. In this location, swings in construction cost are not the variable that decides whether the investment works.
The sensitivity to the assumptions is also worth a look. Changing the floor area per room moves the required ADR considerably.
| Floor area per room (total floor area ÷ rooms) | Required total floor area | Required site (600%) | Total investment | Required ADR |
|---|---|---|---|---|
| 22.0㎡/room (limited-service) | 2,200㎡ | 367㎡ | ¥1,974M | ¥8,700 |
| 26.9㎡/room (measured median in this article) | 2,690㎡ | 448㎡ | ¥2,414M | ¥10,600 |
| 31.0㎡/room | 3,100㎡ | 517㎡ | ¥2,781M | ¥12,200 |
| 35.0㎡/room | 3,500㎡ | 583㎡ | ¥3,140M | ¥13,800 |
The required ADR also moves with the target yield and the occupancy assumption. The table below varies both along two axes, each as a full-year modelling assumption.
| Target NOI yield | Full-year occupancy 75% | Full-year occupancy 80% | Full-year occupancy 85% |
|---|---|---|---|
| 4.5% | ¥10,200 | ¥9,600 | ¥9,000 |
| 5.0% | ¥11,300 | ¥10,600 | ¥10,000 |
| 5.5% | ¥12,500 | ¥11,700 | ¥11,000 |
| 6.0% | ¥13,600 | ¥12,800 | ¥12,000 |
Even under a stricter target yield of 6.0% and full-year occupancy of 75% (a modelling assumption), the required ADR is ¥13,600, within Minami Ward’s actual ¥14,500. This is a simplified calculation, and an actual investment decision requires a detailed feasibility study, but the direction is clear: the change in the combination of height and FAR has widened the range of sites worth considering.
Three Points for Site-Development Teams to Take Away
Don’t look at FAR alone
The absolute height limit sets the effective ceiling on FAR. At 80% building coverage, usable FAR tops out at 480% under 20m and 800% under 31m. Even if FAR remains on paper, floor area cannot be built where the height cap is low. Look at both together in the first screening of sites.
Deregulation shows up in the “pool of sites”
South of Kyoto Station, the site needed for 100 rooms shrank 33.3%, from 672㎡ to 448㎡. The fall in required ADR, ¥11,200→¥10,600, is limited; the larger effect is the wider pool of properties for sale worth considering. It is worth updating the search criteria for site leads.
Conversion into supply takes 3–5 years
Construction start to completion averages 2.80 years, preceded by site acquisition, design and building confirmation. The deregulation enforced in 2023 will appear as rooms from 2026 onward. It is too early to judge its success by the current rise or fall in supply.
One more fact from the national plan data is worth adding. The median floor count of hotels under construction or planned is 14 floors, which does not fit within a 31m height control district. On a room basis, 82.0% sit in buildings above 10 floors. The 31m height limit is a line that collides head-on with the standard form of hotel development today. Put the other way, in areas where height control districts of 31m or less are widely designated, product designs that work at low rise — limited-service hotels that hold floor area per room to around 22㎡, or regular-shaped sites that can secure 20 or more rooms per floor — become the investment opportunity. Where you cannot build up, you solve with width and floor area per room.
In Kyoto City’s case, the deregulated areas are south of Kyoto Station, Rakunan Shinto and the Sotokanjo-sen corridor on the eastern side, among others; the Tanoji district in the city centre has not been changed. With the height environment of the city centre left as is, the scope for assembling new hotels of scale within Kyoto City tends to concentrate, in relative terms, in the deregulated areas. That Minami Ward’s estimated settled ADR has reached 90.6% of the city centre (Shimogyo Ward) is a figure worth keeping in mind as the premise for that.
Note on reading the data: The construction plans (N=70) are based on building-confirmation applications in MLIT’s “Building Dynamics Statistics Survey,” and such applications are normally filed one to two years before opening. Counts of projects and rooms for future years are therefore structurally undercounted and are expected to increase as further applications are added. Please treat them as the lower bound of the confirmed pipeline at this point. For new openings (confirmed by OTA listing) too, OTA listings appear a few months before opening, so recent and future years may rise with further listings. In addition, all height and floor conversions are simple calculations assuming a 3.1m floor height, and do not take into account basements, penthouses, slant-plane limits or shadow regulations. For any individual site, be sure to confirm the designations with the municipality that has jurisdiction.
Related Articles
- Hotel Development Capacity 2026: Zoning, FAR & Land Price in 5 Markets
- Hotel Build Times: 2.80-Year Median, 1.96 Solo vs 4.00 Mixed-Use
- Lodging Supply Denominator: 44,901 Simple Lodgings Move Kyoto 21st→5th
References and Sources
■ Data sources
Construction plans are 70 plans of 50 rooms or more, totalling 15,517 rooms, based on MLIT’s “Building Dynamics Statistics Survey” (of which 66 plans and 14,965 rooms have a known floor count). Estimated settled ADR is the monthly figure for four Kyoto City wards compiled by MetroEngines Research & Consulting (11 months from September 2025 to July 2026; Minami Ward N=55 properties / Shimogyo Ward N=160 / Nakagyo Ward N=102 / Higashiyama Ward N=49). Height control district caps are from materials published by Kyoto City and Setagaya Ward; land prices from MLIT “Official Land Prices” 2026; construction unit costs from MLIT “Building Starts Statistics” 2025.
■ Calculation assumptions
Total floor area per room of 26.9㎡ (median of the 29 plans whose principal use is hotel-only and whose total floor area is known); 3.1m floor height; construction unit cost of ¥2.65M per tsubo, being the 2025 steel-frame unit cost of ¥2.405M per tsubo plus two years of inflation at +5% per year (optimistic ¥2.53M / pessimistic ¥2.80M); target NOI yield 5.0%; GOP margin 35%; full-year occupancy 80% (modelling assumption); room revenue share 90%; opening in 2029. Land cost is an approximation obtained by multiplying the all-use average land price by ward by the required site area.
■ Limitations and caveats
Height and floor conversions are simple calculations assuming a 3.1m floor height and do not take into account basements, penthouses, slant-plane limits, shadow regulations or the various FAR relaxations. Because construction plans are based on building-confirmation applications, future years are structurally undercounted and must be read as the lower bound of the confirmed pipeline. Estimated settled ADR is an estimate obtained by applying segment-specific adjustment factors to OTA published prices (median error of about 7% when checked against property-level disclosures by listed hotel REITs) and differs from actual transacted rates and accounting figures. Occupancy is not a measured value but an assumption for the investment calculation. For any individual site, be sure to confirm the designations with the municipality that has jurisdiction.
■ Market data
- MetroEngines Research & Consulting — Estimated settled ADR (Kyoto City: Minami Ward N=55 properties / Shimogyo Ward N=160 / Nakagyo Ward N=102 / Higashiyama Ward N=49); new-opening data (confirmed by OTA listing)
■ City planning and administrative materials (primary sources)
- Kyoto City, “(April and November 2023 City Planning Changes) Review of City Planning Toward a Vibrant, Attractive City Where Everyone Can Live Comfortably” (published April 2023; City Planning Bureau, Urban Planning Division)
- Kyoto City, “Height Control Districts”
- Kyoto City, “2. Use Districts, Height Control Districts, etc.” (height control districts designated over about 95.3% of the urbanization promotion area)
- Setagaya Ward, “About Height Control Districts” (seven absolute height caps, effective April 1, 2019)
■ Government statistics
- MLIT, “Building Dynamics Statistics Survey” (construction plans N=70, 15,517 rooms, of which 66 have a known floor count)
- MLIT, “Building Starts Statistics” (2025 unit cost per tsubo by structure: steel-frame ¥2.405M, reinforced concrete ¥2.026M)
- MLIT, “Official Land Prices” 2026 (average commercial land price in Kyoto Prefecture reached the ¥1 million/㎡ range for the first time in 32 years; the highest growth among commercial land in the prefecture was in Minami Ward, Kyoto City)
- Tochidai Data, “Kyoto City Land Price Levels and Official Land Prices” 2026 (all-use average by ward; a third-party site compiling MLIT “Official Land Prices”)
■ Press reports
- Nikkei, “Kyoto City to ease height limits from the 25th, south of Kyoto Station and the eastern part of the city” (April 18, 2023)
- Kyoto Shimbun, “Kyoto Prefecture official land prices: average commercial price tops milestone for the first time in 32 years; highest growth in Minami Ward, Kyoto City”