

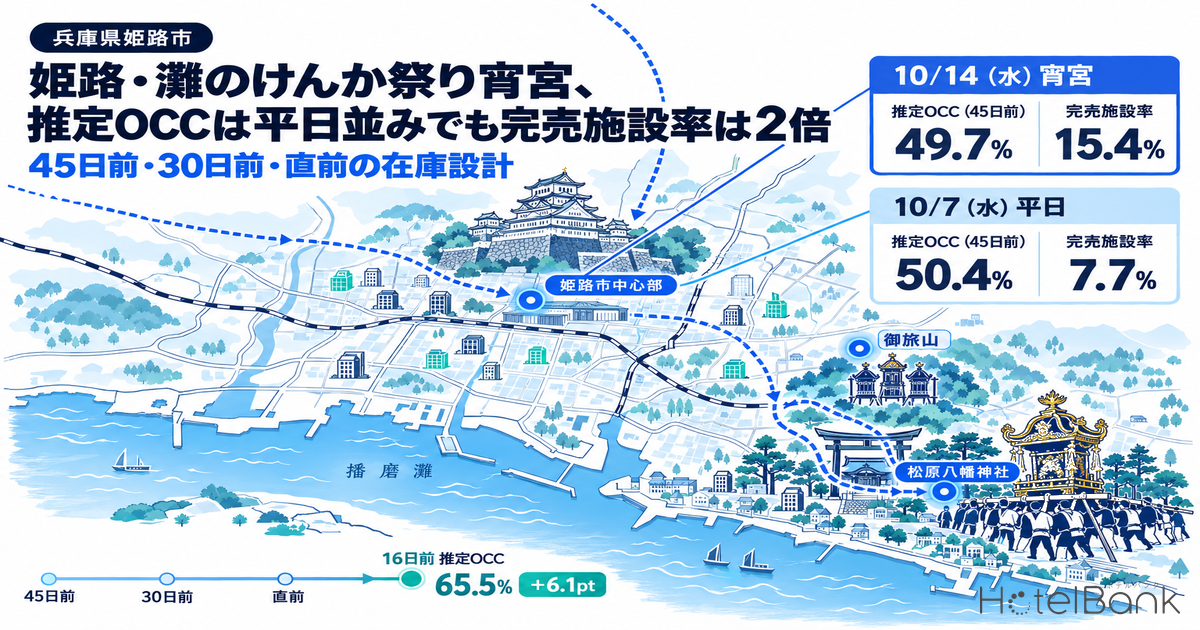
The Nada Fighting Festival (灘のけんか祭り) is Himeji’s major autumn festival — the annual autumn grand festival of Matsubara Hachiman Shrine, held in 2026 on Wednesday, October 14 (Yoimiya, the festival eve) and Thursday, October 15 (Honmiya, the main day). For the Yoimiya night of 10/14, estimated OCC (OTA-listed inventory basis) stood at 49.7% at 45 days before the stay date, almost the same as the 50.4% for the ordinary Wednesday one week earlier, 10/7. Yet the share of properties with no listed inventory visible on OTAs (the sold-out property rate, an estimate) was 15.4% for 10/14 versus 7.7% for 10/7 — a twofold gap — and for 10/14 that share has not fallen once between 45 days out and the latest observation (16 days out). Compared at the same latest lead time (16 days out), estimated OCC was 65.5% for 10/14 and 59.4% for 10/7, with the gap widening to +6.1pt. “Average occupancy looks like a weekday, but the properties that are sold out were decided early” — this article sets out how to translate that skew into inventory, minimum-length-of-stay and cancellation-policy design.
Scope: accommodation properties in Himeji City, Hyogo (all properties) N=26 properties / 2,823 rooms, of which business hotels N=12 properties / 1,918 rooms (based on listings on major booking sites). Occupancy figures in this article are estimates based on OTA-listed inventory; price levels are not covered. Definitions are at the end of the article. Data as of: September 29, 2026.
• OCC (occupancy) = rooms sold as a share of total rooms in the area (an estimate based on inventory sold through OTAs). In this article it is written as “estimated OCC (OTA-listed inventory basis).”
• Sold-out property rate = the share of properties with no listed inventory visible on OTAs and similar channels (an estimate on a property-count basis).
• This article does not cover prices or ADR. For detailed definitions and the number of properties covered, see “About the Data” at the end of the article.
• Source: MetroEngines Research
- — Estimated OCC at 45 days out is weekday-level: 49.7% for Yoimiya 10/14 versus 50.4% for the weekday one week earlier, 10/7 (Himeji City, N=26 properties, observed in late August 2026).
- — The sold-out property rate is double: 15.4% for 10/14, never falling from 45 days out to 16 days out, versus 7.7% for 10/7.
- — The gap opens after 30 days out: the pickup from 30 days out to 16 days out was +9.4pt for 10/14 and +2.0pt for 10/7. Honmiya 10/15 was +12.5pt above its weekday comparison at 17 days out.
- — Sell-outs are concentrated in small properties: no property with 20 or more rooms (N=15 for 10/14) is sold out, and their median remaining availability is 33.5%. The sold-out property rate for business hotels is 0.0%.
- — Set actions night by night: inventory blocks and cancellation terms at 45 days out, a pace check and a review of multi-night conditions at 30 days out, and immediate resale of returned inventory in the final stretch.
The Festival Schedule and How the Comparison Is Built
The Nada Fighting Festival is the autumn grand festival held every year on October 14 and 15 at Matsubara Hachiman Shrine in Shirahama-cho, Himeji City. It is known for the ritual in which three portable shrines (mikoshi) are crashed into one another and for the parading of festival floats (yatai) by each of the former villages. According to the 2026 timetable published on the official website, on the Yoimiya of the 14th each village’s float enters the shrine in turn from before noon, while on the Honmiya of the 15th the “Tsuyuharai no Gi” rite begins at around 4:30 a.m. and the procession to Mt. Otabi continues into the evening. Because the Honmiya morning starts so early, stays by spectators and participants tend to gravitate toward the Yoimiya night (the night of 10/14).
This article compares the two festival nights (10/14 and 10/15) with the ordinary weekdays one week earlier on the same days of the week (Wednesday 10/7 and Thursday 10/8). There are two yardsticks. One is estimated OCC (OTA-listed inventory basis), which shows how much of the total room stock has been sold. The other is the sold-out property rate, the share of properties — by count — with no listed inventory visible. The former measures “volume,” the latter “skew,” and the two can move differently even for the same date. All observations are limited to the window from 45 days before the stay date to the latest observation (September 28).
10/14 (Yoimiya) vs 10/7 (Weekday) — Same Average, Double the Sold-Out Property Rate
The chart below overlays the booking curves for all properties in Himeji City (N=26 properties / 2,823 rooms) for the Yoimiya night of 10/14 and for 10/7 one week earlier. At 45 days out, 10/14 was at 49.7% and 10/7 at 50.4%, so 10/14 actually started from a slightly lower position. At 30 days out the figures were 56.1% and 57.4%; up to this point the festival night is indistinguishable from a weekday.
The gap opened after 30 days out. 10/14 added +9.4pt between 30 days out and 16 days out to reach 65.5%, whereas 10/7 added only +2.0pt over the same stretch, ending at 59.4%. The 10/7 curve shows estimated OCC falling at 21 days out (-1.8pt) and 17 days out (-4.7pt). These moves indicate that listed rooms came back (including cancellation returns and additional inventory being listed). For 10/14, the only return seen over the same stretch was -0.5pt at 27 days out, and the returned inventory was quickly absorbed.
Source: MetroEngines Research, compiled by the HotelBank Editorial Team
The sold-out property rate for 10/14 was a constant 15.4% (equivalent to 4 of 26 properties) from 45 days out to 16 days out. For 10/7 it started at 7.7% (equivalent to 2 properties), rose temporarily to 11.5% between 36 and 32 days out, and returned to 7.7% at 31 days out. The difference is visible: weekday sell-outs include cases where “inventory comes back after selling out once,” whereas the Yoimiya sell-outs were already settled by 45 days out and have not moved since.
| Stay date | Segment | 45 days out | 30 days out | Latest, at the same lead time | Pickup, 30 days out → latest |
|---|---|---|---|---|---|
| 10/14 (Wed) Yoimiya | All properties N=26 | 49.7% (15.4%) | 56.1% (15.4%) | 16 days out: 65.5% (15.4%) | +9.4pt |
| 10/7 (Wed) weekday | All properties N=26 | 50.4% (7.7%) | 57.4% (7.7%) | 16 days out: 59.4% (7.7%) | +2.0pt |
| 10/15 (Thu) Honmiya | All properties N=26 | 54.6% (0.0%) | 61.9% (3.8%) | 17 days out: 69.6% (3.8%) | +7.7pt |
| 10/8 (Thu) weekday | All properties N=26 | 48.0% (3.8%) | 53.1% (0.0%) | 17 days out: 57.1% (0.0%) | +4.0pt |
| 10/14 (Wed) Yoimiya | Business hotels N=12 | 48.2% (0.0%) | 55.4% (0.0%) | 16 days out: 67.7% (0.0%) | +12.3pt |
| 10/7 (Wed) weekday | Business hotels N=12 | 42.7% (0.0%) | 51.6% (0.0%) | 16 days out: 61.1% (0.0%) | +9.5pt |
| 10/15 (Thu) Honmiya | Business hotels N=12 | 48.3% (0.0%) | 58.6% (0.0%) | 17 days out: 68.9% (0.0%) | +10.3pt |
| 10/8 (Thu) weekday | Business hotels N=12 | 47.2% (8.3%) | 54.7% (0.0%) | 17 days out: 62.6% (0.0%) | +7.9pt |
Figures are estimated OCC (OTA-listed inventory basis); figures in parentheses are the sold-out property rate (estimate). Latest = observed September 28. 10/14 and 10/7 are aligned at 16 days out, and 10/15 and 10/8 at 17 days out.
Source: MetroEngines Research, compiled by the HotelBank Editorial Team
Where Honmiya 10/15 Sits Relative to the Following Weeks’ Weekdays
For the Honmiya night of Thursday 10/15, estimated OCC started at 54.6% at 45 days out, 6.6pt above the 48.0% for Thursday 10/8 one week earlier. At 17 days out it was 69.6% versus 57.1%, with the gap widening to +12.5pt. The sold-out property rate for 10/15, however, was only 3.8% (equivalent to 1 of 26 properties), far less skewed than the Yoimiya night of 10/14. The two nights differ in character: 10/15 is “a date that builds broadly and evenly,” while 10/14 is “a date whose average is weekday-level but where some properties sold out early.”
The next chart lines up seven Wednesday, Thursday and Friday dates in October as of 30 days out. The bars are the sold-out property rate and the line is estimated OCC. The 15.4% sold-out property rate for 10/14 is the highest of the seven dates, yet its estimated OCC of 56.1% is below the 64.7% for Wednesday 10/21 and the 72.7% for Thursday 10/22 in the following week. 10/21 also had a sold-out property rate of 11.5% at 45 days out, but it had returned to 7.7% by 30 days out. In other words, ranking dates by the “volume” of occupancy alone makes it easy to overlook the skew of the Yoimiya night.
Source: MetroEngines Research, compiled by the HotelBank Editorial Team
Which Properties Are Selling Out — 0% Among Business Hotels
In the business-hotel-only cohort (N=12 properties / 1,918 rooms), the sold-out property rate for 10/14 was 0.0% from 45 days out through 16 days out. Even so, estimated OCC advanced from 48.2% at 45 days out to 55.4% at 30 days out and 67.7% at 16 days out, 6.6pt above 10/7 at the same 16 days out (61.1%). For business hotels, festival demand shows up not as “sell-outs” but as a lift across the board. For how curves differ by property type across Hyogo as a whole, see Hyogo Booking Curves: 3.6x Pickup Gap, Ryokan Sellout Rate 28.4%.
Source: MetroEngines Research, compiled by the HotelBank Editorial Team
We also checked the inventory status of individual properties. Splitting the Himeji properties that list 30% or more of their total rooms on OTAs and similar channels (N=22 properties for 10/14) by room count, every property with no listed inventory visible as of September 29 was a small property with fewer than 20 rooms (whole-house rentals and the like). These two properties (for 10/14) have remained sold out since more than 45 days before the stay date. No property with 20 or more rooms (N=15 properties / 2,275 rooms for 10/14) was sold out, and their median remaining availability was 33.5%.
| Stay date | Property size | Properties | Properties with no listed inventory visible | Median remaining availability |
|---|---|---|---|---|
| 10/14 (Wed) Yoimiya | 20 rooms or more | N=15 (2,275 rooms) | 0 properties | 33.5% |
| 10/14 (Wed) Yoimiya | Fewer than 20 rooms | N=7 (31 rooms) | 2 properties (1 room, 2 rooms) | — |
| 10/15 (Thu) Honmiya | 20 rooms or more | N=13 (1,984 rooms) | 0 properties | 32.4% |
| 10/15 (Thu) Honmiya | Fewer than 20 rooms | N=9 (50 rooms) | 1 property (2 rooms) | — |
Covers properties that list 30% or more of their total rooms on OTAs and similar channels. As of September 29 (15 days before the stay date for 10/14, 16 days before for 10/15). No median is shown for small properties because their remaining-availability ratio swings widely with each single room.
Source: MetroEngines Research, compiled by the HotelBank Editorial Team
Because the sold-out property rate counts “the number of properties,” a property with one or two rooms selling out counts as one property just as a 200-room property would. The natural reading of the high Yoimiya sold-out property rate is that small properties near the venue, where small parties and groups can stay together, filled first. Seen from the side of hotels with many rooms, “sell-outs” have not yet occurred around them, but because the small properties with few alternatives have disappeared first, there is room for demand that starts searching late to flow toward hotels.
For Revenue Managers Operating Hotels in Himeji — Implications and an Action Plan for the Two Festival Nights
1. Watch the movement of the “sold-out property rate,” not average estimated OCC. For 10/14, estimated OCC at 45 days out was almost the same as for the weekday 10/7 (49.7% vs 50.4%). Looking at the average alone invites the judgment “weekday-level,” but the sold-out property rate was 15.4%, double the weekday, and has not fallen once since 45 days out. When checking your own pace against the market average, it is worth also confirming whether the sold-out property rate has been stuck at a high level from an early stage.
2. Yoimiya and Honmiya are both “festival nights,” but their demand shapes differ. 10/15 is a date on which estimated OCC started above the weekday and built broadly and evenly (a +12.5pt gap at 17 days out). 10/14, by contrast, is a date on which the pickup accelerated after 30 days out (+9.4pt from 30 days out to 16 days out, versus +2.0pt for the weekday). Rather than handling the two nights with the same settings, there is room to consider inventory and conditions separately for each night.
3. Inventory comes back on weekdays; on the festival night it rarely does. The 10/7 curve showed listed rooms returning at 21 and 17 days out, whereas the only return seen for 10/14 was a single very small one at 27 days out. On the festival night, inventory returned through cancellations is likely to be absorbed quickly. Leaving cancellation terms the same as on weekdays risks leaving too little time to resell rooms freed by last-minute cancellations.
4. At hotel scale, “sell-outs” have not yet happened. No property with 20 or more rooms was sold out for either 10/14 or 10/15, and the business-hotel cohort’s sold-out property rate was also 0.0%. As of the latest data (September 29), median remaining availability at properties with 20 or more rooms was in the 30% range (33.5% for 10/14, 32.4% for 10/15), leaving room for festival demand to keep coming in right up to the last minute.
| Timing | Action | Decision trigger (figures in this article) | Aim |
|---|---|---|---|
| 45 days out | Treat the two festival nights (10/14 and 10/15) as an inventory block separate from weekdays, and consider a multi-night condition (minimum length of stay) for stays that include the night of 10/14 | The market sold-out property rate is 15.4%, double the weekday (7.7%), and has not fallen since 45 days out | Avoid filling demand that is decided early entirely with one-night bookings |
| 45 days out | Separate the cancellation terms for the nights of 10/14 and 10/15 from weekdays, and consider room to bring the cancellation deadline forward | Inventory came back for the weekday 10/7 at 21 and 17 days out, but the only return for 10/14 was -0.5pt at 27 days out | Secure time to resell returned inventory |
| 30 days out | Check your own pace for 10/14 against the market’s estimated OCC at 30 days out (56.1%), and keep inventory open in anticipation of the pickup still to come | The market added +9.4pt from 30 days out to 16 days out (+2.0pt for the weekday) | Do not miss the acceleration after 30 days out |
| 30 days out | If a multi-night condition has been set, confirm whether enough single-night demand for 10/15 (Honmiya) is coming in, and keep relaxing the condition as an option | 10/15 had estimated OCC of 69.6% at 17 days out (observed September 28, 2026), +12.5pt above the weekday 10/8 | Do not lose Honmiya single-night demand through overly tight conditions |
| Final stretch (16 days out onward) | Keep rooms returned through cancellations ready for immediate resale (check returned inventory more frequently) | Median remaining availability at properties with 20 or more rooms is 33.5% (10/14), and none is sold out yet | Capture demand that starts searching at the last minute |
| Final stretch (16 days out onward) | On the premise that small properties have filled first, hold back inventory of room types suited to groups and multiple guests | Sell-outs are concentrated in small properties with fewer than 20 rooms (2 properties for 10/14) | Serve as the landing place for demand flowing from small properties |
Summary — Three Yardsticks for Reading Event Dates
The data for Himeji’s two festival nights yields three yardsticks for reading the booking status of event dates.
| Yardstick | What to look at | Values for Himeji this time |
|---|---|---|
| Volume | The level of estimated OCC and the gap versus a weekday at the same lead time | 10/14 at 65.5% at 16 days out (+6.1pt vs 10/7); 10/15 at 69.6% at 17 days out (+12.5pt vs 10/8) |
| Skew | Whether the sold-out property rate has been stuck at a high level from early on | 10/14 unchanged at 15.4% from 45 days out to 16 days out (7.7% for 10/7) |
| Returns | Whether the curve dips along the way (inventory coming back) | Returns for 10/7 at 21 and 17 days out; for 10/14 only -0.5pt at 27 days out |
Source: MetroEngines Research, compiled by the HotelBank Editorial Team
Even when estimated OCC is the same, a date on which the sold-out property rate is stuck at a high level differs from a weekday in which properties demand is concentrated in and in how quickly returned inventory is absorbed. Deciding how to open inventory, minimum length of stay and cancellation terms night by night, with these three yardsticks in view, is the foundation for event dates.
Frequently Asked Questions
Q. What are the 2026 dates of the Nada Fighting Festival?
A. In 2026, Wednesday, October 14 is Yoimiya (the festival eve) and Thursday, October 15 is Honmiya (the main day). Honmiya begins with the “Tsuyuharai no Gi” rite at around 4:30 a.m., and the procession to Mt. Otabi continues into the evening (according to the 2026 timetable on the official website).
Q. Why does the sold-out property rate differ when estimated OCC is the same as a weekday?
A. Because estimated OCC (OTA-listed inventory basis) is calculated on the volume of rooms, while the sold-out property rate is calculated on the number of properties. When properties with few rooms sell out, the sold-out property rate rises sharply even though estimated OCC barely moves. The sell-outs for 10/14 were concentrated in small properties with fewer than 20 rooms.
Q. At 45 days out, how should inventory and cancellation terms for festival dates be separated?
A. A night on which the market sold-out property rate is stuck at double the weekday level (10/14 in this article) can be treated as an inventory block separate from weekdays, with room to consider minimum length of stay and cancellation terms night by night. For 10/14, the only inventory return was -0.5pt at 27 days out and the returned inventory was quickly absorbed, so bringing the cancellation deadline forward makes it easier to secure time for resale.
Q. What should hotels with many rooms look at in the final stretch?
A. No property with 20 or more rooms was sold out for either 10/14 or 10/15, and median remaining availability was in the 30% range (33.5% for 10/14, 32.4% for 10/15, as of September 29, 2026). Because small properties have filled first, there is room for demand that starts searching late to flow in, so checking returned inventory more frequently and holding back room types suited to groups and multiple guests lets a hotel capture it.
About the Data
| Definition of estimated OCC | OTA-listed inventory-based occupancy = 100 − 100 × rooms remaining listed on OTAs ÷ total rooms. Covers a fixed cohort made up of properties that list 30% or more of their total rooms on OTAs (the same set of properties for each stay date; the property count is the size of that set). It is an estimate based on the sell-through of inventory sold on OTAs and is defined differently from actual room occupancy (it runs higher because rooms not listed are counted as sold). |
| Booking curve | Based on observations from 45 days before the stay date to the latest observation. The latest observation in this article is September 28, 2026. |
| Sold-out property rate | The share of properties with no listed inventory visible on OTAs and similar channels (estimate). Calculated on a property-count basis. |
| Scope N= | Himeji City, all properties N=26 properties / 2,823 rooms (based on listings on major booking sites) / business hotels N=12 properties / 1,918 rooms. The property-level inventory distribution covers properties that list 30% or more of their total rooms on OTAs and similar channels (N=22 properties for 10/14, N=22 properties for 10/15). |
| Data as of | September 29, 2026. Sales status and inventory change daily, so the figures in this article are a snapshot at the time of collection. |
Source: MetroEngines Research, compiled by the HotelBank Editorial Team
References and Sources
■ Data sources
Daily observations of listed inventory on major booking sites collected by MetroEngines Research (Himeji City, Hyogo; all properties N=26 properties / 2,823 rooms, business hotels N=12 properties / 1,918 rooms). The property-level inventory distribution covers properties that list 30% or more of their total rooms on OTAs and similar channels (N=22 properties for both 10/14 and 10/15). The festival schedule was confirmed on the official website of the Matsubara Hachiman Shrine autumn grand festival and the official Hyogo tourism website.
■ Calculation assumptions
Estimated OCC = 100 − 100 × rooms remaining listed on OTAs ÷ total rooms. The same set of properties (a fixed cohort) is used for each stay date, and figures are calculated by lead time from 45 days before the stay date to the latest observation (September 28, 2026). The two festival nights (10/14 and 10/15) are compared with the weekdays one week earlier on the same days of the week (10/7 and 10/8), aligned at the same lead time (16 and 17 days out). The sold-out property rate is an estimate on a property-count basis.
■ Limitations and caveats
These are estimates based on OTA-listed inventory and are defined differently from actual room occupancy (they run higher because rooms not listed are counted as sold). The sold-out property rate counts a property with one or two rooms and a 200-room property alike as one property, so it swings widely with the movements of small properties. The latest observation reaches only 16–17 days before the stay date, and final occupancy is not yet determined. Price levels are not covered.
■ External sources
Festival Timetable | Nada Fighting Festival, Matsubara Hachiman Shrine Autumn Grand Festival (in Japanese)
Festival Flow (Yoimiya) | Nada Fighting Festival, Matsubara Hachiman Shrine Autumn Grand Festival (in Japanese)
Nada Fighting Festival | Hyogo Tourism Navi (official Hyogo tourism website, in Japanese)