

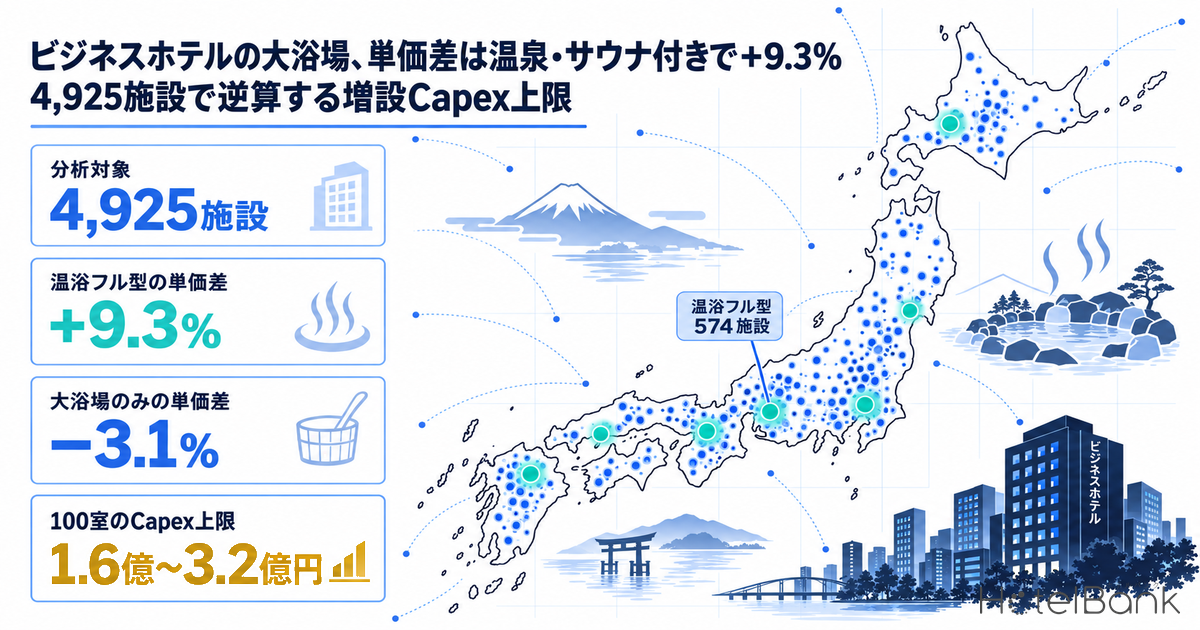
Large communal baths are often cited, alongside room size and breakfast, as one of the ways a business hotel sets itself apart. An investment decision, however, needs more than the impression that “guests like them.” It needs two numbers: how much more per night a hotel with a large communal bath sells for than a comparable hotel in the same town, and how much Capex for adding or converting to one that difference can justify. Of the 138,203 properties in Japan tracked by MetroEngines Research, 6,392 operating properties are classified as business hotels. From these we extracted the 4,925 properties (854 municipalities, 546,350 rooms) with estimated settled ADR available for the latest 12 months, and quantified the relationship between having a large communal bath and room rates.
Scope relative to earlier articles
The renewal cost of circulation-filtration and disinfection equipment for existing ryokan baths, and the related prefectural ordinance standards, are covered in a separate HotelBank article on onsen ryokan bath Capex (¥21k–¥90k per room per year). The link between in-room bathroom specifications and room rates is covered in our analysis of bath-toilet separation (+¥1,049 per m²). Renovation costs driven by ceiling regulations for banquet halls and large baths, and rankings of hotels with large baths for travelers, are also outside this article. This article is limited to business hotels, not ryokan, and addresses only one question: how much higher are room rates with a large communal bath, and how much expansion investment can that justify? Bath equipment renewal costs, ceiling regulations and property rankings are not covered.
Metric Definitions Used in This Article
- ADR (Average Daily Rate): An estimated settled rate (tax-exclusive equivalent), calculated by applying segment-specific adjustment factors to the lowest published plan price on major booking sites (per room, two guests per room, tax-inclusive). Checked against property-level actuals disclosed by listed hotel REITs (91 properties, latest 3 months), the median error is about 7%. These are estimates and differ from each property’s actual transaction prices and accounting figures. In this article, each property’s representative value is its average over settled months (at least 9) from September 2025 to August 2026.
- With a large communal bath: A property whose facility list on major booking sites includes “large communal bath” (including wording such as separate men’s and women’s large baths or a view bath). “Onsen” and “sauna” are judged from the same facility list. This reflects whether the wording is present; the size of the bath and the authenticity of the hot spring were not individually verified.
- OCC (Occupancy Rate): The calculations in this article use the business hotel occupancy rate of 75.3% from the Japan Tourism Agency’s Overnight Travel Statistics Survey, 2025 annual figures (final) (national, January–December 2025).
- Rate difference (premium): A regression estimate with log estimated settled ADR as the dependent variable, comparing properties matched on municipality, room count, opening era (and brand). It does not show causation (“rates rise because of the large bath”); it is the difference observed after matching on these conditions.
- Data source: MetroEngines Research & Consulting
- — Compared within the same municipality, properties with a large communal bath have an estimated settled ADR that is +11.9% higher. Matching on room count and opening era shrinks this to +6.0%, and matching on brand as well shrinks it to +3.1%. Most of the gap is explained by composition: the hotels that have large baths tend to be larger, newer and part of particular brands.
- — Splitting by what the bath offers, a clear premium appears only for the full-spa type, where the large bath is listed together with both “onsen” and “sauna” (574 properties): +9.3% (95% CI +6.5% to +12.1%). Large bath only (227 properties) comes in at −3.1%, with no statistically detectable rate difference.
- — The full-spa premium varies by the municipality’s price band: +14.8% in mid-priced cities where the business hotel median is ¥7,000–¥9,000, versus +3.7% (not significant) in high-priced cities at ¥9,000 and above.
- — At a base rate of ¥7,400 and OCC of 75.3% (Japan Tourism Agency, business hotels, January–December 2025 annual figure), the full-spa premium is about ¥700 per room-night, or ¥18.91M a year in room revenue for 100 rooms. Capitalizing the incremental NOI at cap rates of 4.1–6.0% gives a Capex ceiling of ¥160M–¥320M (¥1.58M–¥3.23M per room).
- — When an existing hotel gives up guest rooms to build a bath, the premium can make up for at most 6–9 rooms per 100. The case works best for properties that can repurpose non-room space (a former restaurant, banquet hall, basement, rooftop and so on).
Who has a large communal bath is skewed
First, consider the skew in the population that underlies any comparison. Of the 4,925 properties analyzed, 1,261 (25.6%) list a large communal bath in their facility list. As for the accuracy of that listing, more than 90% of properties in brands that roll out large baths as a standard feature carry the listing, while brands known not to have large baths show none, so we judged it reliable enough as a classification signal.
Placed side by side, the median estimated settled ADR is ¥7,876 for properties with a large bath versus ¥7,516 for those without, a gap of only +4.8%. Median room counts, however, differ widely at 119 versus 84 rooms, and the median opening year is slightly newer for the large-bath group at 2006 versus 2004. In other words, having a large bath is an attribute tightly bound to size, building age, brand and location, and the simple comparison cannot be read as “the price of a large bath.”
Splitting by what the bath offers into six groups makes the compositional differences even sharper. The full-spa type, where the large bath is listed along with both “onsen” and “sauna,” covers 574 properties with a median of 142 rooms, and independents (not part of a chain) make up only 30%. By contrast, the 227 large-bath-only properties have a median of 60 rooms, and independents account for 67%. The former is mainly large chain properties; the latter is mainly small and mid-sized regional independents: two entirely different populations.
| Facility group | Properties | Median est. settled ADR | Median rooms | Independent share | Median opening year | Median overall review score |
|---|---|---|---|---|---|---|
| No large bath, onsen or sauna listed | 3,353 | ¥7,396 | 80 | 52% | 2003 | 3.84 |
| Large bath only | 227 | ¥6,487 | 60 | 67% | 2002 | 3.77 |
| Large bath + sauna | 169 | ¥6,872 | 101 | 63% | 2005 | 3.91 |
| Large bath + onsen | 291 | ¥7,795 | 126 | 31% | 2006 | 3.81 |
| Full-spa type (large bath + onsen + sauna) | 574 | ¥8,787 | 142 | 30% | 2006 | 3.88 |
| No large bath listed, but sauna or onsen listed | 311 | ¥9,193 | 112 | 30% | 2006 | 3.82 |
*Estimated settled ADR is the median of property-level averages for September 2025 to August 2026. Opening year is the registered opening year, excluding the bulk-registration placeholder of January 1, 1990. Overall review score is the median on a 5-point scale for properties with 30 or more reviews (N=4,885).
Source: MetroEngines Research & Consulting (N=4,925 properties); reviews compiled by HotelBank Editorial Team
The gap shrinks as conditions are matched — from +11.9% to +3.1%
So how does the gap change as conditions are matched? The chart below shows the result of adding comparison conditions one step at a time. Comparing only within the same municipality, the rate premium for properties with a large bath is +11.9% (95% CI +9.6% to +14.1%), larger than the simple comparison’s +4.8%. Properties with large baths are concentrated in regional core cities, which skew cheaper than the national price level, so the simple comparison made the gap look smaller than it is.
Adding room count (log) and opening era brings it to +6.0%, and also matching on brand (chain affiliation, with independents as a single group) shrinks it to +3.1% (95% CI +1.1% to +5.0%). Running the same comparison on the 2,362 independents alone gives +3.3% (95% CI +0.2% to +6.5%), almost the same level. Overall, it is reasonable to read the rate difference attributable to simply having a large bath as “a few percent.”
*Regression coefficients on log ADR converted to %. All comparisons are within the same municipality (municipality fixed effects).
Source: MetroEngines Research & Consulting (N=4,925 properties; independents N=2,362)
The premium appears for the full-spa type — not for a large bath alone
The overall +3.1% is an average across properties whose bath facilities differ in substance. We therefore split large baths into four groups and, after matching on municipality, room count, opening era and brand, estimated each group’s difference from properties that list none of large bath, onsen or sauna. The results split clearly.
The full-spa type comes in at +9.3% (95% CI +6.5% to +12.1%), a significant premium that survives brand matching. Large bath + sauna is +4.0% (95% CI +0.1% to +8.1%) and large bath + onsen only +0.9% (95% CI −2.4% to +4.3%), while large bath only is −3.1% (95% CI −6.4% to +0.2%), indistinguishable from zero. Without brand matching, the full-spa type is +16.0%, and +15.2% among independents only; the size of the premium depends on the estimation method, but the ordering, “full-spa type highest, large bath alone no difference,” held in every specification.
Notably, the 311 properties that list no large bath but do list a sauna or onsen also showed a +7.2% premium (95% CI +4.3% to +10.2%). What is tied to room rates appears to be less the size of the tub than the presence of a bathing experience, such as a sauna or onsen, that can itself be a reason to stay. Simply providing a large tub is unlikely to translate into added value that shows up in the price.
*Baseline is properties listing none of large bath, onsen or sauna (3,353 properties). Regression coefficients on log ADR converted to %.
Source: MetroEngines Research & Consulting (N=4,925 properties)
| Facility group | Properties | Matched on municipality, size and era | + also matched on brand (95% CI) | Independents only (95% CI) |
|---|---|---|---|---|
| Large bath only | 227 | −3.8% | −3.1% (−6.4% to +0.2%) | −4.7% (−9.6% to +0.4%) |
| Large bath + sauna | 169 | −0.4% | +4.0% (+0.1% to +8.1%) | +6.0% (+0.1% to +12.3%) |
| Large bath + onsen | 291 | +3.9% | +0.9% (−2.4% to +4.3%) | −6.3% (−12.3% to 0.0%) |
| Full-spa type | 574 | +16.0% | +9.3% (+6.5% to +12.1%) | +15.2% (+9.9% to +20.8%) |
| No large bath listed, but sauna or onsen listed | 311 | +12.5% | +7.2% (+4.3% to +10.2%) | +11.2% (+4.9% to +18.0%) |
Source: MetroEngines Research & Consulting (N=4,925 properties; independents N=2,362)
The premium is largest in mid-priced cities and below 100 rooms
The full-spa premium is not the same size everywhere. We computed each municipality’s median estimated settled ADR for business hotels, split municipalities into three tiers — under ¥7,000 (1,839 properties), ¥7,000–¥9,000 (1,708 properties) and ¥9,000 and above (1,378 properties) — and ran the same estimate. The premium was largest in mid-priced cities at +14.8%. Low-priced cities came in at +6.1% and high-priced cities at +3.7%, with the high-priced figure not statistically significant.
The base rate (median for properties listing no large bath, onsen or sauna) is ¥5,940 in the low tier, ¥7,525 in the middle tier and ¥11,865 in the high tier. In yen, the mid-tier premium is about ¥1,100 per room-night and the low-tier premium about ¥400. In high-priced cities such as central Tokyo and central Kyoto, location and room quality determine most of the rate, which suggests bathing facilities have relatively little room to add on top.
By room count, the premium is +16.0% below 100 rooms, +2.0% at 100–199 rooms and +3.4% at 200 rooms or more, larger in the small-property band. However, neither the 100–199 nor the 200+ figure is statistically significant, and the sample of full-spa properties below 100 rooms is limited to 161. The size breakdown is best read only as showing that the full-spa premium is detectable even at small properties, not as grounds for concluding that the premium disappears at large ones.
*Full-spa rate premium (estimated with municipality, size, era and brand matched). The 95% CIs for high-priced cities, 100–199 rooms and 200+ rooms include zero.
Source: MetroEngines Research & Consulting (N=4,925 properties)
Regional distribution of the large-bath share
Next, look at it from the area side. For the 78 municipalities with 15 or more business hotels, we mapped the share of properties that list a large communal bath. Against the national average of 25.6%, regional core cities such as Kanazawa (29.5%), Hakodate (29.0%), Oita (35.7%), Asahikawa (34.8%) and Toyama (33.3%) reach around 30%, while central Tokyo wards such as Chiyoda (4.9%), Shinjuku (6.8%) and Chuo (9.1%) fall short of 10%.
This distribution is consistent with the previous section’s results. In high-priced central areas, a bath’s floor area eats heavily into guest rooms relative to land cost, and the rate uplift is small. In mid-priced regional core cities, by contrast, bathing facilities readily serve as a reason to choose a property, and hotels with large baths are in fact densely clustered there. Note also that where the large-bath share is already high in an area under consideration for acquisition or development, the differentiation effect may be approaching the level of “expected as standard.”
*Circle size = number of business hotels analyzed; shading = share of properties listing a large communal bath. 78 municipalities with 15 or more business hotels.
Source: MetroEngines Research & Consulting (N=2,297 properties)
| Municipality | Business hotels | With large bath | Full-spa type | Large-bath share | Median est. settled ADR |
|---|
*Top 15 municipalities by number of business hotels analyzed. Median estimated settled ADR is the median of property-level 12-month averages.
Source: MetroEngines Research & Consulting
Capex ceiling implied by the premium — ¥160M–¥320M for 100 rooms
From here, we convert the observed rate premium into an investment amount. The model is a 100-room business hotel. The base rate is ¥7,400, rounded from the ¥7,396 median estimated settled ADR of properties listing no large bath, onsen or sauna, and occupancy is the business hotel occupancy rate of 75.3% from the Japan Tourism Agency’s Overnight Travel Statistics Survey, 2025 annual figures (final) (national, January–December 2025). Applying the full-spa premium of +9.3% gives about ¥700 per room-night, or ¥18.91M a year in room revenue for 100 rooms.
That revenue does not all become profit, however. A bath brings utility costs for near-24-hour heating and circulation, cleaning labor, and water-quality testing and chemicals. We therefore set the share of incremental revenue retained as NOI (the flow-through rate) at two levels, 50% and 70%. NOI capitalized at a cap rate gives the Capex ceiling that can be justified from a market-value standpoint. For cap rates, we take the 4.1% expected yield for Tokyo hotels in the Japan Real Estate Institute’s 54th Real Estate Investor Survey (as of April 2026) as the floor, alongside 5.0% and 6.0% to represent regional cities.
| Rate premium | Incremental room revenue (annual) | Incremental NOI (50% flow-through) | Capex ceiling at 4.1% / 5.0% / 6.0% | Incremental NOI (70% flow-through) | Capex ceiling at 4.1% / 5.0% / 6.0% |
|---|---|---|---|---|---|
| +3.0% (typical gap for large baths overall) | ¥6.10M | ¥3.05M | ¥74M / ¥61M / ¥51M | ¥4.27M | ¥104M / ¥85M / ¥71M |
| +6.0% | ¥12.20M | ¥6.10M | ¥149M / ¥122M / ¥102M | ¥8.54M | ¥208M / ¥171M / ¥142M |
| +9.3% (full-spa type) | ¥18.91M | ¥9.46M | ¥231M / ¥189M / ¥158M | ¥13.24M | ¥323M / ¥265M / ¥221M |
| +12.0% | ¥24.41M | ¥12.20M | ¥298M / ¥244M / ¥203M | ¥17.08M | ¥417M / ¥342M / ¥285M |
| +15.0% (close to the full-spa level in mid-priced cities) | ¥30.51M | ¥15.25M | ¥372M / ¥305M / ¥254M | ¥21.36M | ¥521M / ¥427M / ¥356M |
■ Calculation assumptions: 100 rooms, base rate ¥7,400 (estimated settled ADR, tax-exclusive equivalent), OCC 75.3% (Japan Tourism Agency, January–December 2025 annual figure, business hotels), 365 days. Capex ceiling = incremental NOI ÷ cap rate. This is a simplified estimate that excludes changes in occupancy, demand effects through review scores, and major bath renewal costs.
Source: MetroEngines Research & Consulting; Japan Tourism Agency, Overnight Travel Statistics Survey; Japan Real Estate Institute, Real Estate Investor Survey
Assuming the full-spa premium is achieved, the Capex ceiling for 100 rooms is ¥158M–¥323M depending on the combination of flow-through rate and cap rate, or ¥1.58M–¥3.23M per room. If the condition is instead a simple 10-year payback, the ceiling falls to ¥95M–¥132M. For a fund’s value-add deal the former “value uplift” is likely to be the yardstick, while for a long-term owner the latter “payback period” tends to be.
On the other hand, since no rate premium was detected for large-bath-only properties, the Capex ceiling based on rate uplift alone is effectively zero. Justifying a large-bath-only addition would require separately estimating effects other than rate, such as lifting occupancy, attracting guests through review scores, or capturing multi-night stays. This article did not measure those, so they are left to property-by-property assessment.
*100-room model, flow-through rates of 50% and 70%. ■ Calculation assumptions are the same as in the table above.
Source: MetroEngines Research & Consulting
It is worth checking this against construction costs. Assuming roughly 150 m² (about 45 tsubo) of total floor area for separate men’s and women’s baths and changing rooms, and given industry commentary that “over ¥2M per tsubo is normal” for standard construction costs of bathing facilities, about ¥90M–¥135M at ¥2M–¥3M per tsubo is one benchmark. On top of this come the cost of securing hot spring water (drilling a source, piping it in, trucking it in, etc.) and sauna equipment. Against the full-spa ceiling of ¥158M–¥323M, construction alone leaves room to fit, but depending on how the hot spring water is secured, total cost can approach the ceiling. Whether to include an onsen is decided less by construction cost than by the terms on which a hot spring source can be procured.
Renovating an existing hotel — no more than 6–9 rooms per 100 can be sacrificed
Adding a large bath to an existing business hotel after the fact carries one more constraint: if the bath’s floor area comes from converting guest rooms, the revenue from those rooms is lost entirely. Annual room revenue per room is about ¥2.03M (¥7,400 × 75.3% × 365 days). If 70% of that remains as profit after variable costs, each room removed eliminates about ¥1.42M of NOI a year.
Compared with the full-spa premium, the number of converted rooms at which gains and losses balance is only 6.2 rooms per 100 at 50% flow-through and 8.5 rooms at 70%. Even with an optimistic premium of +15%, it is 9.7–13.0 rooms. In a typical business hotel lined with rooms of around 15 m², securing a 150 m² bath tends to require converting around 8–10 rooms including corridor space, which means the premium is almost entirely offset before any construction cost is paid.
*100-room model. NOI lost from converted rooms is estimated at 70% of room revenue. The premium is assumed to apply only to the remaining rooms. ■ Calculation assumptions are the same as in the earlier table.
Source: MetroEngines Research & Consulting
| Rate premium × flow-through rate | Incremental NOI with no rooms converted (annual) | Break-even rooms converted (per 100 rooms) |
|---|---|---|
| +9.3% × 50% | ¥9.46M | 6.2 |
| +9.3% × 70% | ¥13.24M | 8.5 |
| +15.0% × 50% | ¥15.25M | 9.7 |
| +15.0% × 70% | ¥21.36M | 13.0 |
Source: MetroEngines Research & Consulting
The first thing to check when considering a large bath at an existing hotel, then, is not the size of the rate premium but whether there is space other than guest rooms that can be repurposed. If an idle former restaurant or banquet hall, the area around a basement plant room, or a rooftop can be used, the premium can be captured in full without reducing rooms. When an operator proposes converting to a brand that has large baths as a standard feature, the availability of such space is likely to decide whether the proposal works.
Note that where an extension or change of use is involved, whether a building confirmation (permit) is required becomes an issue, and depending on conditions additional structural and evacuation measures may be needed. If the bath is opened to non-staying guests, a separate public bathhouse license may come into question. The burden of hygiene management and equipment renewal after completion, as organized for ryokan, applies equally to business hotels.
Implications for investment decisions
Translated into investment and renovation decisions, the results come down to three points. First, simply “having a large bath” shows no detectable rate difference; a premium is observed for the full-spa type that comes with onsen and sauna. If an addition is under consideration, the first question is whether elements that give guests a reason to stay, such as a sauna or onsen, can be incorporated, rather than how big the tub is.
Second, the size of the premium varies with the area’s price band and is largest in mid-priced cities (business hotel median of ¥7,000–¥9,000). In high-priced central districts the premium is small and the opportunity cost of floor area is high, so investment in bathing facilities is relatively less effective. For value-add deals in regional core cities, upgrading to the full-spa type can be a strong option.
Third, at an existing hotel, once room conversion exceeds 6–9 rooms the premium cannot make up the difference. In pre-acquisition due diligence, a realistic sequence is to first check for repurposable non-room space, water supply and drainage and heat-source capacity, and the terms for procuring hot spring water, and then to estimate the Capex ceiling by applying them to this article’s sensitivity table. All figures are differences observed in matched comparisons and do not guarantee that an individual property will achieve the same premium.
Methodology and sources
Of the 138,203 properties in Japan tracked by MetroEngines Research, the population is the 6,392 operating properties classified as business hotels. The analysis covers the 4,925 properties (854 municipalities, 546,350 rooms; 2,563 chain-affiliated properties in 237 groups) with estimated settled ADR available for at least 9 of the settled months from September 2025 to August 2026 and with at least 10 rooms. The rate premium is estimated by ordinary least squares with the log of each property’s 12-month average ADR as the dependent variable, removing municipality (and brand) fixed effects, with facility group, log room count and opening era (before 1990, 1990s, 2000s, 2010s, 2020 or later, unknown) as explanatory variables. Opening year is the registered value; the bulk-registration placeholder of January 1, 1990 was treated as “unknown.” Onsen and sauna listings are based on each property’s facility list and do not distinguish water quality or facility size.
Note on the estimates: The Capex ceilings in this article are simplified estimates based on the observed rate premium, Japan Tourism Agency occupancy and the expected yields in the Real Estate Investor Survey; actual investment decisions require a detailed feasibility study for each property. Estimated settled ADR is an estimate and differs from each property’s actual transaction prices.
Related Articles
References and Sources
■ Data sources
Of the 138,203 properties in Japan tracked by MetroEngines Research & Consulting, the 4,925 properties (854 municipalities, 546,350 rooms) out of 6,392 operating business hotels with estimated settled ADR available for at least 9 of the settled months from September 2025 to August 2026: room rates, facility-list wording (large bath, onsen, sauna), room counts and opening years. Occupancy is the January–December 2025 annual figure (final) from the Japan Tourism Agency’s Overnight Travel Statistics Survey; cap rates are from the Japan Real Estate Institute’s Real Estate Investor Survey (as of April 2026).
■ Calculation assumptions
100-room model, base rate ¥7,400 (estimated settled ADR, tax-exclusive equivalent), occupancy 75.3% (January–December 2025, business hotels), 365 days. Rate premium at five levels from +3.0% to +15.0%, centered on the full-spa +9.3%; flow-through of incremental revenue at 50% and 70%; cap rates of 4.1%, 5.0% and 6.0%. Capex ceiling = incremental NOI ÷ cap rate. For the room-conversion break-even, NOI lost from converted rooms is set at 70% of room revenue, and the rate premium is assumed to apply only to the remaining rooms.
■ Limitations
The rate premium is a regression estimate matched on municipality, room count, opening era and brand, and does not show the causal effect of installing a large bath. Facility classification is based on the wording of booking-site facility lists and does not distinguish bath size, water quality or quality of operation. Changes in occupancy, demand effects through review scores, and property-level differences in bath utility and major renewal costs are not included. Because the cost of securing hot spring water varies widely with source conditions, the comparison between construction cost and the ceiling is only a guide.
■ Market data
- MetroEngines Research & Consulting — Estimated settled ADR (business hotels, N=4,925, September 2025 to August 2026), facility listings, room counts and opening years
- Compiled by HotelBank Editorial Team — Overall review scores (properties with 30 or more reviews, N=4,885)
■ Government statistics and public data
- Japan Tourism Agency, Overnight Travel Statistics Survey (2025 annual figures, final) — Business hotel occupancy rate 75.3% (January–December 2025)
■ Industry reports
- Japan Real Estate Institute, 54th Real Estate Investor Survey (as of April 2026) — Expected hotel yield (Tokyo) 4.1%
- Aqutpas, “Bathing Business New Year Outlook 2024 (4)” (January 12, 2024; in Japanese) — Construction cost per tsubo for bathing facilities
- Aqutpas, “The Shock of ¥5M per Tsubo and the Future of the Bathing Business” (August 10, 2026; in Japanese)