

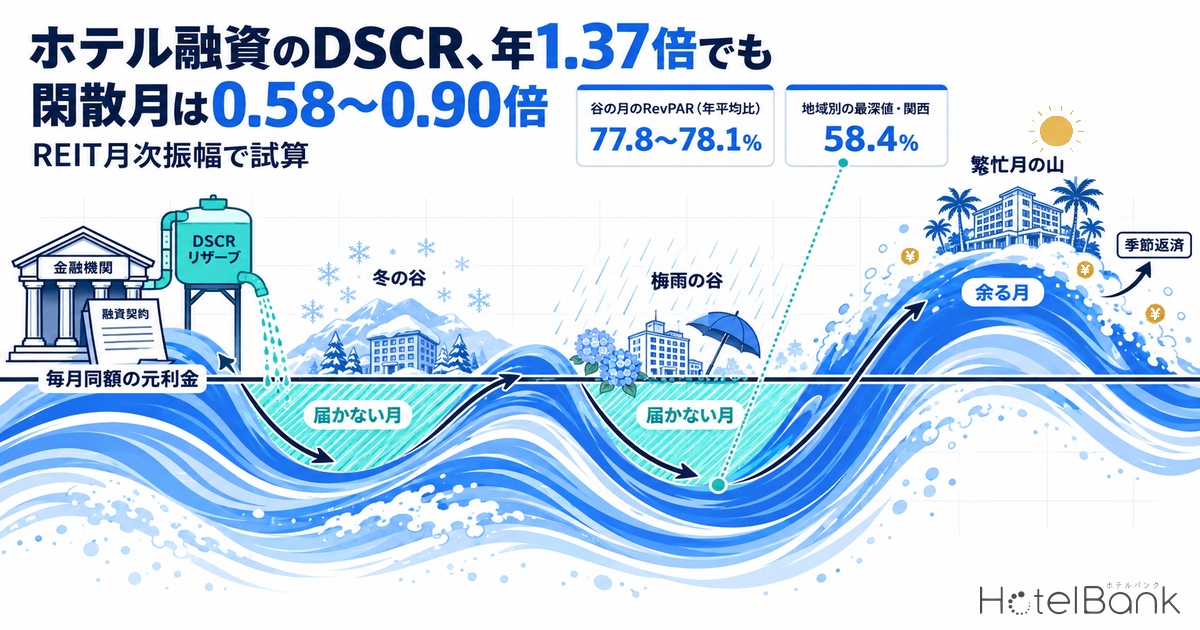
Hotel loan underwriting typically gauges repayment capacity with the DSCR (debt service coverage ratio): annual NOI (net operating income) divided by annual debt service. But while hotel revenue swings sharply from month to month, debt service goes out in the same amount every month. Lining up the monthly disclosures of listed hotel REITs for the 12 months from August 2025 to July 2026, portfolio-level RevPAR in the weakest month came in at 77.8–78.1% of the annual average. This article applies the depth of that “trough month” to a 100-room loan model and shows that even a loan with an annual DSCR of 1.37x drops to a monthly DSCR of 0.58–0.90x in off-peak months. We then estimate how much a reserve for getting through the trough (a DSCR reserve) is needed, and what “seasonal amortization”—shifting principal repayments to peak months—can achieve.
First, a note on how this piece differs from earlier HotelBank coverage. Previous articles examined the debt structures of the listed hotel REITs themselves, the borrowing ceiling implied by annual DSCR, and the relationship between loan tenor and achievable acquisition price. We have also covered prefecture-level seasonality and day-of-week swings based on OTA listing data. What is new here is that we extract the actual monthly amplitude disclosed by REITs and translate it into a loan’s monthly DSCR and reserve design. The REITs’ monthly figures are used only as secondary data to measure seasonal amplitude; we do not rank the REITs against each other. Because their mixes of hotel types and locations differ, differences in amplitude are best read as differences in portfolio character.
Metric Definitions Used in This Article
- RevPAR (room revenue per available room): Actual monthly figures disclosed by each investment corporation (total for the disclosed segment). These are not figures re-aggregated or estimated by us.
- Monthly index (annual average = 100): Each month’s value with the 12-month RevPAR average set to 100. For the cash-flow simulation, to reflect differences in the number of days per month (28–31), we use a monthly revenue index: “RevPAR × days” divided by its 12-month average.
- DSCR: Cash flow before debt service (NOI in this article) ÷ debt service (principal and interest). Annual DSCR is calculated on a full-year basis; monthly DSCR on each month’s figures.
- Fixed-cost ratio: The share of costs that are constant each month (payroll, rent, insurance, property tax, etc.) relative to contribution margin (revenue minus variable costs). This is an assumption for the simulation, not a figure from any actual property.
- Data sources: Monthly disclosures of each investment corporation (months published as of the research date, September 21, 2026). Simulations by the HotelBank Editorial Team.
- — In the monthly disclosures of four listed hotel REIT series (Aug 2025–Jul 2026), portfolio-level RevPAR in the trough month was 77.8–78.1% of the annual average, and the peak-to-trough ratio was 1.59–1.64x.
- — In Invincible Investment Corporation’s regional results for its domestic hotels, the trough deepens to 58.4% in Kansai (June 2026), and the amplitude widens to as much as 2.59x.
- — Even in a model with 100 rooms, ¥3.0bn price, 60% LTV and 2.0% interest (annual DSCR 1.37x), the trough-month DSCR falls to 0.58–0.90x at fixed-cost ratios of 40–60%.
- — A DSCR reserve covering seasonality alone equals 0.2–0.9 months of debt service at portfolio-level amplitude, and up to 3.2 months for region-specific revenue shapes.
- — With seasonal amortization that weights principal toward peak months, the trough month holds at 1.27x (JHR shape, 50% fixed-cost ratio), and the required reserve falls to zero for most revenue shapes.
Off-Peak RevPAR Is 78% of the Annual Average — Troughs Split into “January Type” and “June Type”
We indexed the last 12 months of listed hotel REITs that publish portfolio-level monthly KPIs to an annual average of 100. For Japan Hotel REIT Investment Corporation (ジャパン・ホテル・リート投資法人, 8985; “JHR”), the low was January 2026 at ¥14,185, or 77.8% of the annual average, and the high was August 2025 at ¥22,618, for a peak-to-trough ratio of 1.59x. Invincible Investment Corporation (インヴィンシブル投資法人, 8963) domestic hotels bottomed in January 2026 at ¥9,802 (78.0%), 1.62x below the peak month. Ichigo Hotel REIT Investment Corporation (いちごホテルリート投資法人, 3463) troughed in June 2026 at ¥7,147 (78.1%) and peaked in November 2025 at ¥11,466 (1.60x). Hoshino Resorts REIT (星野リゾート・リート投資法人, 3287), shown as a benchmark, fell within nearly the same range: ¥13,445 in January 2026, or 77.9% of the annual average, with a peak-to-trough ratio of 1.64x.
It is probably no coincidence that four portfolios with different hotel types and locations line up within a 0.3-point band of 77.8–78.1%. In portfolios bundling dozens of properties, the seasonality of urban and regional, business and leisure hotels offsets each other and smooths the amplitude. The timing of the trough, however, differs. JHR, Invincible and Hoshino Resorts REIT are “January type,” with January as the lowest month, while Ichigo Hotel REIT is “June type.” In fact, every series has two troughs, in January and June (JHR’s June index is 82.3; Ichigo Hotel REIT’s January index is 82.6), and which is deeper—the post-New Year lull or the rainy season—appears to flip depending on portfolio composition. From a lender’s perspective, where the trough month falls determines when reserves need to be built up.
| Investment corporation (disclosed segment) | Trough month | Trough RevPAR | vs. annual avg. | Peak month | Peak RevPAR | Peak ÷ trough | Type |
|---|---|---|---|---|---|---|---|
| Japan Hotel REIT (total of hotels with variable rent, etc.) | Jan 2026 | ¥14,185 | 77.8% | Aug 2025 | ¥22,618 | 1.59x | January type |
| Invincible (domestic hotels) | Jan 2026 | ¥9,802 | 78.0% | Aug 2025 | ¥15,875 | 1.62x | January type |
| Ichigo Hotel REIT (total of owned hotels) | Jun 2026 | ¥7,147 | 78.1% | Nov 2025 | ¥11,466 | 1.60x | June type |
| Hoshino Resorts REIT (entire portfolio, reference) | Jan 2026 | ¥13,445 | 77.9% | Aug 2025 | ¥21,991 | 1.64x | January type |
For reference, Japan’s seven listed hotel REITs are Ichigo Hotel REIT Investment Corporation (3463), Invincible Investment Corporation (8963), Nippon Hotel & Residential Investment Corporation (日本ホテル&レジデンシャル投資法人, 3472), Japan Hotel REIT Investment Corporation (8985), Hoshino Resorts REIT (3287), Mori Trust REIT (森トラストリート投資法人, 8961) and Kasumigaseki Hotel REIT (霞ヶ関ホテルリート投資法人, 401A). Of these, Nippon Hotel & Residential, Mori Trust REIT and Kasumigaseki Hotel REIT disclose monthly figures by property and do not publish portfolio-level monthly totals, so they are not included in this article’s cross-REIT index.
One more point: for the cash-flow simulation, we did not use the RevPAR index as is, but converted it into a “monthly revenue index” multiplied by the number of days in the month. Because RevPAR is a per-day figure, February, with only 28 days, generates nearly 10% less monthly revenue even when its RevPAR is average. JHR’s February RevPAR index is 90.8 versus a monthly revenue index of 83.5; Invincible’s is 93.6 versus 86.1. Since debt service is the same regardless of the number of days, it is important not to overlook this February shortfall in a loan’s monthly cash flow.
Narrow the Property Set and the Trough Deepens — Down to 58% of the Annual Average by Region
For owners of a single property, or for loans secured by one or a few assets, the 78% of a portfolio that averages out dozens of properties can be an optimistic figure. We therefore ran the same calculation on the regional monthly RevPAR that Invincible Investment Corporation discloses for its domestic hotels. Because each region contains fewer properties, the seasonality of the location shows through directly.
| Region (disclosed segment) | Trough month | Trough RevPAR | vs. annual avg. | Peak month | Peak RevPAR | Peak ÷ trough |
|---|---|---|---|---|---|---|
| Tokyo 23 wards | Aug 2025 | ¥9,392 | 74.0% | Apr 2026 | ¥16,168 | 1.72x |
| Greater Tokyo (excl. 23 wards) | Jul 2026 | ¥7,999 | 81.6% | Nov 2025 | ¥12,423 | 1.55x |
| Chubu | Jun 2026 | ¥8,698 | 73.1% | Aug 2025 | ¥15,329 | 1.76x |
| Kansai | Jun 2026 | ¥6,978 | 58.4% | Oct 2025 | ¥18,094 | 2.59x |
| Kyushu | Jan 2026 | ¥10,339 | 73.2% | Aug 2025 | ¥21,730 | 2.10x |
| Hokkaido | Apr 2026 | ¥7,991 | 62.0% | Aug 2025 | ¥18,631 | 2.33x |
| Other | Jan 2026 | ¥9,946 | 71.4% | Aug 2025 | ¥25,598 | 2.57x |
Trough depth ranges from 81.6% in Greater Tokyo (excluding the 23 wards) to 58.4% in Kansai, and the peak-to-trough ratio spans 1.55–2.59x. Compared with the portfolio total of 1.62x, a single region can widen the amplitude by up to about 1.6 times. Trough months are also scattered: August 2025 for the Tokyo 23 wards, April 2026 for Hokkaido, June 2026 for Kansai and Chubu, and January 2026 for Kyushu. The contrast—the Tokyo 23 wards, centered on urban business demand, bottoming in the August summer holidays, while leisure-driven Hokkaido and Kyushu peak in August—shows that single-asset loans need to confirm, property by property, “which month to treat as the trough.”
Kansai’s large amplitude is partly because its peak (October 2025, ¥18,094) was lifted by demand from Expo 2025 Osaka, Kansai, held from April to October 2025. In its June 2026 results, Invincible Investment Corporation cited the fall-off in Expo-related demand, a decline in visitors from China due to deteriorating Japan–China relations, and a series of typhoons. When the annual average is taken over 12 months that include an event year, the average itself runs high, making the following year’s months look like relatively deep troughs. In underwriting based on an event year’s results, re-measuring the trough against an average that excludes the event months would likely give an amplitude closer to reality.
Setting Up a 100-Room Model with an Annual DSCR of 1.37x
From here, we apply the REITs’ measured amplitude to a single loan. The model assumes a 100-room hotel acquired for ¥3.0bn (¥30M per room), with an annual NOI yield of 5% (NOI of ¥150M), 60% LTV (borrowing of ¥1.8bn), 2.0% interest, and 20-year level-payment amortization. Monthly debt service is approximately ¥9.11M, or about ¥109.27M a year, for an annual DSCR of 1.37x. According to a commentary by Mitsubishi UFJ Trust and Banking, the DSCR benchmark for real estate non-recourse loans is “generally 1.2x to 1.3x.” On an annual basis, this model exceeds that benchmark.
■ Simulation Assumptions
| Item | Assumption | Notes |
|---|---|---|
| Rooms / acquisition price | 100 rooms / ¥3.0bn | ¥30M per room (simulation) |
| Annual NOI (NOI yield) | ¥150M (5.0%) | Monthly average ¥12.5M |
| Loan amount (LTV) | ¥1.8bn (60%) | — |
| Interest rate / repayment | 2.0% / 20-year level payment | Approx. ¥9.11M per month (first-month interest ¥3.0M) |
| Annual DSCR | 1.37x | 1.31x at 2.5% interest; 1.25x at 3.0% |
| Monthly revenue shape | REIT monthly revenue index | RevPAR × days; actual shape for Aug 2025–Jul 2026 |
| Fixed-cost ratio | 40% / 50% / 60% | Share of month-constant costs relative to contribution margin |
| Monthly NOI formula | — | Average monthly NOI × (monthly revenue index − fixed-cost ratio) ÷ (1 − fixed-cost ratio) |
The monthly NOI formula assumes that fixed costs are constant each month. Even in a month when revenue falls to 80% of the annual average, payroll, rent, insurance and property tax cost almost the same, so NOI falls further than revenue—so-called operating leverage. The higher the fixed-cost ratio, the more a revenue trough is amplified into a deeper NOI trough. Note also that on September 18, 2026, the Bank of Japan raised its policy rate to around 1.25%, so interest-rate assumptions for refinancing and new loans are likely to be revisited in parallel. The higher the rate, the thinner the annual DSCR cushion, and the larger the amount by which the trough month falls short of debt service at the same amplitude.
NOI Matrix of Fixed-Cost Ratio × Amplitude — Trough-Month NOI Is 20–75% of an Average Month
Combining the trough-month revenue index with the fixed-cost ratio, we tabulated what percentage of an average month’s NOI the trough month produces, and the resulting monthly DSCR. In the 80% revenue-index row, close to the measured portfolio value, trough-month NOI at a 50% fixed-cost ratio is 60.0% of an average month (¥7.5M), falling short of the ¥9.11M debt service for a monthly DSCR of 0.82x. In the 60% row, close to the deepest regional value, NOI drops to zero at a 60% fixed-cost ratio, meaning the entire debt service would have to be paid from cash on hand.
| Trough-month revenue index | Fixed-cost ratio 40% | Fixed-cost ratio 50% | Fixed-cost ratio 60% |
|---|---|---|---|
| 85% | 75.0% (1.03x) | 70.0% (0.96x) | 62.5% (0.86x) |
| 80% (close to measured portfolio value) | 66.7% (0.92x) | 60.0% (0.82x) | 50.0% (0.69x) |
| 75% | 58.3% (0.80x) | 50.0% (0.69x) | 37.5% (0.51x) |
| 70% | 50.0% (0.69x) | 40.0% (0.55x) | 25.0% (0.34x) |
| 60% (close to deepest regional value) | 33.3% (0.46x) | 20.0% (0.27x) | 0.0% (0.00x) |
The table shows that for a loan with an annual DSCR of 1.37x, NOI alone covers debt service in the trough month only in the case of an 85% revenue index and a 40% fixed-cost ratio—that is, when amplitude is very small and fixed costs are light. Even with an 80% trough, in line with listed REIT portfolios, monthly DSCR falls below 1x across the entire 40–60% fixed-cost range.
Following the September 2026 rate hike, we also checked the trough month with interest-rate assumptions of 2.5% and 3.0%. For an 80% trough, each 0.5-point rise in interest lowers monthly DSCR by roughly 0.03–0.05x and widens the shortfall per trough month by ¥0.40–0.45M.
| Interest rate (20-year level payment) | Fixed-cost ratio 40% | Fixed-cost ratio 50% | Fixed-cost ratio 60% |
|---|---|---|---|
| 2.0% (approx. ¥9.11M/month; annual 1.37x) | 0.92x (¥0.77M short) | 0.82x (¥1.61M short) | 0.69x (¥2.86M short) |
| 2.5% (approx. ¥9.54M/month; annual 1.31x) | 0.87x (¥1.20M short) | 0.79x (¥2.04M short) | 0.66x (¥3.29M short) |
| 3.0% (approx. ¥9.98M/month; annual 1.25x) | 0.83x (¥1.65M short) | 0.75x (¥2.48M short) | 0.63x (¥3.73M short) |
Monthly DSCR Over the Year — 1.37x Annually, but 0.58–0.90x in the Trough Month
Next, we fed the measured monthly revenue indices of the four REIT series directly into the model and calculated monthly DSCR for all 12 months. At a 50% fixed-cost ratio, the January-type JHR shape gives 0.80x in January 2026, 0.92x in February and 0.85x in June—three months below 1x. The June-type Ichigo Hotel REIT shape has two such months: 0.74x in June and 0.94x in January. Peak months, by contrast, far exceed the annual 1.37x: 2.09x in August for the JHR shape and 2.02x in November for the Ichigo Hotel REIT shape. The numbers balance over the year, but month by month, “months you can’t pay” alternate with “months with surplus.”
If a covenant (financial covenant) tests DSCR quarterly, the mismatch takes on even more practical significance. January–March quarterly DSCR is 0.93–1.08x for the JHR shape and 1.02–1.14x for the Invincible shape, so even a loan with an annual DSCR of 1.37x falls below 1.2x in a quarterly test. For the June-type Ichigo Hotel REIT shape, April–June is the weakest quarter at 1.08–1.18x. The same Mitsubishi UFJ Trust and Banking commentary notes that when DSCR falls below the benchmark, a cash trap that halts distributions to equity investors is typically triggered. A structure in which a cash trap is tripped every year by seasonal troughs alone would drift away from its intended purpose for both lender and borrower.
| Revenue shape (disclosed segment) | Trough-month DSCR (fixed-cost ratio 40 / 50 / 60%) | Months below 1x (same) | Lowest quarterly DSCR (same) | Annual DSCR needed to keep trough month at 1x (same) |
|---|---|---|---|---|
| JHR shape (January type) | 0.90 / 0.80 / 0.66x | 3 / 3 / 3 | Jan–Mar: 1.08 / 1.02 / 0.93x | 1.53 / 1.71 / 2.08x |
| Invincible shape (January type) | 0.90 / 0.81 / 0.67x | 2 / 3 / 3 | Jan–Mar: 1.14 / 1.09 / 1.02x | 1.52 / 1.70 / 2.06x |
| Ichigo Hotel REIT shape (June type) | 0.85 / 0.74 / 0.58x | 1 / 2 / 2 | Apr–Jun: 1.18 / 1.14 / 1.08x | 1.62 / 1.85 / 2.35x |
| Hoshino Resorts REIT shape (reference) | 0.88 / 0.78 / 0.63x | 2 / 3 / 3 | Jan–Mar: 1.09 / 1.03 / 0.95x | 1.57 / 1.77 / 2.19x |
A Reserve to Clear the Trough: 0.2–0.8 Months of Debt Service, Up to 3 Months for Narrow Regions
How much cash must be held to cover the amount by which trough months fall short of debt service? We calculated it under two assumptions. The first assumes surplus cash in strong months is paid out to the borrower (distributed) each month; in this case, the reserve equals the total annual shortfall against debt service. The second assumes surplus cash can be swept back into the reserve; in this case, the maximum cumulative shortfall over any consecutive shortfall period is sufficient. Results are expressed in months of monthly debt service (approx. ¥9.11M).
| Revenue shape | Trough-month revenue index | Pay-out basis (annual total; 50% fixed-cost ratio) | Sweep-back basis (max. cumulative; same) | With seasonal amortization (sweep-back basis; same) | Pay-out basis range (fixed-cost ratio 40–60%) |
|---|---|---|---|---|---|
| Japan Hotel REIT | 79.2 | 0.42 months (¥3.87M) | 0.28 months (¥2.54M) | 0.00 months | 0.17–0.81 months |
| Invincible (domestic) | 79.4 | 0.36 months (¥3.32M) | 0.20 months (¥1.84M) | 0.00 months | 0.17–0.73 months |
| Ichigo Hotel REIT | 77.0 | 0.32 months (¥2.91M) | 0.26 months (¥2.36M) | 0.00 months | 0.15–0.59 months |
| Hoshino Resorts REIT (reference) | 78.3 | 0.47 months (¥4.27M) | 0.25 months (¥2.24M) | 0.00 months | 0.22–0.87 months |
| Tokyo 23 wards | 75.4 | 0.64 months (¥5.79M) | 0.56 months (¥5.12M) | 0.00 months | 0.28–1.35 months |
| Greater Tokyo (excl. 23 wards) | 80.9 | 0.24 months (¥2.21M) | 0.24 months (¥2.21M) | 0.00 months | 0.08–0.60 months |
| Chubu | 72.0 | 0.78 months (¥7.12M) | 0.40 months (¥3.61M) | 0.00 months | 0.47–1.26 months |
| Kansai | 57.5 | 2.22 months (¥20.20M) | 1.38 months (¥12.54M) | 0.12 months (¥1.13M) | 1.60–3.15 months |
| Kyushu | 74.4 | 0.62 months (¥5.62M) | 0.51 months (¥4.64M) | 0.00 months | 0.28–1.14 months |
| Hokkaido | 61.2 | 1.10 months (¥9.99M) | 0.72 months (¥6.51M) | 0.02 months (¥0.20M) | 0.77–1.72 months |
| Other | 70.6 | 1.40 months (¥12.77M) | 1.14 months (¥10.39M) | 0.00 months | 0.92–2.13 months |
At portfolio-level amplitude, the pay-out-basis reserve is 0.32–0.47 months of debt service (approx. ¥2.9–4.3M) even at a 50% fixed-cost ratio, and only 0.59–0.87 months at 60%. Applying regional shapes, however, Kansai requires 2.22 months (approx. ¥20.2M), rising to 3.15 months at a 60% fixed-cost ratio. Hokkaido needs 1.10 months and the Other region 1.40 months. When setting the number of months for a DSCR reserve on a single-asset loan, checking the required amount against a monthly shape close to the property’s location—rather than a portfolio average—leads to a more workable reserve design.
Seasonal Amortization Keeps Trough-Month DSCR at 1.27x
Instead of building a reserve, the repayment calendar itself can be matched to the revenue shape. Our “seasonal amortization” simulation pays interest (¥3.0M in the first month) every month and allocates principal repayments in proportion to each month’s “NOI − interest.” Total annual principal repaid is the same as under level payments. For the JHR shape at a 50% fixed-cost ratio, monthly debt service is about ¥5.76M in January and about ¥13.32M in August, and monthly DSCR stays within a range of 1.27x in the January trough to 1.43x in August, the highest month. As the line in the chart shows, monthly DSCR runs nearly flat around the annual 1.37x.
As the “With seasonal amortization” column of the reserve table shows, at portfolio-level amplitude the required reserve falls to zero. Shapes where trough-month NOI falls below even interest—such as Kansai (0.12 months) and Hokkaido (0.02 months)—still need a small reserve, but it shrinks to less than one-tenth of the level-payment case. Seasonal amortization gives borrowers more breathing room in trough-month cash flow, while lenders avoid covenant breaches caused by seasonality and can focus on the demand shifts that genuinely warrant attention.
The 1.2–1.3x Annual Benchmark and the Monthly Gap
Finally, let us generalize the relationship between the annual DSCR benchmark and monthly results. The annual DSCR needed to keep trough-month DSCR at or above 1x is “(1 − fixed-cost ratio) ÷ (trough-month revenue index − fixed-cost ratio).” For a portfolio-level trough (revenue index 80%), that means 1.50x at a 40% fixed-cost ratio, 1.67x at 50% and 2.00x at 60%. In other words, the common annual benchmark of 1.2–1.3x assumes income without seasonality and does not guarantee a hotel’s monthly cash flow. The key point in structuring hotel loans is to cover the gap from the benchmark (roughly 0.2–0.8x) with either a reserve or seasonal amortization.
Implications for Loan Structuring — Three Ways to Build Amplitude into Loan Terms
Based on the simulations above, there are three broad ways to handle seasonality in hotel loan underwriting and financing plans. None of them treats amplitude as something to avoid; each builds it into the terms as a characteristic of hotels as an asset class, in order to widen investment opportunities.
| Method | Description | Indicative figure from this simulation | Suitable deals |
|---|---|---|---|
| 1. Size the DSCR reserve on the monthly shape | Apply a monthly shape close to the property’s location and set the amount needed for the trough period in months | 0.2–0.9 months at portfolio level; up to 3.2 months for narrow regions | Single assets / non-recourse loans |
| 2. Seasonal amortization (monthly allocation of principal) | Pay interest monthly; weight principal toward peak months | Keeps trough-month DSCR at 1.27x (JHR shape, 50% fixed-cost ratio) | Resorts and regional cities with clear seasonality |
| 3. Align the covenant test period | Test DSCR on a trailing 12-month basis, or set seasonally adjusted thresholds for each quarter | Under calendar-quarter tests, Jan–Mar is 0.93–1.14x even at annual 1.37x | Corporate loans requiring quarterly reporting |
In a fund’s financing plan, the apparent equity yield changes depending on whether the DSCR reserve is added to the equity at acquisition, or seasonal amortization is structured and that amount is freed up for distributions. For single-asset owners, knowing the cash on hand in trough months also creates room to decide calmly on peak-month pricing and renovation timing. Operational measures that lower the fixed-cost ratio (staffing matched to busy and slow periods, use of variable rent, etc.) are themselves a source of upside for trough-month DSCR.
Frequently Asked Questions
Q. If the annual DSCR is 1.3x, is hotel loan repayment safe?
A. It may be safe on an annual basis, but month by month, NOI can fall below debt service in trough months. In our simulation, even a loan with an annual DSCR of 1.37x saw monthly DSCR fall to 0.58–0.90x at the amplitude of listed hotel REIT portfolios (trough month at about 78% of the annual average). Coverage through a reserve or seasonal amortization is a prerequisite.
Q. When are hotels’ off-peak months?
A. In the last 12 months of listed hotel REIT monthly disclosures, portfolios split into those with January as the lowest month and those with June. By region, the trough month varies with location: August for the Tokyo 23 wards, April for Hokkaido, June for Kansai and Chubu, and January for Kyushu.
Q. How many months should a DSCR reserve cover?
A. To cover seasonality alone, our simulation indicates 0.2–0.9 months of debt service at portfolio-level amplitude and up to 3.2 months at region-specific amplitude. Preparation for demand shocks needs to be considered separately, so the actual number of months is best set together with the property’s monthly results.
Summary
In the monthly disclosures of listed hotel REITs, portfolio-level RevPAR in the trough month was 77.8–78.1% of the annual average, with a peak-to-trough ratio of 1.59–1.64x. Narrowing to regions deepens the trough to 58.4% and widens the amplitude to 2.59x. Applying this amplitude to a 100-room loan model with an annual DSCR of 1.37x, trough-month DSCR is 0.58–0.90x at fixed-cost ratios of 40–60%, meaning that for one to three months a year, NOI alone cannot cover debt service. The required reserve is less than one month of debt service at portfolio-level amplitude, but exceeds three months at most for region-specific shapes. With seasonal amortization, the required reserve falls to zero for most shapes, and monthly DSCR stabilizes near the annual level. Taking the annual 1.2–1.3x benchmark as a starting point while designing reserves and repayment calendars around each property’s monthly shape is likely to be the key to widening the room for hotel loans to get done.
Related Reading
References and Sources
■ Data Sources
Monthly RevPAR results published by four listed hotel REITs (Japan Hotel REIT Investment Corporation, Invincible Investment Corporation, Ichigo Hotel REIT Investment Corporation and Hoshino Resorts REIT) (totals for each disclosed segment, August 2025–July 2026), and Invincible Investment Corporation’s regional results for domestic hotels. No figures re-aggregated or estimated by us are used. Nippon Hotel & Residential Investment Corporation, Mori Trust REIT and Kasumigaseki Hotel REIT do not publish portfolio-level monthly totals and are excluded from the cross-REIT index.
■ Simulation Assumptions
100 rooms, acquisition price ¥3.0bn, NOI yield 5.0%, LTV 60%, interest 2.0%, 20-year level payment (approx. ¥9.11M per month; annual DSCR 1.37x). The monthly revenue index is RevPAR × days divided by its 12-month average. Monthly NOI = “average monthly NOI × (monthly revenue index − fixed-cost ratio) ÷ (1 − fixed-cost ratio),” with three fixed-cost ratios: 40%, 50% and 60%. Seasonal amortization pays interest monthly and allocates principal in proportion to each month’s “NOI − interest.”
■ Limitations
REIT monthly figures are portfolio values averaged over dozens of properties; as the regional results show, single-asset amplitude can be larger. Invincible Investment Corporation’s domestic hotels changed from 91 to 101 properties in January 2026, and Japan Hotel REIT Investment Corporation’s disclosed segment changed to the total of 29 hotels with variable rent, etc. from 2026, so the 12 months do not compare an identical property set. The Kansai peak includes demand from Expo 2025 Osaka, Kansai (April–October 2025). The variable-cost ratio is assumed constant across months, and FF&E reserves, taxes and demand shocks are not considered. Simulated values do not represent any specific property or loan terms.
■ REIT Monthly Disclosures (Japanese)
- Japan Hotel REIT Investment Corporation: Monthly results of hotels with variable rent, etc. (through July 2026, as of August 26, 2026)
- Invincible Investment Corporation: “Notice Concerning Portfolio Operating Results (July 2026)” (including monthly editions from August 2025 to June 2026)
- Invincible Investment Corporation: “Notice Concerning Portfolio Operating Results (December 2025)”
- Invincible Investment Corporation: “Notice Concerning Portfolio Operating Results (June 2026)”
- Ichigo Hotel REIT Investment Corporation: “Notice of Hotel Operating Status (July 2026)” (including monthly editions from August 2025 onward)
- Hoshino Resorts REIT: IR Library (monthly disclosures)
■ DSCR and Lending Practice (Japanese)
- Mitsubishi UFJ Trust and Banking, “Mitsubishi UFJ Trust Asset Management Information,” October 2018: “Real Estate Debt Fund Investment”
- JAPAN-REIT.COM Glossary: “DSCR”
■ News (Japanese)