

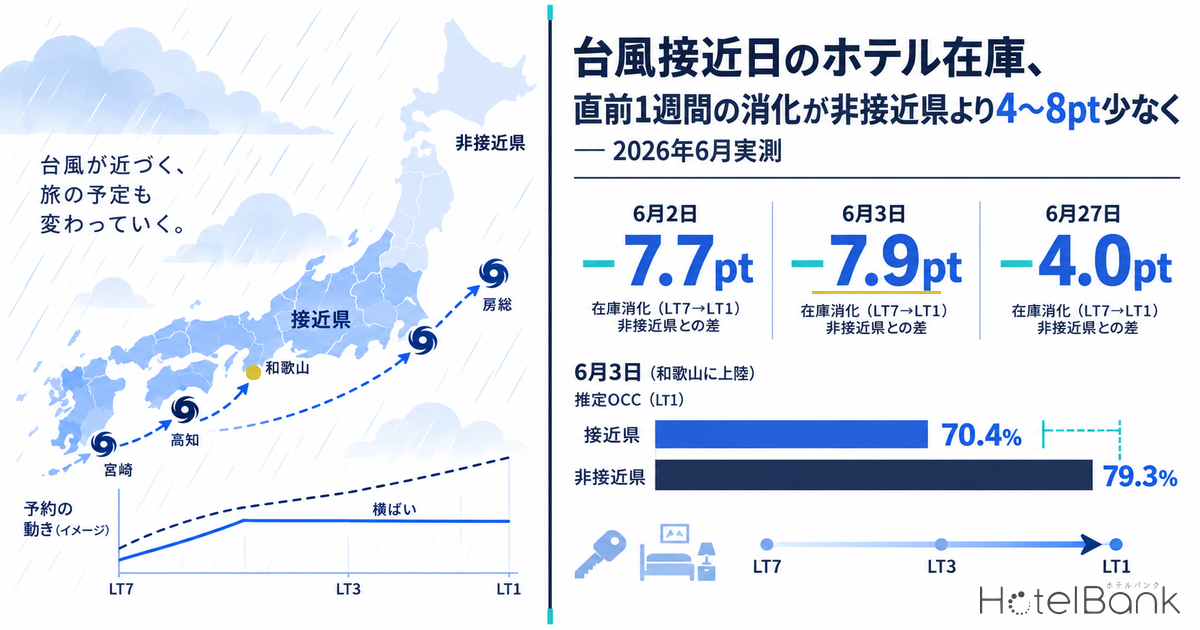
On stay dates when a typhoon approaches, rooms stop filling in the last few days before check-in. Hotel operators know this from experience, but how large the gap is, and how it compares with regions the typhoon never touched, has rarely been put into numbers. For this article we took three stay dates in June 2026 when Typhoons No. 6, 7 and 8 approached or made landfall on the Japanese mainland, identified from the Japan Meteorological Agency (JMA) “Typhoon Position Table (preliminary)”. We then compared the remaining-inventory trajectories of “approach prefectures”, where the typhoon center passed within 100km of the prefectural capital, and “non-approach prefectures”, where it stayed 450km or more away, against normal days on the same weekday. All stay dates covered are in the past; this article makes no forecasts for future dates.
Metric Definitions Used in This Article
- LT (lead time): Days before the stay (check-in) date. LT7 = 7 days before the stay date, LT1 = the day before. Same-day (LT0) observations are not used here, because they mix in check-in-day sales cut-off behavior.
- Remaining-room rate: Total remaining rooms listed by the target properties on OTAs and similar channels, divided by the total room count of those properties (room basis).
- OCC (occupancy): Share of rooms sold out of total rooms in the area (an estimate based on OTA sales inventory). Here it is 100 minus the remaining-room rate. It is an estimate based on how OTA-listed inventory sells through and differs from a property’s actual overall occupancy.
- Inventory sell-through: How many points the remaining-room rate fell between LT7 and LT1. A smaller value means rooms did not fill during the final week.
- Inventory return: A property’s remaining rooms increasing by one or more between LT3 and LT1. This includes cancellations, a property reopening sales, and additional inventory release; public data cannot tell these apart.
- Listed price: Per-room rate for two guests sharing one room (tax included). Area aggregates use the average listed price of the target properties; property-level figures use each property’s lowest listed rate. These are not transaction prices.
- Population: All aggregates cover only properties that list at least 30% of their total rooms on OTAs (for properties with a small OTA allocation, changes in remaining rooms do not reflect overall supply and demand).
- Data source: MetroEngines Research. Weather facts are from the JMA “Typhoon Position Table 2026 (preliminary)” and others (see the source list at the end).
For Typhoons No. 9, 13 and 15 in July and August, we covered the lead times at which inventory came back, focusing on Okinawa and Kagoshima, in Typhoon Stays: 48.3% of hotels get inventory back in the final 2-3 days, 3.1x normal days (July-August 2026 data). This article looks at three events from the preceding June and changes the axis of comparison. Besides comparing against normal days in the same prefecture, we subtract the same-day movement in non-approach prefectures unaffected by the typhoon. This strips out the “it was slow everywhere that day” factor before measuring the gap.
- — 4.0-7.9 points: On three stay dates in June 2026 (June 2, 3 and 27), LT7-to-LT1 inventory sell-through in approach prefectures was 4.0-7.9 points below normal days, even after subtracting the change in non-approach prefectures. On August 11 the gap was 1.0 point.
- — Estimated OCC 87.5%: The LT1 figure for the four approach prefectures on Saturday, June 27, 2026, about 5 points below the Saturdays before and after (92.2% and 93.4%). No recovery was seen on the following Sunday either.
- — 3.7-4.1x normal days: The share of properties whose inventory came back between LT3 and LT1 was 15.5-30.6% in June’s approach prefectures. Another 5-11% returned five or more rooms at once.
- — 45-72% held prices: Most properties whose inventory came back kept their lowest listed rate unchanged, much like on normal days (38-65%). Typhoon-day pricing remains an area each property is free to design.
Stay Dates Covered: Typhoon No. 6’s Approach and Landfall, and the Passage of Typhoons No. 7 and 8
According to JMA typhoon statistics, two typhoons made landfall in Japan in 2026 as of September 9 (preliminary), one in June and one in August. The June one was Typhoon No. 6 (Jangmi). According to the JMA’s general weather commentary, it made landfall in southern Wakayama at around 4:30 a.m. on June 3 and moved east-northeast near Tanabe City. It was the first June landfall in 14 years, since 2012. On June 27, Typhoons No. 7 and 8 passed eastward along the southern coast of Honshu one after the other.
We classified approach and non-approach prefectures by calculating the shortest distance from each prefectural capital to the typhoon center positions listed at 1- to 3-hour intervals in the JMA “Typhoon Position Table”. The JMA defines an “approach” as the typhoon center coming within 300km of a weather station. To focus on the more strongly affected zone, we defined “approach prefectures” as those where the center came within 100km on the stay date itself. The control “non-approach prefectures” are those where the center stayed 450km or more away for the three days from the day before to the day after the stay date.
| Stay date | Typhoon | Meteorological course (JMA “Typhoon Position Table” preliminary and others) | Approach prefectures (within 100km) | Non-approach prefectures (over 450km) |
|---|---|---|---|---|
| Jun 2 (Tue) | No. 6 | Formed at 9:00 on May 27. At 18:00 on June 2, off Miyazaki with central pressure of 980hPa; at 23:00, off Kochi moving northeast | Miyazaki, Kochi, Kagoshima | Hokkaido, Aomori, Iwate, Akita |
| Jun 3 (Wed) | No. 6 | Landfall in southern Wakayama around 4:30. Moved east from the Kii Peninsula along the southern coasts of Tokai and Kanto; became an extratropical low at 21:00 | Mie, Wakayama, Nara, Tokushima, Shizuoka, Kochi | Hokkaido, Aomori, Iwate, Akita |
| Jun 27 (Sat) | No. 7 and No. 8 | No. 8 (998hPa) moved northeast from the northern Izu Islands past the Boso Peninsula early in the morning, becoming an extratropical low at 9:00. No. 7 (992hPa) moved east over the sea south of Shikoku and the Kii Peninsula during the day, becoming an extratropical low at 21:00 | Chiba, Tokyo, Kanagawa, Shizuoka | Hokkaido, Aomori |
| Aug 11 (Tue, holiday) | No. 15 | Landfall in southern Ibaraki around 20:00 (the first landfall in Ibaraki since records began in 1951). Crossed Kanto westward | Ibaraki, Chiba, Saitama, Tokyo, Kanagawa, Tochigi, Gunma, Yamanashi | Hokkaido, Aomori, Fukuoka, Saga, Nagasaki, Kumamoto, Miyazaki, Kagoshima, Okinawa |
Source: Compiled by HotelBank Editorial Team from JMA “Typhoon Position Table 2026 (preliminary)” and “Number of Typhoon Landfalls”, Japan Weather Association, and Weathernews. Approach / non-approach classification calculated by us from the distance between the typhoon center and each prefectural capital
For normal days we took the same weekday one week before and one week after in the same prefecture (for June 2, that means May 26 and June 9) and used their average. Booking-curve shapes vary a lot by weekday, so the weekday is held constant. August 11 was Mountain Day, a public holiday, while the comparison days of August 4 and 18 were weekdays. Because the holiday effect applies to both approach and non-approach prefectures, subtracting the non-approach movement matters especially on this date.
Final-Week Sell-Through Slowed Only in Approach Prefectures on All Three June Dates
The conclusion first. Comparing how many points the remaining-room rate fell between LT7 and LT1 (inventory sell-through), approach prefectures sold through less than on normal days on all three June stay dates, while non-approach prefectures stayed roughly at normal-day levels. After subtracting the change in non-approach prefectures, the gap was 7.7 points on June 2, 7.9 points on June 3 and 4.0 points on June 27.
| Stay date | Group | Coverage | Remaining-room rate LT7 | LT3 | LT1 | Sell-through (typhoon day) | Sell-through (normal days) | Gap |
|---|---|---|---|---|---|---|---|---|
| Jun 2 | Approach | 472 properties / 21,782 rooms | 47.8% | 42.2% | 41.1% | 6.7pt | 14.4pt | -7.7pt |
| Non-approach | 979 properties / 72,895 rooms | 31.5% | 27.1% | 22.3% | 9.2pt | 9.2pt | 0.0pt | |
| Jun 3 | Approach | 1,261 properties / 62,230 rooms | 34.3% | 33.5% | 29.6% | 4.7pt | 11.5pt | -6.8pt |
| Non-approach | 980 properties / 72,931 rooms | 30.2% | 26.3% | 20.7% | 9.5pt | 8.4pt | +1.1pt | |
| Jun 27 | Approach | 2,284 properties / 188,213 rooms | 15.1% | 13.0% | 12.5% | 2.6pt | 6.8pt | -4.2pt |
| Non-approach | 730 properties / 58,078 rooms | 9.5% | 7.7% | 4.9% | 4.6pt | 4.8pt | -0.2pt | |
| Aug 11 | Approach | 2,652 properties / 210,623 rooms | 21.4% | 16.6% | 11.7% | 9.7pt | 11.3pt | -1.6pt |
| Non-approach | 2,878 properties / 170,749 rooms | 16.9% | 14.4% | 10.7% | 6.2pt | 6.8pt | -0.6pt |
Source: Compiled by MetroEngines Research and HotelBank Editorial Team. Only properties listing at least 30% of total rooms on OTAs are included (based on major booking-site listings; property and room counts as of LT1 on the typhoon day). Normal days = average of the same weekday one week before and after in the same prefecture
In the June 2 approach prefectures (Miyazaki, Kochi, Kagoshima), the remaining-room rate would normally fall 14.4 points between LT7 and LT1, but on the typhoon day it fell only 6.7 points. In the four non-approach prefectures of Hokkaido and Tohoku, it was 9.2 points on both the typhoon day and normal days. Note that for June 2 the approach prefectures already had a higher remaining-room rate than normal days at LT7 (May 26, before Typhoon No. 6 had formed), meaning bookings were lighter than usual on this date to begin with. That is why this article compares the size of the change from LT7 to LT1 rather than the level of the remaining-room rate. June 3 shows the same pattern: sell-through in approach prefectures was just 4.7 points versus 11.5 points on normal days, while non-approach prefectures actually beat normal days by 1.1 points.
On August 11, by contrast, the gap between approach prefectures and normal days was 1.6 points, and only 1.0 point after subtracting non-approach prefectures. Because all of Kanto was counted as approach prefectures, Tokyo and Kanagawa, far from the landfall point, filled at normal-day levels and lifted the average. By prefecture, Ibaraki, near the landfall point, actually saw remaining rooms rise 0.4 points between LT3 and LT1 (versus a 6.1-point decline on normal days), and Chiba’s sell-through was 2.9 points versus 7.6 points on normal days. With landfall around 8 p.m. coinciding with a public holiday, the impact on this date appears to have been concentrated near the landfall point.
The June 3 Booking Curve: Estimated OCC Flat from LT6 to LT2
Overlaying the booking curve for the stay date of Typhoon No. 6’s landfall with the Wednesdays one week before and after shows when the gap opened. At LT7 (May 27), estimated OCC was 65.7%, between the two normal days (70.5% and 65.2%). Typhoon No. 6 formed at 9:00 on exactly May 27. From there, while the normal-day curves climbed to 78-81% by LT1, the June 3 curve stayed almost flat for five days, from 66.5% at LT6 to 66.3% at LT2.
Source: Compiled by MetroEngines Research and HotelBank Editorial Team. Approach prefectures = Mie, Wakayama, Nara, Tokushima, Shizuoka, Kochi (June 3: 1,261 properties / 62,230 rooms); non-approach prefectures = Hokkaido, Aomori, Iwate, Akita (980 properties / 72,931 rooms). Only properties listing at least 30% of total rooms on OTAs (based on major booking-site listings). Estimated OCC is based on OTA-listed inventory
The June 3 curve for non-approach prefectures (navy dashed line) kept rising in the same shape as normal days, reaching an estimated OCC of 79.3% at LT1. Approach prefectures were at 70.4% at LT1, 8.9 points below the normal-day average of 79.3%. Since the gap at LT7 was about 2 points, most of it opened between LT7 and LT2.
All six approach prefectures moved in the same direction. Ranking LT3-to-LT1 sell-through by prefecture, all six were 1.6-4.7 points below normal days on June 3. In Miyazaki on June 2, and in Kanagawa and Shizuoka on June 27, the prefecture-wide remaining-room rate actually rose between LT3 and LT1.
| Stay date | Prefecture | Properties / rooms | Estimated OCC (LT1) | LT3-to-LT1 sell-through (typhoon day) | Same (normal days) |
|---|---|---|---|---|---|
| Jun 2 | Miyazaki | 111 / 6,179 | 51.6% | -4.6pt (rooms up) | 7.3pt |
| Jun 2 | Kochi | 80 / 4,540 | 70.8% | 1.7pt | 5.5pt |
| Jun 2 | Kagoshima | 281 / 11,063 | 58.1% | 3.9pt | 7.1pt |
| Jun 3 | Mie | 219 / 13,030 | 69.4% | 4.5pt | 6.7pt |
| Jun 3 | Wakayama | 161 / 7,244 | 61.7% | 3.6pt | 5.4pt |
| Jun 3 | Nara | 88 / 4,499 | 79.0% | 4.8pt | 9.5pt |
| Jun 3 | Tokushima | 76 / 3,572 | 75.8% | 3.9pt | 5.5pt |
| Jun 3 | Shizuoka | 636 / 29,285 | 70.5% | 3.7pt | 7.0pt |
| Jun 3 | Kochi | 81 / 4,600 | 74.1% | 3.4pt | 6.0pt |
| Jun 27 | Chiba | 317 / 22,724 | 81.5% | 0.2pt | 5.0pt |
| Jun 27 | Tokyo | 800 / 103,914 | 92.4% | 1.8pt | 2.9pt |
| Jun 27 | Kanagawa | 421 / 30,962 | 86.5% | -1.8pt (rooms up) | 3.5pt |
| Jun 27 | Shizuoka | 746 / 30,613 | 76.3% | -1.8pt (rooms up) | 4.7pt |
| Aug 11 | Ibaraki | 158 / 8,966 | 78.0% | -0.4pt (rooms up) | 6.1pt |
| Aug 11 | Chiba | 297 / 22,957 | 86.6% | 2.9pt | 7.6pt |
Source: Compiled by MetroEngines Research and HotelBank Editorial Team. Only properties listing at least 30% of total rooms on OTAs (based on major booking-site listings). Negative sell-through means the prefecture-wide remaining-room rate rose between LT3 and LT1. For August 11, only the two prefectures closest to the landfall point are shown
Saturday, June 27: Estimated OCC of 87.5%, 5 Points Below the Surrounding Saturdays
June 27 was a Saturday, normally the busiest stay date of the week. In the four approach prefectures of Chiba, Tokyo, Kanagawa and Shizuoka, estimated OCC at LT1 was 87.5%, about 5 points below both the previous Saturday, June 20 (92.2%), and the following Saturday, July 4 (93.4%). On the same day the non-approach prefectures (Hokkaido, Aomori) reached 95.1%, actually above the surrounding Saturdays (93.5% and 92.8%).
Source: Compiled by MetroEngines Research and HotelBank Editorial Team. Four prefectures of Chiba, Tokyo, Kanagawa and Shizuoka; 2,152-2,295 properties / 186,314-189,334 rooms per stay date (only properties listing at least 30% of total rooms on OTAs, based on major booking-site listings). Estimated OCC and listed price are both as of the day before each stay date (LT1). Listed price is the average across target properties (two guests per room, tax included)
Listed prices are shown alongside. On June 27 the average listed price at LT1 was ¥28,800, below ¥30,500 on June 20 and ¥35,700 on July 4. In terms of the change from LT3 to LT1, approach prefectures fell 7.6%, a drop 2.7 points larger than the normal-day average of 4.9%. However, non-approach prefectures also saw a drop 2.3 points larger than normal on this date. On June 3 too, the extra drop was 3.5 points in approach prefectures and 2.1 points in non-approach prefectures, the same direction of movement. Area-average listed prices also reflect changes in mix, namely which plans remain unsold, so what the data can say is that the price movement attributable specifically to the typhoon is limited.
Stay dates the day after the typhoon passed did not bounce back right away either. In the four approach prefectures of June 27, estimated OCC for the next day, Sunday, June 28, was 78.7%, about 2 points below the surrounding Sundays (June 21: 81.3%, July 5: 80.7%). For the six approach prefectures of June 3, the next day, Thursday, June 4, was 77.2%, lower than the surrounding Thursdays (May 28: 80.8%, June 11: 79.4%). Within the range observed here, there was no meaningful catch-up on the stay date right after the typhoon cleared.
At the Property Level: Last-Minute Inventory Returns at 3.7-4.1x Normal Days
The area-wide remaining-room rate is the net of properties that fill and properties that get rooms back. Counting, at the property level, the share of properties whose remaining rooms rose by one or more between LT3 and LT1 (inventory return) makes the typhoon-day pattern even clearer. On June 2, inventory came back at 18.9% of approach-prefecture properties (96 of 507), 4.1 times the normal-day 4.6%. On June 3 it was 15.5% versus 4.2% (3.7x), and on June 27, 30.6% versus 7.7% (4.0x).
Source: Compiled by MetroEngines Research and HotelBank Editorial Team. Covers properties listing at least 30% of total rooms on OTAs with remaining-room observations at both LT3 and LT1. Approach prefectures on typhoon days: 507 properties on June 2, 1,553 on June 3, 2,424 on June 27 and 3,122 on August 11. Normal days = total of the same weekday one week before and after
In non-approach prefectures, inventory returns were 5.8% on June 2 (normal days 5.2%) and 7.7% on June 27 (6.4%), only about 1 point off normal days. Non-approach prefectures on June 3 reached 9.3%, above the normal-day 5.0%, but still well short of the 15.5% in approach prefectures. On August 11, approach prefectures were 7.9% versus 5.1% on normal days and non-approach 6.9% versus 6.9%; as with area-wide sell-through, the gap was small.
The scale of the returns also differed. Properties that got five or more rooms back at once between LT3 and LT1 made up 7.3% in approach prefectures on June 2 (normal days 0.9%), 5.0% on June 3 (0.8%) and 11.3% on June 27 (1.5%). In other words, on June 27 roughly one in nine approach-prefecture properties returned five or more rooms to inventory in the two days before the stay. Inventory return here includes rooms released back into sale by cancellations, as well as properties reopening sales they had paused or releasing additional inventory; public data cannot tell these apart.
Lowest Listed Rates at Properties with Returned Inventory: Mostly Unchanged, as on Normal Days
At what price did properties relist the inventory that came back at the last minute? For properties where an inventory return was observed, we compared the lowest listed rate at LT3 and LT1, treating a change within ±1% as “held”. On typhoon days in approach prefectures, 66.7% held on June 2, 71.7% on June 3 and 45.5% on June 27. Price cuts were 27.1%, 23.8% and 46.6% in the same order, and increases 6.3%, 4.6% and 8.0%.
Source: Compiled by MetroEngines Research and HotelBank Editorial Team. Covers approach-prefecture properties whose remaining rooms rose by one or more between LT3 and LT1 (typhoon days: 96 properties on June 2, 240 on June 3, 741 on June 27, 247 on August 11; normal days: 52, 130, 351 and 294 respectively). Change in lowest listed rate (two guests, per room, tax included) from LT3 to LT1; within ±1% counted as held
The right benchmark is the same behavior on normal days. Among properties whose inventory came back on normal days, the hold rate was 59.6% on the June 2 comparison days, 65.4% for June 3 and 38.5% for June 27. Typhoon-day hold rates were 6-7 points higher than normal days, and the share of price cuts was similar to or slightly lower than normal days. The number of inventory returns rose to 3.7-4.1 times normal days, but the pricing of each returned unit barely differed from normal days.
June 27 alone had a high 46.6% share of price cuts, but 46.2% also cut on the normal comparison days (June 20 and July 4), so trimming the lowest rate just before a Saturday happens regardless of typhoons. On August 11, cuts were 34.4% (normal days 32.7%) and increases 12.1% (11.2%), with the hold rate slipping to 53.4% (56.1%), meaning movement in both directions rose slightly. This matches the direction of the trend reported for Typhoon No. 15’s approach day in Ibaraki, Chiba and Shizuoka (59% held, 28% cut, 13% raised) in our analysis of typhoon approach days in July-August 2026.
Preparing Last-Minute Inventory for Approaching Typhoons: What the Data Shows
Here we bring the numbers above closer to day-to-day operations and revenue management. All points are facts based on observations from three dates in June 2026 and August 11; they do not predict that the next typhoon will behave the same way.
1. The gap opened between the typhoon’s formation and track reports and the day before the stay. In the June 3 example, estimated OCC at LT7 (May 27) was at normal-day levels, and the gap opened from LT6 to LT2 after Typhoon No. 6 formed. On June 27 the gap versus normal days was around 1 point through LT4 and widened from LT3 onward. In the observed data, the period that called for attention to last-minute inventory was concentrated in the few days between the typhoon’s formation and the day before the stay.
2. Inventory returns were not the exception: they occurred at 15-31% of properties in approach prefectures on the three June dates. On June 27, 30.6% of approach-prefecture properties saw inventory come back between LT3 and LT1, and 18.9% on June 2. Another 5-11% got five or more rooms back at once. If returned inventory is treated as “rooms that can be sold again”, deciding in advance which channel to relist them on and at what price reduces time lost to hesitation in the final days.
3. Pricing of returned inventory behaved the same as on normal days. On typhoon days, 45-72% of approach-prefecture properties whose inventory came back held their lowest listed rate. That is not much different from the normal-day hold rate (38-65%). Even when an external event like a typhoon increased inventory, pricing rules were run as usual. Whether to have a dedicated typhoon-day pricing policy remains an area each property is free to design.
4. The impact was limited to approach prefectures; non-approach prefectures were business as usual. On all four dates, sell-through in non-approach prefectures stayed within 1.1 points of normal days. For national chains and operators with properties in several prefectures, this means the response can be focused on properties in prefectures on the typhoon’s track.
5. Public data can say little about sales channels. What this article observes is remaining rooms listed on OTAs; bookings and cancellations via direct sales, phone or travel agencies are not visible. What is certain is that in approach prefectures, more sellable OTA rooms came back between LT3 and LT1 than on normal days. Whether to keep those rooms on OTAs or hold them as an allocation for stranded travelers and corporate clients via direct or phone booking is a decision for each property.
Every typhoon takes a different track, and its effect also changes with the time of landfall, the day of the week and overlap with holidays. In a case like August 11, with landfall on a holiday evening, there was hardly any gap across Kanto as a whole, and the impact was concentrated in Ibaraki and Chiba near the landfall point. The starting point for preparation is likely to build up past observations like these and look for cases close to your own conditions. We cover how resilient different property types are to weather in Typhoon-heavy August-September: hotels with high “indoor completeness” that support occupancy.
Methodology and caveats: Approach and non-approach prefectures were classified by us from the distance between the center positions in the JMA “Typhoon Position Table (preliminary)” and each prefectural capital, which differs from the JMA definition of “approach” (within 300km of a weather station). The Typhoon Position Table is preliminary and may be revised later. Remaining rooms, estimated OCC and listed prices are aggregated from properties listing at least 30% of total rooms on OTAs, so the number of target properties varies slightly by stay date. Estimated OCC is an estimate based on how OTA-listed inventory sells through and differs from a property’s actual overall occupancy. Property-level inventory returns and lowest listed rates cover only properties with observations at both LT3 and LT1.
Related Articles
- Typhoon Stays: 48.3% of hotels get inventory back in the final 2-3 days, 3.1x normal days (July-August 2026 data)
- Typhoon-Heavy Aug-Sep 2026: “Indoor-Complete” Hotels Defend Occupancy, a Property-Type Analysis for an Era of Weather Risk
References and Sources
■ Data sources
MetroEngines Research OTA-listed remaining rooms and listed prices (two guests per room, tax included) by stay date and lead time. Prefecture-level aggregates use a fixed cohort of properties listing at least 30% of total rooms on OTAs (for example, the four approach prefectures on June 27: N=2,284 properties / 188,213 rooms). Weather facts are from the JMA “Typhoon Position Table (preliminary)” and others.
■ Calculation assumptions
Inventory sell-through = remaining-room rate at LT7 minus remaining-room rate at LT1. “Gap” in Table 2 = typhoon-day sell-through minus normal-day sell-through; the “gap after subtracting non-approach prefectures” in the text = approach-prefecture gap minus non-approach-prefecture gap (for example, June 3: -6.8pt – (+1.1pt) = -7.9pt). Normal days = average of the same weekday one week before and after in the same prefecture. A property-level inventory return is a property whose remaining rooms rose by one or more from LT3 to LT1; a price is counted as held when the lowest listed rate changed within ±1%.
■ Limitations and caveats
Observations cover OTA-listed inventory only and exclude bookings and cancellations via direct sales, phone or travel agencies. The breakdown of inventory returns (cancellations, reopened sales, additional inventory release) cannot be distinguished. The analysis is limited to four stay dates in 2026 and does not predict behavior in the next typhoon. The Typhoon Position Table is preliminary and may be revised later.
- Japan Meteorological Agency, “Typhoon Position Table 2026” (Typhoons No. 6, 7, 8 and 15, preliminary)
- Japan Meteorological Agency, “Number of Typhoon Landfalls (confirmed through 2025, preliminary for 2026)” (as of September 9, 2026)
- Japan Meteorological Agency, “Number of Typhoon Approaches to Japan (confirmed through 2025, preliminary for 2026)” (definition of approach)
- JMA General Weather Commentary on Typhoon No. 6 (Bulletin No. 20), issued 4:43 on June 3 (Kyoto Shimbun Digital)
- Typhoon No. 6 makes landfall in southern Wakayama, the fourth-earliest landfall on record (Japan Weather Association tenki.jp, June 3, 2026)
- Typhoon No. 15 makes landfall in southern Ibaraki, the first landfall in Ibaraki on record (Japan Weather Association tenki.jp, August 11, 2026)
- Typhoon No. 15 (Chan-hom) makes landfall in southern Ibaraki, a first on record (Weathernews, August 11, 2026)
- MetroEngines Research: remaining-room trajectories of OTA-listed inventory, estimated OCC and listed prices (properties listing at least 30% of total rooms on OTAs)