

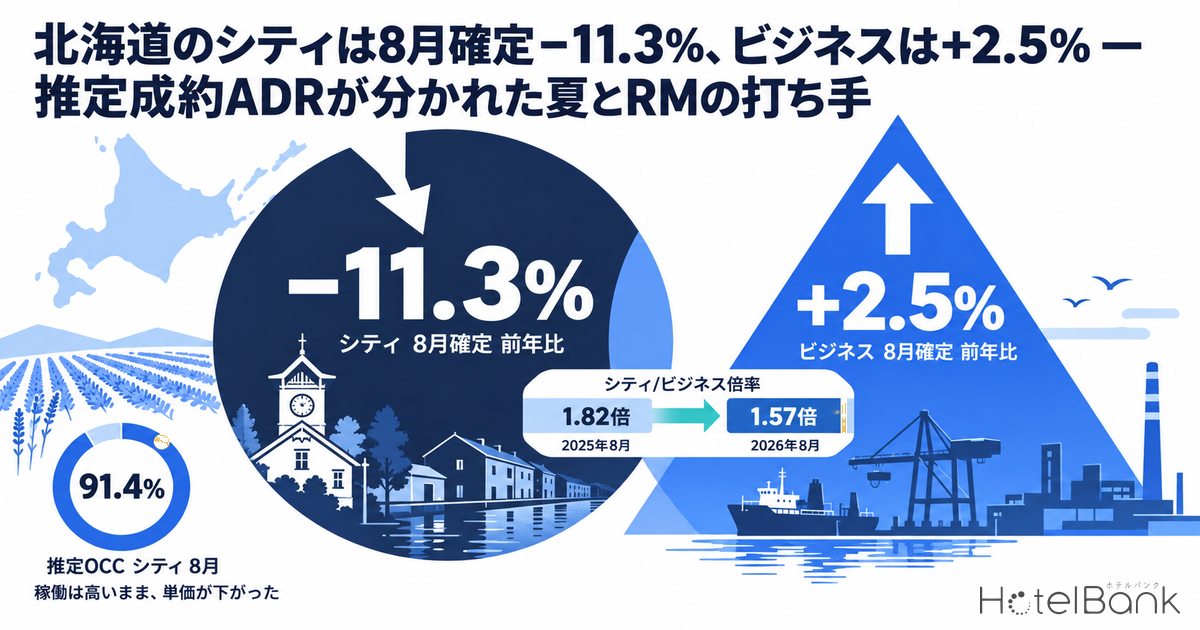
Hotel room rates in Hokkaido split sharply by hotel type this summer. On a settled basis, estimated settled ADR for city hotels across Hokkaido (N=75) was ¥17,800 in August 2026, down 11.3% year over year (YoY); July was ¥17,800 (−5.7%) and June ¥14,800 (−3.6%). Business hotels (N=438), by contrast, kept rising: ¥11,300 in August (+2.5%), ¥11,200 in July (+4.1%) and ¥9,500 in June (+2.7%). City hotels have now been below the prior year for five straight months since April, and the decline has widened each month. This article breaks down the divergence using only YoY comparisons between settled months. We set out, as a hypothesis, how two demand segments at different price points (leisure travelers from outside Hokkaido and overseas, versus corporate and construction-related demand) moved apart, and turn that into concrete moves a city-hotel revenue manager can make: mix design, length-of-stay controls and channel-level price floors.
Scope: city hotels (N=75 properties) and business hotels (N=438 properties) across all of Hokkaido, including the Sapporo area (both counts are the properties included in the August 2026 estimated settled ADR aggregate). The price metric in this article is estimated settled ADR (the settled price level estimated from OTA and other sales data, tax-exclusive equivalent); occupancy is an estimate based on OTA-listed inventory. Both are defined at the end of the article. Data as of September 28, 2026.
- — City −11.3% / Business +2.5%: YoY change in estimated settled ADR for settled August 2026 (N=75 / N=438). City hotels have been below the prior year for five consecutive months since April.
- — Part of the drop is payback: City hotels rose 16.8% YoY in August 2025. Against August 2024 (¥17,192), August 2026 is still 3.5% higher.
- — Occupancy stayed above 90%: Estimated OCC (OTA-listed inventory basis) for city hotels was 91.4% in August 2026. Rooms filled, but rates fell short of last year.
- — The widest split of the seven prefectures compared: The August gap between city and business YoY was −13.8pt in Hokkaido and −11.7pt in Tokyo. Kyoto and Osaka fell in both categories.
- — At last year’s rate, 81.0% estimated OCC would be enough: This is the arithmetic break-even that holds August city hotels’ estimated settled ADR × estimated OCC (¥16,270).
YoY by Settled Month — City Turned Down in April, Business Up Eight Months Running
Comparing estimated settled ADR (settled values) for January–August 2026 with the same months a year earlier, the two categories part ways in spring. From January to March both were above the prior year: city hotels were +29.4% in January, +4.4% in February and +8.4% in March; business hotels +14.4%, +8.1% and +8.2%. From April onward, however, city hotels slid further each month: −0.9% (April), −1.4% (May), −3.6% (June), −5.7% (July) and −11.3% (August). Business hotels were +0.3% in April, +4.9% in May, +2.7% in June, +4.1% in July and +2.5% in August — above the prior year for eight straight months since January.
Source: Compiled by HotelBank Editorial Team from MetroEngines Research (YoY change in estimated settled ADR, settled values; city N=75, business N=438, both as of August 2026)
Taking the simple average of the three peak summer months (June–August), city hotels fell 7.2% from ¥18,100 in 2025 to ¥16,800 in 2026, while business hotels rose 3.1% from ¥10,400 to ¥10,700. The city-to-business rate multiple also narrowed: in August from 1.82x (2025) to 1.57x (2026), and in July from 1.76x to 1.60x.
The prior year’s movement matters too. 2025 was a year of big gains for city hotels: +11.0% YoY in June, +10.2% in July and +16.8% in August. This summer’s decline likely includes payback from that surge. Compared with two years earlier, August 2026 (¥17,801) is 3.5% above August 2024 (¥17,192). In the year-over-year chart below, the 2026 city line (blue) runs below the 2025 line (gray) for June through August.
Source: Compiled by HotelBank Editorial Team from MetroEngines Research (estimated settled ADR, settled values; 2026 shows settled months through August only)
| Month (settled) | City 2025 | City 2026 | YoY | Business 2025 | Business 2026 | YoY | City/Business multiple 2026 |
|---|---|---|---|---|---|---|---|
| Jan | ¥11,324 | ¥14,658 | +29.4% | ¥7,057 | ¥8,074 | +14.4% | 1.82x |
| Feb | ¥17,410 | ¥18,171 | +4.4% | ¥8,112 | ¥8,769 | +8.1% | 2.07x |
| Mar | ¥10,939 | ¥11,858 | +8.4% | ¥7,018 | ¥7,593 | +8.2% | 1.56x |
| Apr | ¥9,820 | ¥9,728 | −0.9% | ¥7,120 | ¥7,142 | +0.3% | 1.36x |
| May | ¥13,738 | ¥13,551 | −1.4% | ¥8,440 | ¥8,857 | +4.9% | 1.53x |
| Jun | ¥15,356 | ¥14,796 | −3.6% | ¥9,298 | ¥9,545 | +2.7% | 1.55x |
| Jul | ¥18,891 | ¥17,819 | −5.7% | ¥10,712 | ¥11,154 | +4.1% | 1.60x |
| Aug | ¥20,078 | ¥17,801 | −11.3% | ¥11,048 | ¥11,328 | +2.5% | 1.57x |
Source: Compiled by HotelBank Editorial Team from MetroEngines Research (estimated settled ADR, settled values; city N=74–76, business N=417–441. Monthly property counts are listed in “About the Data in This Article” at the end)
By Area — Tourist Cities Fell in Both Categories; Business Hotels Rose in Parts of Central and Eastern Hokkaido
Breaking the Hokkaido-wide figures down by municipality shows what is behind the split. City hotels were below the prior year in June–August in all three areas with the most properties: Chuo Ward, Sapporo (N=26) fell 13.2% in August, Hakodate (N=5) 14.4% and Otaru (N=5) 25.1%. The more a city depends on leisure travelers from outside Hokkaido and overseas, the bigger its August drop.
Business hotels moved in opposite directions depending on the area. In tourist-heavy areas they fell like city hotels: Chuo Ward, Sapporo (N=105) −9.4% in August, Hakodate (N=47) −9.4% and Asahikawa (N=30) −15.5%. Meanwhile, Tomakomai (N=14) was +24.6% in June, +26.6% in July and +6.1% in August; Kushiro (N=18) was +10.7% in August; Kitami (N=20) and Wakkanai (N=11) were up in every month from June to August; and Chitose was +17.3% in July (N=15 properties that month). The resilience of these industrial cities and regional hubs in eastern Hokkaido likely explains why business hotels stayed positive across Hokkaido as a whole.
| Area | Category | Jun YoY | Jul YoY | Aug YoY | Aug 2026 estimated settled ADR | N (Aug 2025→2026) |
|---|---|---|---|---|---|---|
| Chuo Ward, Sapporo | City | −8.6% | −3.9% | −13.2% | ¥21,634 | 25→26 |
| Hakodate | City | −3.1% | −12.6% | −14.4% | ¥16,723 | 5→5 |
| Otaru | City | −2.5% | −9.9% | −25.1% | ¥20,975 | 5→5 |
| Chuo Ward, Sapporo | Business | −3.5% | +2.0% | −9.4% | ¥15,897 | 100→105 |
| Hakodate | Business | −0.8% | −6.3% | −9.4% | ¥9,710 | 48→47 |
| Asahikawa | Business | −25.5% | −8.7% | −15.5% | ¥10,079 | 27→30 |
| Chitose | Business | +4.7% | +17.3% | −6.0% | ¥14,002 | 14→17 |
| Tomakomai | Business | +24.6% | +26.6% | +6.1% | ¥11,250 | 14→14 |
| Kushiro | Business | +6.6% | +0.6% | +10.7% | ¥12,547 | 18→18 |
| Obihiro | Business | +17.2% | +0.3% | −4.3% | ¥9,538 | 27→30 |
| Kitami | Business | +1.6% | +4.7% | +5.3% | ¥7,444 | 21→20 |
| Kita Ward, Sapporo | Business | −5.7% | +1.6% | −8.4% | ¥15,552 | 16→18 |
| Muroran | Business | +9.3% | −1.8% | −0.3% | ¥7,485 | 11→12 |
| Wakkanai | Business | +16.5% | +22.6% | +12.0% | ¥14,039 | 12→11 |
Source: Compiled by HotelBank Editorial Team from MetroEngines Research (YoY between settled values of estimated settled ADR. All municipalities with 5+ city hotels or 10+ business hotels are listed. N is the number of properties in each year’s August aggregate)
Two hypotheses follow. The first is that in the high-rate tier, where leisure travelers from outside Hokkaido and overseas dominate, the price ceiling was pushed back after the surge in summer 2025. This fits the fact that city hotels and business hotels in tourist cities fell together. The second is that in the mid-price tier, centered on corporate travel and construction- or industry-related stays, demand is less sensitive to day of week and season, making rates easier to hold. This fits the rise in business-hotel rates in Tomakomai, Kushiro and Kitami. Note that both are inferred from ADR movements, not from direct measurement of guest-mix shares.
Compared With Other Regions — Hokkaido Stands Out for the Split, Not the Size of the Drop
To check whether the fall in Hokkaido city-hotel rates is specific to the region, we lined it up against city and business hotels in six other major prefectures, using the same estimated settled ADR (settled values). On a June–August average YoY basis, Hokkaido city hotels’ −7.2% is a smaller decline than Tokyo (−16.9%) or Kyoto (−13.8%). Judged by the size of the drop alone, Hokkaido is not a standout.
The difference shows up in how city and business hotels diverged. The August YoY gap (city minus business) was the largest in Hokkaido, at −13.8pt, among the seven prefectures compared, followed by Tokyo at −11.7pt. In Tokyo, however, the gap arose with both categories falling (city −20.6%, business −8.9%); only Hokkaido and Okinawa (city −0.2%, business +3.3%) saw city hotels fall while business hotels stayed above the prior year. Kyoto and Osaka posted double-digit declines in both categories. Note that Osaka hosted Expo 2025 Osaka, Kansai from April to October 2025, so its prior-year baseline was itself elevated.
| Prefecture | City Jun–Aug avg YoY | City Aug YoY | Business Jun–Aug avg YoY | Business Aug YoY | Aug gap (city − business) | N (Aug 2026 city / business) |
|---|---|---|---|---|---|---|
| Hokkaido | −7.2% | −11.3% | +3.1% | +2.5% | −13.8pt | 75 / 438 |
| Tokyo | −16.9% | −20.6% | −6.3% | −8.9% | −11.7pt | 109 / 915 |
| Okinawa | +6.4% | −0.2% | +7.8% | +3.3% | −3.5pt | 15 / 196 |
| Miyagi | −2.6% | +7.7% | +5.6% | +6.5% | +1.2pt | 21 / 142 |
| Fukuoka | +3.6% | +6.2% | +4.0% | +2.2% | +4.0pt | 41 / 341 |
| Kyoto | −13.8% | −10.2% | −12.9% | −15.6% | +5.4pt | 59 / 325 |
| Osaka | −25.2% | −24.4% | −32.8% | −33.6% | +9.2pt | 97 / 503 |
Source: Compiled by HotelBank Editorial Team from MetroEngines Research (YoY between settled values of estimated settled ADR. The June–August average is the YoY of the simple average of each month. Sorted by the August gap (city − business), ascending. Note the small samples for Okinawa city hotels (N=15) and Miyagi city hotels (N=21))
What this comparison shows is that the issue for Hokkaido city hotels is closer to “only the top price tier failed to reach last year’s ceiling” than to “the whole market cooled.” In a summer when Hokkaido business hotels were able to raise rates, city hotels could not hold their premium — and that is what appears as the YoY divergence.
Rates Fell While Occupancy Stayed High — Estimated OCC and Day-of-Week Patterns
The fall in city-hotel rates does not appear to stem from vanishing demand. Monthly average estimated OCC (OTA-listed inventory basis) in 2026 for city hotels (Hokkaido, 33–36 properties / 8,150–8,572 rooms, based on major booking-site listings) was 87.9% in June, 91.3% in July and 91.4% in August. For business hotels (204–222 properties / 24,244–25,989 rooms, same basis) it was 88.5% in June, 92.6% in July and 90.9% in August. In August, city hotels ran above 90% occupancy yet estimated settled ADR was 11.3% below the prior year. The rooms were filled, but not at last year’s rates.
Estimated OCC by day of week shows how the two categories’ demand patterns differ. Business hotels peaked on Thursday in August (95.3%), and in July Thursday (95.4%) was second only to Saturday (96.0%) — a corporate pattern in which midweek nights fill like weekends (we analyze the day-of-week pattern of Hokkaido business hotels in detail in Hokkaido Business Hotels Aren’t Weekend-Led). City hotels peaked on Saturday in July (95.6%) and Thursday in August (94.4%), with a smaller weekday-weekend gap than business hotels.
| Stay day | City Jul | City Aug | Business Jul | Business Aug |
|---|---|---|---|---|
| Mon | 88.3% | 88.9% | 89.0% | 88.9% |
| Tue | 89.2% | 92.1% | 93.0% | 93.1% |
| Wed | 90.5% | 92.2% | 94.2% | 94.0% |
| Thu | 92.2% | 94.4% | 95.4% | 95.3% |
| Fri | 92.9% | 92.7% | 91.8% | 91.0% |
| Sat | 95.6% | 93.2% | 96.0% | 91.8% |
| Sun | 90.0% | 87.5% | 88.2% | 84.4% |
Source: Compiled by HotelBank Editorial Team from MetroEngines Research (estimated OCC, OTA-listed inventory basis, observed the day before stay. July 2026: city 33–35 properties / 8,189–8,550 rooms, business 209–221 properties / 24,570–25,753 rooms; August 2026: city 33–35 properties / 8,150–8,550 rooms, business 215–222 properties / 25,477–25,989 rooms)
October Booking Curves — City Hotels Fill Early, Business Hotels Build Late
To see where there is room to adjust prices, we compared booking curves for two October stay dates: Saturday, October 10, the first day of a three-day weekend, and Wednesday, October 14, a weekday. City hotels (37 properties / 8,831 rooms, based on major booking-site listings) stood at 81.9% 45 days out, 87.5% 30 days out and 90.7% at the latest reading (13 days out) for October 10, a gain of +8.8pt from 45 days out. Business hotels (223 properties / 26,960 rooms, same basis) were at 74.1% 45 days out, 82.4% 30 days out and 89.5% at the latest reading (13 days out), a gain of +15.4pt.
The gap widens further for the weekday, October 14. City hotels were at 71.9% 45 days out, 75.5% 30 days out and 79.1% at the latest reading (17 days out), +7.2pt. Business hotels were at 59.0% 45 days out, 68.8% 30 days out and 76.7% at the latest reading (17 days out), +17.7pt. City hotels already have their occupancy base in place 45 days out and build gradually after that; business hotels gain much more once inside 30 days.
Source: Compiled by HotelBank Editorial Team from MetroEngines Research (estimated OCC, OTA-listed inventory basis; city 37 properties / 8,831 rooms, business 223 properties / 26,960 rooms; observed through September 27, 2026)
Building the occupancy base early means the rates at which that base was secured have an outsized effect on the month’s overall ADR. One possible reason summer city hotels ended up at “90%+ occupancy, below-prior-year rates” is the rate level of groups and packaged products secured in advance. This too is a hypothesis, but it is a checkpoint when revisiting pricing for autumn onward.
How Much Occupancy Can You Give Up if Rates Recover? — A Two-Axis Scenario for August City Hotels
We reframe August’s “90%+ occupancy, below-prior-year rates” as a combination of rate and occupancy. Multiplying August 2026 estimated settled ADR for Hokkaido city hotels (¥17,801) by estimated OCC (91.4%) gives a per-room revenue benchmark of ¥16,270. The table below computes the same benchmark while moving rate across five steps from −11.3% YoY to flat YoY, and estimated OCC across five steps from 85.0% to 95.0%. The rightmost column shows the estimated OCC needed to hold August’s actual ¥16,270.
| Estimated settled ADR \ Estimated OCC (assumed) | 85.0% | 88.0% | 91.4% (Aug actual) | 93.0% | 95.0% | Estimated OCC needed to hold ¥16,270 |
|---|---|---|---|---|---|---|
| ¥17,801 (Aug 2026 actual, −11.3% YoY) | ¥15,131 | ¥15,665 | ¥16,270 | ¥16,555 | ¥16,911 | 91.4% |
| ¥18,472 (−8.0% YoY) | ¥15,701 | ¥16,255 | ¥16,883 | ¥17,179 | ¥17,548 | 88.1% |
| ¥19,074 (−5.0% YoY) | ¥16,213 | ¥16,785 | ¥17,434 | ¥17,739 | ¥18,120 | 85.3% |
| ¥19,576 (−2.5% YoY) | ¥16,640 | ¥17,227 | ¥17,892 | ¥18,206 | ¥18,597 | 83.1% |
| ¥20,078 (flat YoY) | ¥17,066 | ¥17,669 | ¥18,351 | ¥18,673 | ¥19,074 | 81.0% |
Source: Compiled by HotelBank Editorial Team from MetroEngines Research (arithmetic scenario based on August 2026 estimated settled ADR, settled values, for Hokkaido city hotels N=75, and estimated OCC for the same month on an OTA-listed inventory basis; price elasticity of demand is not factored in)
Arithmetically, if rates can be brought back to last year’s ¥20,078, estimated OCC could fall to 81.0% and still match August’s actual level. Recovering only to −5.0% YoY (¥19,074) would require 85.3% estimated OCC. Conversely, pushing estimated OCC from 91.4% to 95.0% at August’s actual rate yields just ¥16,911 — nearly the same as achieving 91.4% at a rate 8.0% below the prior year (¥16,883). It reads as a period in which protecting the rates of early-secured bookings mattered more than chasing the last few points of occupancy.
That said, this table simply multiplies rate by occupancy. It does not include how much occupancy would fall in response to a rate increase (price elasticity). Because estimated OCC is based on OTA-listed inventory and runs higher than actual room occupancy, we recommend rebuilding the same table with your own property’s actual occupancy and settled rates.
For Revenue Managers of Hokkaido City Hotels — Implications and Action Plan
1. Read YoY across two years at once. Hokkaido city hotels were +16.8% YoY in August 2025 and −11.3% in August 2026. When assessing your own property’s shortfall this summer, looking at it alongside last year’s gain makes it easier to tell payback apart from a decline in your relative position.
2. Treat months above 90% occupancy as months to compete on rate. August estimated OCC for city hotels was a high 91.4%. If your property was similarly full yet fell short of last year’s rates, the question to revisit is not “how full did we get” but “at what prices did we fill.” There is room to review the booking mix by price tier.
3. Use the city/business multiple as a guide to your price ceiling. In Hokkaido the multiple narrowed from 1.82x to 1.57x in August. Checking how much of a premium your property holds over business hotels in the same area makes it easier to test whether your pricing matches your room grade and added value.
4. Set different assumptions for tourist cities and industrial cities. In Chuo Ward (Sapporo), Hakodate and Otaru, both categories fell in August, while business hotels rose in places such as Tomakomai and Kushiro. Location changes the call on whether to lead with leisure guests or to build a thicker base of corporate and long-stay business.
| Timing | Action | Trigger (figures from this article) | Goal |
|---|---|---|---|
| This week | Re-aggregate June–August bookings by price tier across three segments: groups, packaged products and last-minute individual bookings | Your property’s August YoY was well below the Hokkaido city-hotel figure of −11.3% | Quantify how much low-priced bookings secured early pulled down ADR |
| This week | Review channel-level price floors for the October holiday dates | City-hotel estimated OCC for October 10 has already reached 90.7% at the latest reading, yet much of your remaining inventory is allocated to discount channels | Shift remaining inventory on high-demand dates toward channels closer to rack rate |
| Within 2 weeks | Set up multi-night and long-stay weekday plans to capture corporate and construction-related demand | As on the weekday of October 14, your weekday occupancy is below the market for city hotels (79.1% at the latest reading) | Build a thicker weekday occupancy base without eroding rates |
| Within 2 weeks | Pre-define rate-increase conditions for strong-demand dates inside 30 days | Dates where market business-hotel estimated OCC keeps rising after 30 days out, such as October 10 (82.4% at 30 days out → 89.5% latest) and October 14 (68.8% → 76.7%) | Capture late-building demand at prior-year rate levels |
| Toward next summer | Rebuild allocations and pricing for groups and packaged products for June–August 2027 based on 2026 results | The narrowing of the city/business multiple to 1.57x (August) is also visible in your area | Protect the rates of early-secured bookings and recover the peak-month ceiling |
| Toward next summer | Consider dates in peak season on which to set minimum-length-of-stay conditions (e.g., 2+ nights) | Your property also tends to fill up first with single-night weekend bookings, as when July Saturday estimated OCC reached 95.6% | Reduce vacancies on the shoulder nights and raise revenue per room |
For every action, check the market-wide figures against your own property’s booking data before deciding. The size of the effect varies with location and room mix.
Summary — Three Yardsticks for Reading the Split
The first is to overlay two years of YoY for settled months. Hokkaido city hotels went +16.8% then −11.3% in August. A single year’s YoY cannot tell payback apart from genuine weakness. The second is the city/business multiple. It narrowed from 1.82x to 1.57x in August, showing that the top price tier moved closer to business hotels below it. The third is the booking-curve level at 45 days out, and the build from 30 days out to the latest reading. The difference in pattern — city hotels fill early, business hotels build late — determines when to revisit prices. For city hotels, the issue was rate, not occupancy. For autumn and winter 2026, it is worth checking your property’s position against these three yardsticks every month.
Frequently Asked Questions
Q. How much did estimated settled ADR for Hokkaido city hotels fall in summer 2026?
A. On a settled basis, August 2026 was ¥17,801 (−11.3% YoY), July ¥17,819 (−5.7%) and June ¥14,796 (−3.6%) (N=75). Rates have been below the prior year for five straight months since April, with the decline widening each month.
Q. Why did Hokkaido business hotels beat the prior year?
A. Business hotels (N=438) were above the prior year in every month from January to August 2026, at +2.5% in August. Rates rose in industrial cities and regional hubs in eastern Hokkaido such as Tomakomai, Kushiro, Kitami and Wakkanai, while Chuo Ward (Sapporo), Hakodate and Asahikawa fell. The view that corporate travel and construction-related demand supported rates is a hypothesis drawn from ADR movements, not a direct measurement of guest-mix shares.
Q. Was the fall in city-hotel rates caused by weaker demand?
A. Not necessarily. Estimated OCC (OTA-listed inventory basis) for Hokkaido city hotels was a high 91.4% in August 2026 — the rooms were full. City hotels had also risen 16.8% YoY in August 2025, so this summer’s decline includes payback from that. Compared with August 2024, August 2026 is 3.5% higher.
Q. Is Hokkaido’s decline large compared with other regions?
A. Hokkaido city hotels’ June–August average YoY was −7.2%, a smaller drop than Tokyo (−16.9%) or Kyoto (−13.8%). On the other hand, the August gap between city and business YoY was −13.8pt in Hokkaido, the largest of the seven prefectures compared.
Q. If rates return to last year’s level, how far can occupancy fall?
A. Using August’s estimated settled ADR × estimated OCC for Hokkaido city hotels (¥16,270) as the benchmark, bringing rates back to last year’s ¥20,078 would reach the same level even at 81.0% estimated OCC. This is an arithmetic guide that excludes the occupancy loss from raising prices (price elasticity), so check it against your own property’s actuals.
About the Data in This Article
| Definition of estimated OCC | Occupancy on an OTA-listed inventory basis = 100 − 100 × OTA-listed remaining rooms ÷ total rooms. Covers a fixed cohort of properties that list at least 30% of their total rooms on OTAs (the same set of properties for every stay date). It is an estimate based on how inventory sold on OTAs is absorbed, and differs in definition from actual room occupancy (it runs higher because rooms not listed are counted as sold). |
| Booking curves | Based on observations from 45 days before the stay date to the latest reading. |
| Definition of estimated settled ADR | The settled price level (tax-exclusive equivalent) estimated from OTA and other sales data (lowest-plan level × hotel-type coefficient, ensembled across multiple channels). Past months are settled values; current and future months are estimates based on current sales. Median error of 6.6% against published operating results. All YoY figures in this article compare settled months with settled months. |
| Breakdown of N | Estimated settled ADR (all of Hokkaido): city hotels N=75, 74, 74 for June–August 2025 and N=75, 75, 75 for June–August 2026; business hotels N=422, 421, 417 for June–August 2025 and N=429, 432, 438 for June–August 2026. For January–May 2026, city N=75 and business N=430–441. Municipality-level N is shown in the relevant table. Estimated OCC (monthly and by day of week): June 2026 city 34–36 properties / 8,454–8,572 rooms, business 204–220 properties / 24,244–25,701 rooms; July and August are listed in the source line of the day-of-week table. Booking curves: city 37 properties / 8,831 rooms, business 223 properties / 26,960 rooms (based on major booking-site listings). |
| Data as of | Data as of September 28, 2026. Sales and inventory change daily, so figures in this article are a snapshot at the time of retrieval. |
Source: Compiled by HotelBank Editorial Team from MetroEngines Research
■ Data sources
Estimated settled ADR is the monthly settled value of the settled price level (tax-exclusive equivalent) estimated from OTA and other sales data we collect (for Hokkaido city and business hotels, and for Tokyo, Osaka, Kyoto, Fukuoka, Okinawa and Miyagi used for comparison). Estimated OCC and booking curves are fixed-cohort estimates based on daily observation of OTA-listed inventory. All figures are compiled by MetroEngines Research, with data as of September 28, 2026.
■ Scenario assumptions
The two-axis scenario is an arithmetic calculation based on the product (¥16,270) of August 2026 estimated settled ADR (¥17,801) and estimated OCC (91.4%) for Hokkaido city hotels, moving rate across five steps from −11.3% YoY to flat YoY and estimated OCC across five steps from 85.0% to 95.0%. The June–August average YoY compares simple averages of each month’s estimated settled ADR.
■ Limitations
Estimated OCC counts unlisted rooms as sold, so it runs higher than actual room occupancy. Estimated settled ADR × estimated OCC is the product of a tax-exclusive-equivalent rate and inventory-based occupancy, and differs in definition from published RevPAR. Statements about demand mix (leisure guests vs. corporate and construction-related demand) are hypotheses drawn from ADR movements. Note that Osaka’s YoY baseline includes the Expo 2025 Osaka, Kansai period, and that the samples for Okinawa city hotels (N=15) and Miyagi city hotels (N=21) are small.