

Elevators, water-heating boilers, the heat-source plant for air conditioning. Each piece of hotel equipment runs on its own replacement cycle, but somewhere between the 25th and 35th year after opening, those cycles all converge. Properties that opened between 1991 and 2001 are sitting in exactly that band right now. This article checks the replacement cycle of each equipment type against published material from industry bodies, manufacturers and the national government, then uses the MetroEngines Research & Consulting property master to count the room stock aged 25–35 years by prefecture and by hotel type. Finally, it divides the per-unit construction cost ranges by room count and turns the burden “per room” and “per room-night” into sensitivity tables.
How This Article Differs from Our Earlier Coverage
An earlier HotelBank analysis put hotel capital expenditure at ¥130k–¥620k per room a year by converting the actual capex totals disclosed by listed REITs into a per-room figure. This article does not work from actual totals. Instead it takes a time axis — the replacement cycle of each equipment type and the room stock by building age — and asks which equipment replacements overlap in which age band, and across how many rooms. Statutory inspection costs and the renewal of large public-bath facilities are covered in separate HotelBank analyses.
Metric Definitions Used in This Article
- Room stock: Of the domestic properties tracked by MetroEngines Research & Consulting, the 40,011 properties and 1,625,492 rooms that had inventory and price observations on major booking sites over the last three months (8 stay dates sampled weekly between June 25 and September 17, 2026) and have a registered room count. Properties with a registered closing date are excluded. Because the count is limited to properties confirmed to be operating, it runs slightly below actual supply; please read it as a “lower-bound guide”.
- Building age: 2026 minus the opening year recorded in the property master. Aged 25–35 years = opened 1991–2001. This is not the installation year of the equipment itself; it is used as a proxy for the likelihood that the original equipment has entered its replacement period. For ryokan, the year the business was founded is sometimes recorded instead of the building completion year. Opening year is known for 30,451 properties and 1,487,004 rooms; 4,561 properties and 81,084 rooms uniformly recorded with an opening date of January 1, 1990 are excluded from the opening-year tallies.
- Burden per room-night: The cost of one replacement round divided by room count and by the replacement cycle (years), then by 365 days (available room-night basis). The sold room-night basis divides this further by the occupancy rate for each property type in the Japan Tourism Agency’s Overnight Travel Statistics Survey, 2025 annual figures (final).
- OCC (occupancy rate): This article uses the published figures from the Japan Tourism Agency’s Overnight Travel Statistics Survey (ryokan 38.2%, resort hotels 56.9%, business hotels 75.3%, city hotels 74.1%). These are not our own estimates.
- Data sources: MetroEngines Research & Consulting (property master), Ministry of Land, Infrastructure, Transport and Tourism (MLIT), National Institute for Land and Infrastructure Management (NILIM), Ministry of the Environment, Japan Tourism Agency, and manufacturers’ published materials
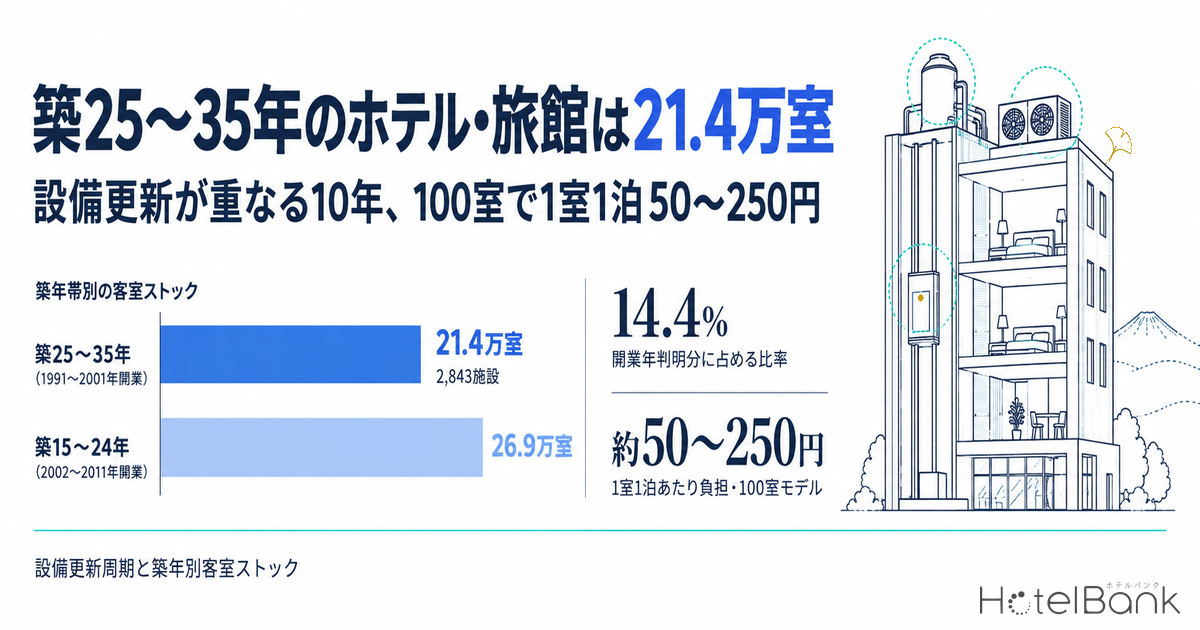
- — 214k rooms: Hotels and ryokan aged 25–35 years (opened 1991–2001) total 2,843 properties and 214,252 rooms — 14.4% of all rooms with a known opening year.
- — A decade where cycles overlap: The first elevator renewal (20–30 years), the first power-receiving/transformer renewal (25–30 years), and the second round of water-heating and HVAC heat-source replacement all cluster in years 25–35 after opening.
- — 25.0% of city hotels: The within-type share is highest for city hotels, followed by resort hotels at 19.8%. In absolute terms, business hotels account for the most rooms, at 98,957.
- — About ¥50–250 per room-night: The ¥36m–¥123m cost of one full renewal round of 3 elevators and 3 heat-source units in a 100-room model, spread over the replacement cycle and sold room-nights.
- — The heat-source choice sets the range: Whether a hotel replaces like-for-like or converts to heat pumps moves the burden substantially. A one-third subsidy on the heat-source portion brings the upper end down to about ¥190.
The Bottom Line — The Renewal Period Is a Chance to Bundle and Rebuild
Cycles overlap at 25–35 years
Lining up the cycles in published sources, the first elevator renewal (20–30 years), the second water-heating heat-source replacement (30–40 years), the second HVAC heat-source replacement (30 years and up) and the first power-receiving equipment renewal (25–30 years) all fall within this ten-year window.
2,843 properties, 214k rooms
That is 14.4% of rooms with a known opening year. Properties with 100+ rooms account for 69.8% of the rooms in this band, so the core is properties large enough to have elevators and central heat-source plant.
About ¥50–250 per room-night
The cost of one full renewal round of 3 elevators and 3 heat-source units in a 100-room model, spread over the replacement cycle. The construction method and heat-source choice create a fivefold range. Using subsidies brings the upper end down to about ¥190.
Replacement Cycles by Equipment Type — Checked Against Published Sources
Replacement cycles vary depending on who published the figure and for what purpose. The statutory useful life under tax law is a period for depreciation and is separate from actual service life. As practical guides there are the renewal timings recommended by manufacturers, the example repair cycles in MLIT’s Guidelines for Preparing Long-Term Repair Plans, and the service lives from the Building and Equipment Long-life Cycle Association (BELCA), the government building-maintenance standards and the Architectural Institute of Japan (AIJ), as compiled in a NILIM report. Below, these multiple sources are set side by side and read as a range.
| Equipment | Practical replacement guide | Years by source | Statutory useful life |
|---|---|---|---|
| Elevators (control renewal) | 20–30 years | Hitachi Building Systems: renewal guideline 20–25 years / Toshiba Elevator and Building Systems: many owners renew at 17–25 years / MLIT Guidelines for Preparing Long-Term Repair Plans (condominium common-area example): elevator replacement 26–30 years (repair 12–15 years) / BELCA: passenger elevators 25 years | 17 years |
| Water-heating heat source (steel-plate hot-water boilers, storage tanks) | 15–20 years | Steel-plate hot-water boilers: BELCA 15 years, government building standards 15 years, AIJ 25 years / Storage tanks (steel plate): BELCA 15 years, government building standards 20 years / Cast-iron boilers: BELCA 25 years, AIJ 30 years | 15 years |
| HVAC heat source | 15–25 years | Air-source heat-pump packages: BELCA 15 years, government building standards 15 years / Building multi-split systems: BELCA 15 years / Absorption and turbo chillers: BELCA 20 years, government building standards 20 years | 13–15 years |
| Power receiving (transformers) | 25–30 years | Transformers: BELCA 30 years, government building standards 30 years, AIJ 25 years | 15 years |
Elevator renewal comes in stages. A “control renewal” replaces the main equipment such as the control panel and traction machine; a “partial-removal renewal” also replaces the car and landing finishes; and a “full-removal renewal” replaces everything down to the rails and hoistway equipment. Toshiba Elevator and Building Systems gives approximate work periods of about 7 days for a control renewal (about 5 days of complete shutdown), about 20 days for partial removal and about 30 days for full removal. A practical approach is to handle the first renewal as a control renewal and time a full removal to coincide with a building-wide major renovation. In this article’s estimates, full removal is treated as “an option synchronized with the next major renovation”.
Heat-source equipment runs on shorter cycles. Water-heating boilers and HVAC heat sources complete a cycle in roughly 15–25 years, so for a property 25–35 years after opening this is the second round of replacement. Unlike elevators, here the owner can choose between replacing with equipment of the same type or converting to another system such as heat pumps. The chart below lays the replacement window for each piece of equipment over building age.
The shaded area is the 25–35-year band. The first elevator renewal, the first power-receiving renewal, and the second round of water-heating and HVAC heat-source replacement all gather within these ten years. Taken individually they are long-cycle and short-cycle items, but on a building-age axis the replacement peaks converge on a single period. From a funding perspective, whether an owner can decide as a package “which equipment to replace, when, and with what system” before entering this band affects both the number of closure days during construction and the total cost.
214k Rooms Aged 25–35 Years — Stock by Opening Year
Arranging room stock by the opening year in the property master, rooms opened in 1991–2001 total 2,843 properties and 214,252 rooms — 14.4% of the 1,487,004 rooms with a known opening year. Year by year, roughly 17,000–23,000 rooms opened annually over these eleven years, with no standout year. It was a period in which supply continued at a steady pace even after the so-called bubble era.
| Building age (opening year) | Properties | Rooms | Share of rooms |
|---|---|---|---|
| 0–4 years (opened 2022–2026) | 6,236 | 195,445 | 13.1% |
| 5–9 years (2017–2021) | 7,637 | 323,841 | 21.8% |
| 10–14 years (2012–2016) | 3,276 | 118,908 | 8.0% |
| 15–19 years (2007–2011) | 2,323 | 155,006 | 10.4% |
| 20–24 years (2002–2006) | 1,622 | 113,914 | 7.7% |
| 25–29 years (1997–2001) | 1,187 | 93,874 | 6.3% |
| 30–35 years (1991–1996) | 1,656 | 120,378 | 8.1% |
| 36–45 years (1981–1990) | 2,331 | 159,023 | 10.7% |
| 46 years or older (1980 or earlier) | 4,178 | 206,301 | 13.9% |
| Of which aged 25–35 years (opened 1991–2001) | 2,843 | 214,252 | 14.4% |
It is worth looking at either side of the band too. Rooms aged 36 years or older (opened in 1990 or earlier) total 365,324, and most have likely already been through a second or third round of equipment replacement. On the other side, the 268,920 rooms aged 15–24 years (opened 2002–2011) will enter the same band within the next ten years. The renewal period is not a one-off wave; it comes around in turn, following the peaks in opening years.
Note that among properties aged 25–35 years, 467 properties and 68,403 rooms (31.9% of rooms in the band) have a renovation date of 2015 or later recorded in the property master. The scope of those renovations is unknown, but some have likely replaced part of their equipment along with the interiors. The estimates that follow assume “the original equipment is still in place” and lean toward the upper end; for renovated properties the burden will be smaller.
By Hotel Type — A Quarter of City Hotel Rooms Fall in the Band
By hotel type, business hotels account for the largest absolute number of rooms in the band, at 98,957. Measured as a share of each type’s stock, however, city hotels are highest at 25.0%, followed by resort hotels at 19.8%. City hotels in the band have a large median of about 150 rooms, and central heat-source systems and multi-car elevator operation are common, so the renewal work tends to be large-scale. Put the other way, the benefit of raising the equipment specification by a notch in one renewal round is also magnified by the room count.
| Hotel type | Properties aged 25–35 yrs | Rooms aged 25–35 yrs | Share within type | Rooms per property (median) | Occupancy (2025) |
|---|---|---|---|---|---|
| Business | 937 | 98,957 | 12.3% | 91 rooms | 75.3% |
| City | 290 | 59,253 | 25.0% | 151.5 rooms | 74.1% |
| Resort | 257 | 26,361 | 19.8% | 61 rooms | 56.9% |
| Ryokan | 655 | 16,107 | 10.6% | 17 rooms | 38.2% |
| Other | 704 | 13,574 | 8.5% | 8 rooms | — |
| Total | 2,843 | 214,252 | 14.4% | — | 61.6% |
By size, properties with 100–199 rooms hold 67,541 of the rooms in the band and those with 200+ rooms hold 82,004 — together 69.8%. Properties with fewer than 30 rooms are numerous at 1,278, but account for only 15,970 rooms. At small low-rise properties without elevators, renewal centers on heat sources and air conditioning, and in the sensitivity tables below the burden also varies sharply with size.
By Prefecture — Tokyo Leads on Rooms; Mie, Chiba and Nagasaki on Share
By room count, Tokyo (20,630 rooms), Hokkaido (17,214) and Osaka (13,257) top the prefectural ranking. Measured as a share of each prefecture’s room stock the order changes: among prefectures with 15,000+ rooms, Mie (23.5%), Chiba (23.2%) and Nagasaki (22.8%) are highest. In Tokyo (9.9%), Osaka (10.4%) and Kyoto (8.9%), rooms opened in 2010 or later make up 55.0%, 65.2% and 72.7% respectively (45.9% nationally), so their share comes out lower because of the thick layer of new supply. In regions where rooms in the renewal period are concentrated, design, construction and equipment contractors tend to be booked at the same time, so securing order slots early makes construction schedules more predictable.
| Prefecture | Properties aged 25–35 yrs | Rooms aged 25–35 yrs | Share of prefecture’s rooms | Main hotel types in the band |
|---|---|---|---|---|
| Tokyo | 154 | 20,630 | 9.9% | Business, City |
| Hokkaido | 232 | 17,214 | 17.2% | Business, City |
| Osaka | 90 | 13,257 | 10.4% | Business, City |
| Chiba | 94 | 12,041 | 23.2% | City, Business |
| Fukuoka | 72 | 11,207 | 18.5% | Business, City |
| Kanagawa | 91 | 9,197 | 17.5% | City, Business |
| Nagano | 227 | 9,076 | 19.9% | Business, Resort |
| Aichi | 77 | 7,820 | 13.1% | Business, City |
| Okinawa | 71 | 6,374 | 11.0% | Resort, Business |
| Shizuoka | 147 | 6,131 | 12.6% | Business, Resort |
| Hyogo | 96 | 5,969 | 16.1% | City, Business |
| Kyoto | 53 | 5,782 | 8.9% | Business, City |
| Mie | 56 | 4,668 | 23.5% | Business, Resort |
| Miyagi | 52 | 4,439 | 15.6% | Business, City |
| Niigata | 67 | 4,300 | 16.0% | Business, Resort |
Converting Per-Unit Construction Costs into Per-Room Figures
Now to the money. Construction costs vary widely with building conditions and the configuration of existing equipment, so this article sets published guideline figures as a “range” and looks at the sensitivity when they are divided by room count. The guideline figures used are as follows.
| Equipment / work | Guide cost per unit | Cycle assumed here | Source |
|---|---|---|---|
| Elevator control renewal | From about ¥5m | 25–30 years | Comparison table published by Ainichi (elevator maintenance company) |
| Elevator partial-removal renewal | From about ¥10m | 25–30 years | Same as above |
| Elevator full-removal renewal | From about ¥15m | 25–30 years | Same as above |
| Heat-source unit, like-for-like (high-efficiency hot-water heater) | About ¥7m | 15–25 years | Ministry of the Environment, GHG Emission Reduction Guidelines measures catalogue (hot-water heaters under 1,000 kW output, average installation cost level) |
| Heat-source unit, conversion to heat pump | About ¥26m | 15–25 years | Same (high-temperature hot-water heat pumps, heating capacity 270 kW or less, average installation cost level) |
| (Reference) Individual air-conditioning, per system | ¥1m–¥1.5m | — | Daikin Industries (6 hp and above, guide including installation) |
First, the “one-off burden per room”: the cost per unit divided by the room count. A ¥5m control renewal comes to ¥50k per room at 100 rooms and ¥167k at 30 rooms. Converting the heat source to a heat pump at about ¥26m is ¥260k per room at 100 rooms and ¥867k at 30 rooms. For the same work, the fewer the rooms, the heavier the per-room load.
| Construction cost per unit | 30 rooms | 60 rooms | 100 rooms | 150 rooms | 200 rooms | 300 rooms |
|---|---|---|---|---|---|---|
| Elevator control renewal ¥5m | 167 | 83 | 50 | 33 | 25 | 17 |
| Heat-source unit, like-for-like (high-efficiency hot-water heater) ¥7m | 233 | 117 | 70 | 47 | 35 | 23 |
| Elevator partial removal ¥10m | 333 | 167 | 100 | 67 | 50 | 33 |
| Elevator full removal ¥15m | 500 | 250 | 150 | 100 | 75 | 50 |
| Heat-source unit, heat-pump conversion ¥26m | 867 | 433 | 260 | 173 | 130 | 87 |
Next, spread this over the replacement cycle and convert it to a per-night figure. Divided by available room-nights (rooms x 365 days), a single control renewal comes to around ¥5 per room-night at 100 rooms, and even a single heat-pump conversion stays at ¥28–47.
| Equipment / work (cycle) | 30 rooms | 60 rooms | 100 rooms | 150 rooms | 200 rooms | 300 rooms |
|---|---|---|---|---|---|---|
| Elevator control renewal (25–30 years) | 15–18 | 8–9 | 5 | 3–4 | 2–3 | 2 |
| Heat-source unit, like-for-like (high-efficiency hot-water heater) ¥7m (15–25 years) | 26–43 | 13–21 | 8–13 | 5–9 | 4–6 | 3–4 |
| Elevator partial removal (25–30 years) | 30–37 | 15–18 | 9–11 | 6–7 | 5 | 3–4 |
| Elevator full removal (25–30 years) | 46–55 | 23–27 | 14–16 | 9–11 | 7–8 | 5 |
| Heat-source unit, heat-pump conversion (15–25 years) | 95–158 | 47–79 | 28–47 | 19–32 | 14–24 | 9–16 |
Real properties renew several units at once. We therefore set three models, fixed the number of elevators and heat-source units, and built up the cost of one full round. The lower bound is “control renewal + like-for-like heat-source replacement on long cycles”; the upper bound is “full removal + heat-pump conversion on short cycles”.
| Model | Assumption (EV / heat-source units) | Cost of one round | Per room | Per room per year | Per room-night (available) | Occupancy | Per room-night (sold) |
|---|---|---|---|---|---|---|---|
| Ryokan, 30 rooms | 1 / 2 | ¥19m–¥67m | ¥633k–¥2.23m | ¥24,200–135,600 | ¥66–371 | 38.2% | ¥174–972 |
| Business hotel, 100 rooms | 3 / 3 | ¥36m–¥123m | ¥360k–¥1.23m | ¥13,400–70,000 | ¥37–192 | 75.3% | ¥49–255 |
| City hotel, 200 rooms | 3 / 4 | ¥43m–¥149m | ¥215k–¥745k | ¥8,100–43,700 | ¥22–120 | 74.1% | ¥30–161 |
For a 100-room business hotel, one renewal round costs ¥36m–¥123m, or about ¥50–250 per sold room-night. A 200-room city hotel is lighter because the cost is divided across more rooms, at about ¥30–160. A 30-room ryokan, with occupancy as low as 38.2%, has a wide range of about ¥170–970 per room-night. In every model it is the heat-source side rather than the elevators that sets the range: the choice between like-for-like replacement and heat-pump conversion moves the per-room-night burden substantially. For the effective burden including closure and lost revenue during construction, an earlier HotelBank analysis that adds renovation-period lost revenue to construction cost found it equal to 32.6% of capex, raising the effective cost from ¥3m to ¥3.98m per room.
Four Options for Turning the Renewal Period into a Reinvestment Opportunity
The fact that renewals arrive together is, seen another way, an opportunity to reconfigure the building’s specification all at once. Here are four upside options available to properties aged 25–35 years.
1. Bundle renewals into a single renovation
Concentrating work in the period when elevator, heat-source and power-receiving cycles overlap lets temporary works, scaffolding, hoisting and closure be combined. Elevator work periods are about 7 days for a control renewal and about 30 days for full removal (Toshiba Elevator and Building Systems); aligning them with the closure for a guestroom refurbishment limits the operational impact to a single event.
2. Convert the heat source to heat pumps
The Ministry of the Environment’s measures catalogue gives thermal efficiencies of 0.92–0.96 for steam boilers and 0.95 for water heaters, against a coefficient of performance of 3.4 as the efficiency level for high-temperature hot-water heat pumps (a simple comparison is not possible because the input energy types differ). Installation costs are high, but the second-round replacement is one of the few moments when the heat-source system can be re-selected, allowing the very structure of fuel costs to be changed.
3. Rebrand with fewer rooms to raise room rates
Cutting rooms by 10% to upgrade each room’s size and equipment raises the per-room burden of the same construction cost by about 1.11x. Meanwhile, the rate uplift needed to maintain room revenue at the same occupancy is about 11%. An earlier HotelBank analysis of 4,515 limited-service hotels found that separating bath and toilet carries a premium of +¥1,049 per square meter of room area, with a payback of 6.1 years.
4. Build in energy-efficiency subsidies
For lodging facilities there is the Japan Tourism Agency’s support for installing energy-saving equipment, and across industries there are energy-saving equipment subsidies under the Ministry of Economy, Trade and Industry (METI). In the upper-bound case of the 100-room model, a one-third subsidy on the heat-source portion lowers the burden from about ¥250 to about ¥190 per sold room-night.
| Program | Example eligible items | Subsidy rate / cap | Timing |
|---|---|---|---|
| Japan Tourism Agency, Lodging Facility Sustainability Enhancement Support Program (FY2025) | Energy-saving boilers and piping, energy-saving air conditioning, lighting, double-glazed sashes, etc. | 1/2, cap ¥10m | FY2025 applications accepted March 24 to May 30, 2025. Check Japan Tourism Agency announcements for future calls |
| FY2025 supplementary budget, Energy Efficiency and Non-Fossil Conversion Subsidy (equipment-unit type) | High-efficiency air conditioning, commercial water heaters, high-performance boilers, industrial heat pumps, transformers, etc. | Up to 1/3, cap ¥100m | As of September 15, 2026, the Sustainable open Innovation Initiative (SII) announced a 4th call scheduled from early October |
| Same (GX equipment-unit type, top-performance renewal projects) | Designated equipment meeting top-performance standards | Up to 1/2, cap ¥300m | Same as above |
The four options can be combined. For example, a hotel could overlap an elevator control renewal and a heat-source conversion with the closure for a guestroom refurbishment, and apply a subsidy to the heat-source portion. An earlier HotelBank analysis put hotel electricity costs at about ¥96,000 per room a year and modeled the payback of energy-saving investment; on sites without a city-gas connection, the heat-source options change, which another HotelBank analysis estimated adds about ¥68,000 per room a year in heat costs.
How to Read This as an Acquirer, Owner or Lender
For investors considering an acquisition, how far the equipment renewal period is priced in is the dividing line in valuing a property aged 25–35 years. Reading where the property sits in the renewal cycle from its opening year, then checking actual installation years and systems in the equipment register, lets the buyer set in advance the range of funds needed right after acquisition. A property approaching its renewal period can also be seen as one with room to upgrade its specification through post-acquisition capex.
For owners, the renewal period is an opportunity to rethink how the building is run. If equipment cycles are laid out within the long-term repair plan and the overlapping period is combined with guestroom refurbishment into a single project, both the number of closures and the work scheduling can be reduced. For lenders reviewing financing, where the per-room-night burden lands — between a few tens and a few hundred yen — is a yardstick for how credible the post-renovation business plan is. For the level of capital investment across the lodging industry, an earlier HotelBank analysis of the Financial Statements Statistics of Corporations found lodging capex running at 1.51x depreciation; for the seismic issues facing the oldest layers of stock, see our analysis of Japan’s pre-1981 hotel stock of 236k rooms.
Summary
Lining up equipment replacement cycles from published sources, the first elevator renewal (20–30 years), the first power-receiving renewal (25–30 years) and the second round of water-heating and HVAC heat-source replacement (30 years and up) overlap in years 25–35 after opening. Properties in this band — those opened in 1991–2001 — number 2,843 with 214,252 rooms, equal to 14.4% of rooms with a known opening year and 25.0% for city hotels. Dividing per-unit construction costs by room count, one renewal round for a 100-room model costs ¥36m–¥123m, or about ¥50–250 per sold room-night, and most of the range is determined by how the heat source is replaced.
The renewal period is not simply a time to put equipment back as it was. Bundling works to limit closure to one event, converting the heat source to heat pumps, reducing room count to lift the product, building in subsidies — all of these options are easier to take precisely at this point. The 269k rooms aged 15–24 years will also enter the same band within ten years. Because the timing of the renewal peak can be read approximately from the opening year, the properties that put a plan in place first are best positioned to use this period as a reinvestment opportunity.
Note on the estimates: Construction costs in this article are ranges set from guideline figures in published materials of companies and the Ministry of the Environment, not estimates for individual properties. Replacement cycles vary with usage, maintenance and installation environment. Building age is a proxy based on opening year and may not match the equipment installation year. The per-room-night burden excludes temporary works, lost revenue during closure, ancillary works, interest and tax effects.
Related Articles
- Hotels at Year 10: The Renovation Gap Is +13.6% Below 100 Rooms
- Japan’s Pre-1981 Hotel Stock: 236k Rooms, 19.1% — Retrofit or Rebuild
References and Sources
■ Data Sources
MetroEngines Research & Consulting property master (opening year, room count, hotel type, location). The population is the 40,011 properties and 1,625,492 rooms with inventory and price observations over the last three months (8 stay dates sampled weekly between June 25 and September 17, 2026); the 30,451 properties and 1,487,004 rooms with a known opening year were used for the building-age tallies. Replacement cycles are from NILIM, MLIT and manufacturers’ published materials; construction costs from the Ministry of the Environment’s measures catalogue and manufacturers’ published materials; occupancy by hotel type from the Japan Tourism Agency, Overnight Travel Statistics Survey, 2025 annual figures (final).
■ Estimation Assumptions
Building age = 2026 minus opening year (a proxy for equipment installation year). Burden per room-night = cost of one round ÷ rooms ÷ replacement cycle (years) ÷ 365 days (available room-night basis); the sold room-night basis divides this by occupancy for each hotel type. Models: ryokan 30 rooms (1 elevator, 2 heat-source units), business hotel 100 rooms (3 and 3), city hotel 200 rooms (3 and 4). Lower bound: elevator control renewal ¥5m per unit on a 30-year cycle and like-for-like heat-source unit ¥7m per unit on a 25-year cycle. Upper bound: elevator full removal ¥15m per unit on a 25-year cycle and heat-pump conversion ¥26m per unit on a 15-year cycle.
■ Limitations
Construction costs are ranges of published guideline figures, not estimates for individual properties. Temporary works, lost revenue during closure, ancillary works, interest and tax effects are not included. The 4,561 properties / 81,084 rooms uniformly recorded with an opening date of January 1, 1990 and properties with unknown opening year are excluded from the building-age tallies. For ryokan, the founding year is sometimes recorded. Among properties aged 25–35 years, the 467 properties / 68,403 rooms with a renovation date of 2015 or later recorded may have already replaced part of their equipment, so the estimates lean toward the upper end.
■ Market Data
- MetroEngines Research & Consulting — Property master (opening year, room count, hotel type, location; 40,011 properties confirmed operating, as of September 2026)
■ Government and Public Sources
- National Institute for Land and Infrastructure Management (NILIM), Project Research Report No. 4, Development of Management and Operation Technologies for Housing and Social Infrastructure, reference material (approach to service lives of major building parts, components and equipment) (Japanese)
- MLIT, Standard Format for Long-Term Repair Plans, Guidelines for Preparing Long-Term Repair Plans and Commentary (revised June 2024) (Japanese)
- Ministry of the Environment, GHG Emission Reduction Guidelines measures catalogue — Installing high energy-efficiency boilers (Japanese)
- Ministry of the Environment, GHG Emission Reduction Guidelines measures catalogue — Installing high-efficiency heat pumps (Japanese)
- Japan Tourism Agency, Overnight Travel Statistics Survey (2025 annual figures, final) (Japanese)
- Japan Tourism Agency, Lodging Facility Sustainability Enhancement Support Program, program overview (Japanese)
- Japan Tourism Agency, Applications open for the Lodging Facility Sustainability Enhancement Support Program (2025) (Japanese)
- Sustainable open Innovation Initiative (SII), FY2025 supplementary budget Energy Efficiency and Non-Fossil Conversion Subsidy (equipment-unit type) (Japanese)
■ Manufacturer and Industry Sources
- Hitachi Building Systems, Elevator Renewal (Japanese)
- Toshiba Elevator and Building Systems, FAQ on Renewal and Refurbishment Work (Japanese)
- Ainichi, Elevator Renewal Work: Costs, Work Periods and Replacement Timing (Japanese)
- Daikin Industries, What Do Commercial Air Conditioners Cost Including Installation? (Japanese)