

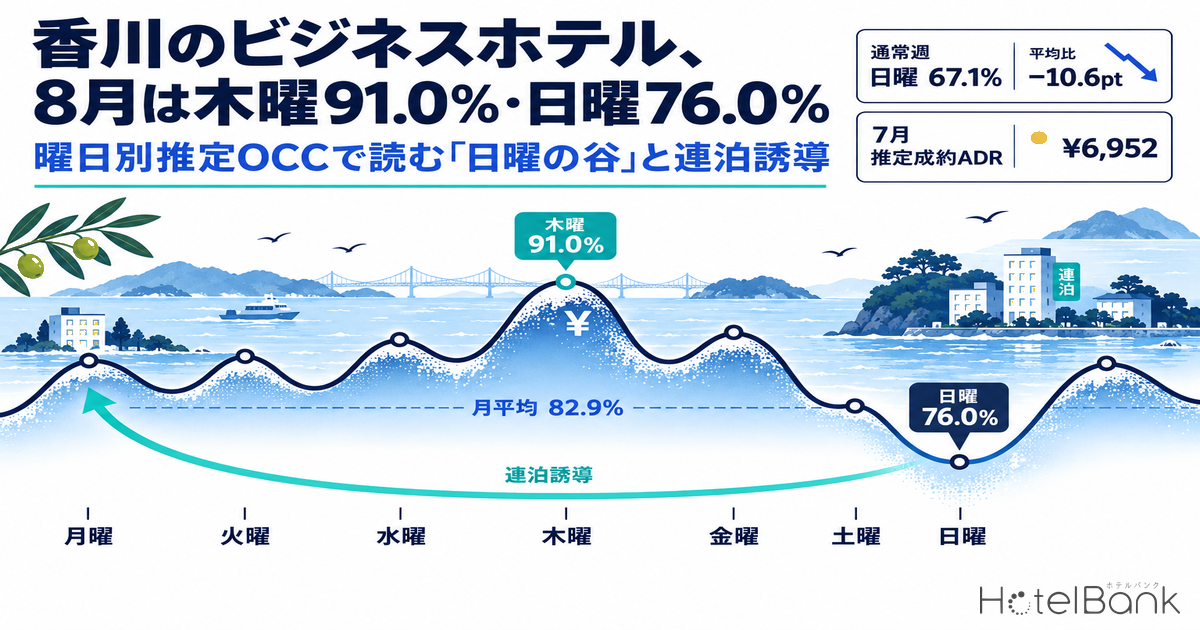
Among business hotels in Kagawa Prefecture (an estimated-OCC cohort of 40–42 properties), estimated OCC (based on OTA-listed inventory) averaged 82.9% in August 2026. By day of week, Thursday was the highest at 91.0%, while Sunday reached only 76.0% and Monday 77.0%. Averaged over the 80 “regular-week” days of June–August, excluding the long weekend and the Obon holiday period, Sunday came in at 67.1%, 10.6pt below the overall regular-week average of 77.7%. Sundays before a public holiday (July 19 and August 9), however, exceeded 90%, showing that the Sunday trough is a demand gap that disappears depending on the calendar. Drawing on day-of-week estimated OCC, booking curves for one week in mid-September (from 45 days before the stay date to the day before), and current October booking pace, this article sets out how to fill the Sunday and Monday troughs through multi-night stay incentives, capturing corporate and MICE demand, and plan design for slow days.
Scope: Kagawa Prefecture business hotels, N=40–45 properties (estimated OCC; a fixed cohort for each stay date, 2,924–3,031 rooms); estimated settled ADR N=83–92 properties (varies by month). Pricing in this article is estimated settled ADR (the settled price level estimated from OTA and other sales data, tax-exclusive equivalent); occupancy is an estimate based on OTA-listed inventory. Definitions are at the end of the article. Data as of: September 24, 2026.
- — Sunday 67.1%, −10.6pt vs. average — In the regular weeks of June–August 2026 (80 days excluding long weekends and Obon), Sunday had the lowest estimated OCC, and Monday was also below average at 72.1% (−5.7pt).
- — Sundays before a holiday exceed 90% — July 19, 2026 hit 91.8% and August 9 hit 92.3%. The Sunday trough is not an absence of demand; it arises because there is no “reason to stay” on Sunday night.
- — Sunday gains little close to arrival — In the September reference week, the pickup from 30 days out to the day before was only +29.1pt for Sunday, far below Tuesday (+45.9pt) and Wednesday (+42.8pt).
- — Shallower trough than neighboring prefectures, but lower weekday peaks — Kagawa’s Sunday gap is shallower than Okayama and Ehime (−14.9pt) and Hiroshima (−15.3pt), but Thursday reaches only 83.1% in Kagawa versus 89.4% in Okayama and 90.6% in Hiroshima.
- — Summer estimated settled ADR fell YoY in all three months — July 2026 was ¥6,952 (−7.5% YoY). 2025 was a Setouchi Triennale year, so October–November YoY comparisons will also be against festival months.
Estimated OCC by Day of Week — Peaks on Thursday and Saturday, Troughs on Sunday and Monday
We first averaged the daily actuals for completed months by day of week. The cohort consists of Kagawa business hotels that list at least 30% of their total rooms on OTAs and similar channels; for June–August 2026 it covered 40–42 properties and 2,924–2,995 rooms per day (based on listings on major booking sites). Averaged over all days of the month, August by day of week was Thursday 91.0%, Wednesday 86.5%, Tuesday 85.3%, Saturday 84.8%, Friday 82.5%, Monday 77.0% and Sunday 76.0%. In July, Saturday (84.8%), Tuesday (83.3%) and Thursday (82.4%) were high, while Sunday (71.5%) and Monday (74.0%) were low. In both months, Sunday and Monday were the bottom two days.
Monthly averages, however, mix in special dates such as the Marine Day three-day weekend (July 18–20) and the stretch from Mountain Day through Obon (August 8–16). We therefore excluded these two periods and averaged the remaining 80 days of June–August by day of week as “regular weeks” (the line in the chart below). The regular-week average was 77.7%. Above it were Saturday at 84.0% (+6.3pt), Thursday at 83.1% (+5.4pt) and Wednesday at 80.7% (+3.0pt); Tuesday (77.8%) and Friday (78.4%) were roughly at the average. Below it were Monday at 72.1% (−5.7pt) and Sunday at 67.1% (−10.6pt). On weekdays, occupancy climbs from Tuesday to Thursday, dips on Friday, and peaks again on Saturday. Sunday is the deepest trough, and Monday is also below average.
Source: Compiled by HotelBank Editorial Team from MetroEngines Research (Kagawa business hotels N=40–42 properties, 2,924–2,995 rooms, based on listings on major booking sites. Regular weeks = the 80 days of June–August excluding July 18–20 and August 8–16)
| Day | Jun–Aug regular-week avg. | Diff. vs. regular-week avg. | Days | July (all days) | August (all days) |
|---|---|---|---|---|---|
| Monday | 72.1% | −5.7pt | 12 days | 74.0% | 77.0% |
| Tuesday | 77.8% | +0.1pt | 12 days | 83.3% | 85.3% |
| Wednesday | 80.7% | +3.0pt | 12 days | 81.7% | 86.5% |
| Thursday | 83.1% | +5.4pt | 12 days | 82.4% | 91.0% |
| Friday | 78.4% | +0.7pt | 12 days | 76.8% | 82.5% |
| Saturday | 84.0% | +6.3pt | 10 days | 84.8% | 84.8% |
| Sunday | 67.1% | −10.6pt | 10 days | 71.5% | 76.0% |
| All days | 77.7% | — | 80 days | 79.3% | 82.9% |
Source: Compiled by HotelBank Editorial Team from MetroEngines Research (Estimated OCC based on OTA-listed inventory. N=40–42 properties. July and August are simple day-of-week averages of all days in the month)
On the regular-week average, the gap between the highest day (Saturday) and the lowest (Sunday) is 16.9pt, and the gap between the weekday peak (Thursday) and Sunday is 16.0pt. Sunday looks as high as 76.0% on the all-days August average because it includes a Sunday before a holiday (August 9), discussed below; excluding the long weekend containing that day and Obon, August regular-week Sundays averaged 73.6% (3 days). Looking only at monthly averages leads you to underestimate how deep the trough really is. Business hotels in neighboring Okayama Prefecture, linked to Kagawa by the Great Seto Bridge, show the same Sunday trough pattern.
Sunday Stays Lowest Under Every Aggregation — Trough Depth of −6.9 to −14.0pt
To check how much the depth of the trough depends on how the data are sliced, we recalculated how far Sunday and Monday fall below the period average under seven combinations of month (June, July, August, and all three months) and day set (all days in the month, or regular weeks excluding long weekends and Obon). Sunday’s gap ranged from −6.9pt (August, all days) to −14.0pt (July, regular weeks), but Sunday was the lowest day in all seven cases. Monday’s gap varied widely from −1.7 to −7.9pt, approaching the average in July’s regular weeks. The Sunday trough holds regardless of aggregation, while the Monday trough varies considerably by month.
| Period | Day set | Days | Period avg. | Sunday | Sunday gap | Monday gap | Lowest day |
|---|---|---|---|---|---|---|---|
| June | All days (no holidays) | 30 days | 74.0% | 64.1% | −9.9pt | −6.2pt | Sunday |
| July | All days | 31 days | 79.3% | 71.5% | −7.9pt | −5.3pt | Sunday |
| July | Regular weeks | 28 days | 78.7% | 64.7% | −14.0pt | −1.7pt | Sunday |
| August | All days | 31 days | 82.9% | 76.0% | −6.9pt | −5.9pt | Sunday |
| August | Regular weeks | 22 days | 81.6% | 73.6% | −8.0pt | −7.9pt | Sunday (narrowly below Monday at 73.7%) |
| Jun–Aug | All days | 92 days | 78.8% | 70.9% | −7.9pt | −5.9pt | Sunday |
| Jun–Aug | Regular weeks | 80 days | 77.7% | 67.1% | −10.6pt | −5.7pt | Sunday |
Source: Compiled by HotelBank Editorial Team from MetroEngines Research (Estimated OCC based on OTA-listed inventory. N=40–42 properties. Gaps calculated from unrounded values. July and August regular weeks contain only 3 Sundays each, so a single day can move the value)
Compared With Neighboring Setouchi Prefectures — Kagawa’s Sunday Trough Is Shallower, but So Are Its Weekday Peaks
Under the same conditions (80 regular-week days of June–August 2026, fixed business hotel cohorts), we compared Kagawa with three neighboring Setouchi prefectures. Kagawa’s Sunday gap of −10.6pt is 4–5pt shallower than Okayama and Ehime (−14.9pt) and Hiroshima (−15.3pt). This is not, however, because Kagawa’s Sundays are strong. Sunday levels are nearly identical — Kagawa 67.1%, Okayama 67.9%, Hiroshima 68.8% — and what separates them is the height of the weekday peaks. Thursday reached 89.4% in Okayama and 90.6% in Hiroshima versus 83.1% in Kagawa, and Kagawa’s regular-week average is also 5–6pt lower than Okayama’s and Hiroshima’s. Sundays before a holiday filled to 87–93% in all four prefectures, so the pattern of “Sundays fill when the next day is off” is not unique to Kagawa. When thinking about lifting Sundays in Kagawa, it should be considered together with the room to bring weekday peaks closer to Okayama and Hiroshima levels.
| Prefecture | Properties / rooms | Regular-week avg. | Sunday | Sunday gap | Monday gap | Highest day | Highest day vs. Sunday | Jul 19 (Sun) | Aug 9 (Sun) |
|---|---|---|---|---|---|---|---|---|---|
| Kagawa | 40–42 / 2,924–2,995 | 77.7% | 67.1% | −10.6pt | −5.7pt | Saturday 84.0% | 16.9pt | 91.8% | 92.3% |
| Okayama | 42–46 / 4,671–5,423 | 82.8% | 67.9% | −14.9pt | −3.8pt | Thursday 89.4% | 21.5pt | 87.2% | 89.2% |
| Hiroshima | 87–94 / 10,043–11,031 | 84.1% | 68.8% | −15.3pt | −6.0pt | Thursday 90.6% | 21.8pt | 89.1% | 92.6% |
| Ehime | 48–50 / 5,009–5,232 | 76.7% | 61.8% | −14.9pt | −3.7pt | Wednesday 82.8% | 21.0pt | 87.5% | 92.9% |
Source: Compiled by HotelBank Editorial Team from MetroEngines Research (Fixed business hotel cohorts in each prefecture, based on listings on major booking sites. Estimated OCC based on OTA-listed inventory. Regular weeks = 80 days excluding July 18–20 and August 8–16. Highest day vs. Sunday is the difference between displayed values)
Sundays Before a Holiday Exceed 90% — The “Sunday Trough” Moves With the Calendar
Whether the Sunday trough is structural becomes clear from Sundays followed by a public holiday. Sunday, July 19, 2026, the day before Marine Day, recorded estimated OCC of 91.8% (as of the day before the stay date, N=42 properties), and Sunday, August 9, two days before Mountain Day, recorded 92.3% — both more than 20pt above the regular-week Sunday average of 67.1%. Conversely, Monday, July 20 (Marine Day), the last night of the long weekend, fell to 65.3%, and in the latter half of Obon, Saturday, August 15 fell to 69.9% and Sunday, August 16 to 66.7%.
| Stay date | Position in the calendar | Estimated OCC | Properties |
|---|---|---|---|
| Jul 19 (Sun) | Day before Marine Day (middle of three-day weekend) | 91.8% | 42 properties |
| Jul 20 (Mon, holiday) | Last day of three-day weekend | 65.3% | 42 properties |
| Aug 9 (Sun) | Two days before Mountain Day (11th) | 92.3% | 42 properties |
| Aug 10 (Mon) | Day before Mountain Day | 90.0% | 42 properties |
| Aug 13 (Thu) | Start of Obon | 97.7% | 42 properties |
| Aug 15 (Sat) | Latter half of Obon | 69.9% | 41 properties |
| Aug 16 (Sun) | Last night of Obon | 66.7% | 40 properties |
| Reference: regular-week Sunday | Average of 10 days, Jun–Aug | 67.1% | 40–42 properties |
Source: Compiled by HotelBank Editorial Team from MetroEngines Research (Estimated OCC based on OTA-listed inventory. Public holidays per Cabinet Office, “National Holidays”)
If the next day is also a day off, Sunday night fills; if the next day is a work or school day, it empties. In other words, the Sunday trough arises not because there is “no reason to come to Kagawa” but because there is “no reason to stay on Sunday night.” Weekend leisure travelers head home on Sunday, and weekday business travelers start staying from Monday night. The night in between goes empty — that is the day-of-week structure of Kagawa’s business hotels. Monday falling 5.7pt below average is likely because the start of the week is a travel day and business stays tend to concentrate from Tuesday onward. Three directions for action suggest themselves: (1) getting weekend leisure travelers to stay Sunday night as well, (2) getting business travelers to arrive the night before on Sunday, and (3) capturing accommodation for meetings and events that start on Sunday or Monday.
Day-of-Week Differences in the Booking Curve — Sunday Also Gains Little Close to Arrival
To see when the day-of-week differences emerge, we compared the progression of estimated OCC from 45 days before the stay date to the day before (the booking curve) for the seven days from Saturday, September 12 to Friday, September 18. Each day covered 42–45 properties and 2,995–3,031 rooms (based on listings on major booking sites). Because Silver Week began on the 19th, Friday the 18th includes eve-of-holiday demand.
Source: Compiled by HotelBank Editorial Team from MetroEngines Research (Kagawa business hotels N=42–45 properties, 2,995–3,031 rooms, based on listings on major booking sites. Observations from 45 days before the stay date to the day before)
| Stay date | Properties / rooms | 45 days out | 30 days out | Final (day before) | Pickup, 30 days out → final |
|---|---|---|---|---|---|
| Sep 12 (Sat) | 42/2,995 | 39.3% | 48.5% | 80.9% | +32.4pt |
| Sep 13 (Sun) | 42/2,995 | 31.7% | 38.1% | 67.2% | +29.1pt |
| Sep 14 (Mon) | 43/3,003 | 31.2% | 38.2% | 77.3% | +39.1pt |
| Sep 15 (Tue) | 45/3,031 | 29.4% | 38.5% | 84.4% | +45.9pt |
| Sep 16 (Wed) | 43/3,003 | 34.2% | 43.6% | 86.4% | +42.8pt |
| Sep 17 (Thu) | 45/3,031 | 39.3% | 46.2% | 85.9% | +39.7pt |
| Sep 18 (Fri) | 43/3,003 | 55.5% | 60.0% | 75.7% | +15.7pt |
Source: Compiled by HotelBank Editorial Team from MetroEngines Research (Estimated OCC based on OTA-listed inventory)
At 45 days out, Sunday (31.7%), Monday (31.2%) and Tuesday (29.4%) are at almost the same level. The gap opens from 30 days out. From 30 days out to the final day, Tuesday picked up +45.9pt, Wednesday +42.8pt and Monday +39.1pt, but Sunday gained only +29.1pt and was the lowest of the seven days at 67.2% as of the day before. Weekdays receive many last-minute bookings, but Sunday struggles to attract equivalent close-in demand.
Friday, September 18 was already the highest at 55.5% at 45 days out, yet its pickup from 30 days out to the final day was the smallest at +15.7pt. Days that fill early, like the eve of a long weekend, and days that never fully fill, like Sunday, call for different approaches to inventory management. Reading a stay date’s character from just three checkpoints — 45 days out, 30 days out and the final day — is a practical way to tell these types apart.
October Booking Pace So Far — Sunday and Monday Ahead of the September Reference Week
Using the mid-September week above as a reference week, we compared current October booking pace by day of week at the same number of days before the stay date (October observed as of September 23; 43 properties, 3,003 rooms). Because the two weeks differ in both season and day sequence, this is not a judgment of demand strength; treat it as a guide for checking your own property’s booking pace.
| Stay date | Days before stay | Current estimated OCC | Sep reference week, same day, same lead time | Sep reference week, same day, final |
|---|---|---|---|---|
| Oct 15 (Thu) | 22 days | 61.1% | 52.6% | 85.9% |
| Oct 17 (Sat) | 24 days | 71.5% | 51.5% | 80.9% |
| Oct 18 (Sun) | 25 days | 58.0% | 39.9% | 67.2% |
| Oct 19 (Mon) | 26 days | 49.9% | 40.4% | 77.3% |
| Oct 22 (Thu) | 29 days | 65.9% | 44.2% | 85.9% |
| Oct 25 (Sun) | 32 days | 52.3% | 38.4% | 67.2% |
| Oct 26 (Mon) | 33 days | 45.4% | 36.7% | 77.3% |
Source: Compiled by HotelBank Editorial Team from MetroEngines Research (October: N=43 properties, 3,003 rooms; September reference week: N=42–45 properties. Estimated OCC based on OTA-listed inventory. October values are estimates based on current sales and may change)
All seven October days are running ahead of the reference week at the same lead time. Sunday, October 18 stood at 58.0% at 25 days out, 18.1pt above the reference week at the same point (39.9%), with weekend bookings coming in early following Saturday, October 17 at 71.5%. Within the week, however, the order — Sunday and Monday below Thursday and Saturday — is unchanged in October. Monday, October 26 was at 45.4% at 33 days out, the lowest of the seven days in the table. For the Monday trough, it is still too early to tell how much last-minute business demand will fill it.
Monthly Estimated Settled ADR — July and August Below the Previous Year
We check pricing not by day of week but through monthly estimated settled ADR (N=83–92 properties, varying by month). Comparing finalized months year over year, June 2026 was about ¥6,500 (−0.9% YoY), July about ¥7,000 (−7.5%) and August about ¥8,100 (−3.1%), so all three high-occupancy summer months came in below the previous year. Note that 2025 was a Setouchi Triennale year, with the summer session running August 1–31 and the autumn session October 3–November 9. The August 2026 YoY figure is therefore a comparison against a festival month. The same caution applies when reading October–November YoY figures, which will also be compared against festival months.
Source: Compiled by HotelBank Editorial Team from MetroEngines Research (Kagawa business hotels, estimated settled ADR, tax-exclusive equivalent, finalized months only. N=83–92 properties)
| Month | 2025 (final) | 2026 | YoY | 2026 N= |
|---|---|---|---|---|
| June | ¥6,547 | ¥6,490 (final) | −0.9% | 91 properties |
| July | ¥7,512 | ¥6,952 (final) | −7.5% | 92 properties |
| August | ¥8,412 | ¥8,148 (final) | −3.1% | 91 properties |
| September | ¥7,397 | ¥9,905 (current estimate) | Pending month-end finalization | 89 properties |
| October | ¥7,482 | ¥9,484 (current estimate) | Pending month-end finalization | 87 properties |
Source: Compiled by HotelBank Editorial Team from MetroEngines Research (2025 June–October N=83–87 properties. 2026 September and October values are estimates based on current sales and may change; direct comparison with finalized values should wait for month-end finalization)
This article does not address price differences by day of week. While monthly estimated settled ADR fell below the previous year, the same months also contained days that filled to around 90%, such as Thursdays, Saturdays and Sundays before holidays. Reviewing the summer’s day-of-week structure and checking how far peak-occupancy days were reflected in monthly rates is the starting point for pricing from autumn onward.
For Revenue Managers of Business Hotels in Kagawa — Implications and Action Plan
1. Look at your own day-of-week curve separately for regular weeks and special dates. In the market’s regular weeks, Sunday was 67.1% and Monday 72.1%, versus 83.1% on Thursday and 84.0% on Saturday. Whole-month day-of-week averages make the Sunday trough look shallower because long weekends and Obon are mixed in. Re-aggregating your own results on regular weeks that exclude holidays, long weekends and Obon makes clear which days need action.
2. The Sunday trough disappears when the next day is a day off. As Sunday, July 19 (91.8%) and Sunday, August 9 (92.3%) show, the demand is there as long as there is a reason to stay on Sunday. Weekend two-night stays and business or meeting packages that let guests arrive Sunday and start Monday morning are ways to create that “reason to stay.”
3. Sundays cannot rely on last-minute pickup. In the September reference week, pickup from 30 days out to the final day was +45.9pt for Tuesday but +29.1pt for Sunday. Applying the weekday practice of waiting until the last minute to Sundays tends to leave rooms unfilled on the day. For Sundays, it works better to put multi-night and early-booking offers in place earlier than 30 days out.
4. Autumn YoY comparisons will be against a Triennale year. October 3–November 9, 2025 was the autumn session of the Setouchi Triennale. When comparing October–November estimated settled ADR with the previous year, evaluate it with the understanding that the comparison is against festival months.
| Timing | Action | Decision trigger (figures from this article) | Aim |
|---|---|---|---|
| This week | Aggregate your property’s June–August OCC by day of week on regular weeks excluding long weekends and Obon | If your Sunday–Thursday gap is larger than the market’s regular-week 16.0pt, prioritize Sunday measures | Set priorities for which days to act on |
| This week | Check your booking pace for Sun Oct 18 and 25 and Mon Oct 19 and 26 | If you are behind the market’s current levels (Sunday 58.0% and 52.3%, Monday 49.9% and 45.4%), consider setting multi-night stay conditions | Spot Sunday and Monday shortfalls early |
| Within 2 weeks | Create weekend two-night plans and products for stays that include a Sunday night | Weeks where Saturday books early and Sunday lags (e.g., Sat Oct 17 at 71.5% vs. Sun Oct 18 at 58.0%) | Get weekend leisure travelers to stay Sunday night too |
| Within 2 weeks | Offer corporate accounts stay conditions for arriving Sunday night and starting work Monday morning | If your property shares the market structure of Monday 5.7pt and Sunday 10.6pt below the regular-week average | Shift business demand onto Sunday night |
| Toward November and beyond | Check with organizers and the local convention bureau for academic conferences, training programs and sports events starting on Sunday or Monday | Sundays before holidays exceeded 90% (Jul 19: 91.8%, Aug 9: 92.3%), showing demand fills Sunday night when there is a reason to stay | Direct group demand to trough days |
| Toward November and beyond | Set Sunday selling conditions more than 30 days before the stay date | Sunday pickup from 30 days out to final is +29.1pt, smaller than weekdays (Tuesday +45.9pt) | Reduce days left unfilled by relying on last-minute demand |
All of these are guidelines based on market-wide figures; the optimal action depends on your room mix and share of corporate contracts. Start by laying your own day-of-week curve alongside the market’s regular weeks and checking how the depth and timing of the trough differ.
Summary — Three Yardsticks for Reading Day-of-Week Structure
| Yardstick | Kagawa business hotel value | How to use it |
|---|---|---|
| Trough depth (gap vs. regular-week average) | Sunday −10.6pt, Monday −5.7pt (average 77.7%) | Compare with your own regular weeks to see whether your trough is deeper than the market’s |
| Trough mobility (Sundays before holidays) | Jul 19: 91.8%, Aug 9: 92.3% | Evidence that Sundays fill when you create a reason to stay |
| Close-in pickup (30 days out → final) | Sunday +29.1pt, Tuesday +45.9pt, Wednesday +42.8pt | Vary when you set selling conditions by day of week |
Kagawa’s business hotels are supported by business travel on weekdays and leisure demand on Saturdays. Sunday falls in the gap between the two, yet the results for Sundays before holidays show that demand itself is not lacking. The depth of the trough, whether the trough moves, and how much is picked up close to arrival — re-measuring these three with your own data makes it easier to prioritize where to start among multi-night stay incentives, arrive-the-night-before proposals for corporate clients, and capturing group demand.
Frequently Asked Questions
Q. Which day of the week has the lowest occupancy at Kagawa business hotels?
A. Sunday. In the regular weeks of June–August 2026 (80 days excluding long weekends and Obon), Sunday estimated OCC was 67.1%, 10.6pt below the regular-week average of 77.7%. The next lowest was Monday at 72.1% (−5.7pt). Across seven different ways of slicing months and day sets, Sunday was always the lowest day.
Q. Are Sundays always hard to fill?
A. No. Sundays followed by a public holiday fill up. July 19, 2026 (the day before Marine Day) reached 91.8% and August 9 (two days before Mountain Day) 92.3%, more than 20pt above the regular-week Sunday average. The Sunday trough is a gap created by the next day being a weekday.
Q. Is Kagawa’s Sunday trough deeper than in neighboring prefectures?
A. Kagawa’s is shallower. The gap versus the regular-week average was −10.6pt in Kagawa, compared with −14.9pt in Okayama and Ehime and −15.3pt in Hiroshima. Sunday levels, however, were close in all four prefectures at 62–69%; the difference comes from the height of the weekday peaks. Kagawa’s Thursday at 83.1% is lower than Okayama’s 89.4% and Hiroshima’s 90.6%.
Q. By when should Sunday selling conditions be set?
A. More than 30 days before the stay date is a good guideline. In the September reference week, Sunday’s pickup from 30 days out to the day before was +29.1pt, smaller than Tuesday (+45.9pt) and Wednesday (+42.8pt), indicating that Sundays are hard to fill with last-minute bookings. Multi-night and early-booking offers work better when launched early.
Q. Is estimated OCC the same as actual room occupancy?
A. No. Estimated OCC is derived from how OTA-listed inventory is being absorbed (100 − 100 × OTA-listed rooms remaining ÷ total rooms). Because rooms not listed on OTAs are counted as sold, it tends to run higher than actual room occupancy. When comparing with your own results, it is better to look at differences between days and trends rather than absolute levels.
About the Data
| Estimated OCC definition | OTA-listed-inventory-based occupancy = 100 − 100 × OTA-listed rooms remaining ÷ total rooms. The cohort is a fixed set of properties listing at least 30% of their total rooms on OTAs (the same set for each stay date). This is an estimate based on the absorption of inventory sold on OTAs and differs in definition from actual room occupancy (it runs higher because unlisted rooms are counted as sold). |
| Booking curve | Based on observations from 45 days before the stay date to the most recent point. Day-of-week estimated OCC for completed months (June–August 2026) uses values as of the day before each stay date. October is observed as of September 23, 2026. |
| Estimated settled ADR definition | The settled price level (tax-exclusive equivalent) estimated from OTA and other sales data (lowest-plan price level × property-type coefficient, an ensemble across multiple channels). Past months are finalized values; current and future months are estimates based on current sales. Median error of 6.6% when checked against published operating results. |
| Scope (N=) | Estimated OCC: cohort of Kagawa business hotels. June–August 2026 N=40–42 properties, 2,924–2,995 rooms; September 12–18 N=42–45 properties, 2,995–3,031 rooms; October N=43 properties, 3,003 rooms (all based on listings on major booking sites). Estimated settled ADR: Kagawa business hotels N=83–92 properties (January 2025–October 2026, varies by month). Regular weeks = the 80 days of June–August 2026 excluding July 18–20 and August 8–16. |
| Data as of | Data as of: September 24, 2026. Sales and inventory change daily, so the figures in this article are a snapshot at the time of retrieval. |
References and Sources
■ Data sources
Estimated OCC (fixed cohort per stay date), booking curves and estimated settled ADR for Kagawa business hotels were aggregated from MetroEngines Research accommodation data (daily observations of listed inventory and selling prices on major booking sites). The neighboring-prefecture comparison uses cohorts built under the same conditions for Okayama, Hiroshima and Ehime. Public holidays are per the Cabinet Office; Triennale session dates are per the official website and Bijutsu Techo.
■ Calculation assumptions
Regular weeks = the 80 days of June–August 2026 excluding July 18–20 and August 8–16. Day-of-week values for completed months are simple averages by day of week of estimated OCC as of the day before each stay date; gaps versus the period average were calculated from unrounded values. October values are observations as of September 23, compared with values at the same number of days out in the September reference week (September 12–18). YoY changes in estimated settled ADR compare finalized values only.
■ Limitations and caveats
Estimated OCC is an estimate based on OTA-listed inventory; it differs in definition from actual room occupancy and runs higher. The cohort is limited to properties listing at least 30% of their total rooms on OTAs. Some monthly regular-week cells contain only 3 Sundays, so a single day can move the value. October booking pace and September–October estimated settled ADR are current estimates and may change. Explanations of the background to day-of-week differences (the business/leisure mix) include conjecture.
| Setouchi Triennale official website | Overview of the Triennale |
| Bijutsu Techo: “Setouchi Triennale 2025” to open in April 2025 | 2025 session dates (spring Apr 18–May 25, summer Aug 1–31, autumn Oct 3–Nov 9) |
| Cabinet Office: About “National Holidays” | Public holiday dates |