

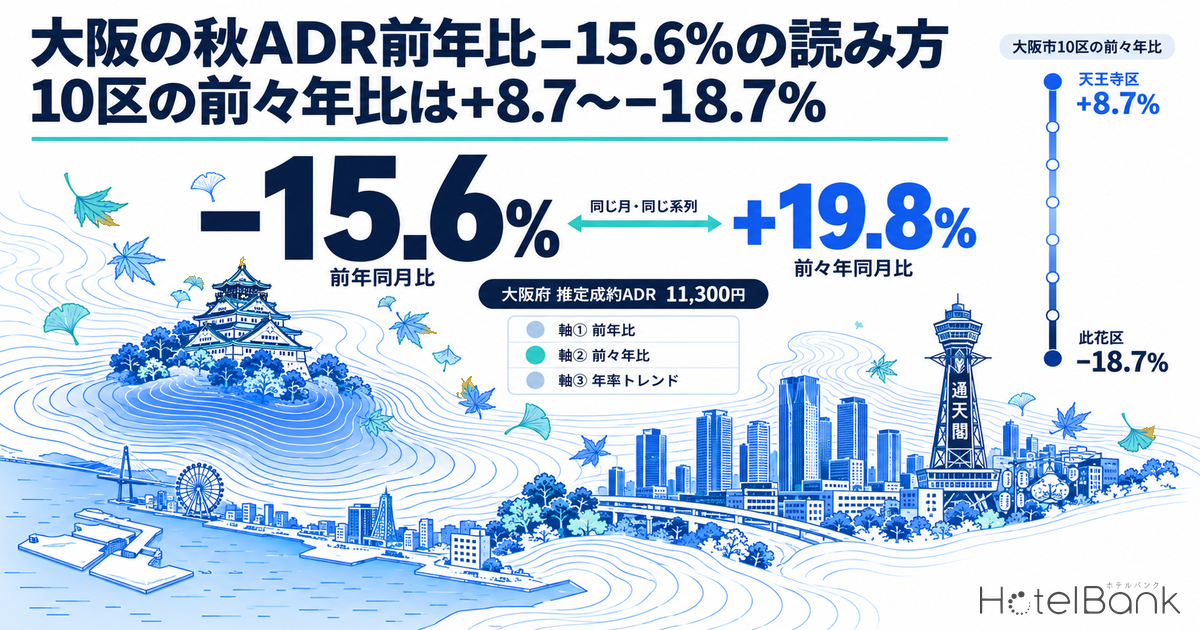
Osaka Prefecture’s estimated settled ADR for October 2026 is ¥11,300 (N=642 properties). Against ¥13,400 in the same month a year earlier, that is −15.6%. Yet compare the same October with pre-Expo 2024 and it moves from ¥9,400 to ¥11,300, or +19.8%. One view shows a steep decline, the other a double-digit rise, and both come from the same series. Year-over-year comparison implicitly assumes the comparison year was a normal one. In Osaka, which hosted Expo 2025 Osaka, Kansai from April 13 to October 13, 2025, that assumption does not hold until October 2026. Using Osaka’s autumn as the case, this article lines up three yardsticks — year-over-year, two-year (vs 2024) and an annualized long-term trend — and also covers how to handle the difference in basis between finalized figures and listing snapshots, to show how internal KPIs can be reset.
Key Takeaways
- Osaka Prefecture in October 2026: estimated settled ADR ¥11,300, −15.6% year-over-year and +19.8% versus the same month two years earlier. The same month and the same series lead to opposite conclusions.
- The year-over-year decline narrows month by month: −33.9% in September → −15.6% in October → −5.3% in November. This is not because 2026 is getting stronger; it is because fewer Expo days fall inside the 2025 comparison months.
- For June–August, where finalized figures are available, the two-year change is −4.1% to −1.3%. September–December are on a listing-snapshot basis (+0.7% to +19.8%), so the two cannot be read as one continuous line. The same step appears, in the same direction, in Tokyo, Kyoto, Aichi and Fukuoka.
- Annualized from July–August 2019, the prefecture-wide trend is +2.93% per year — about 2 points below the national lodging CPI (+4.88% per year), which places Osaka on the long-term trend.
- Across 10 Osaka City wards, the two-year change runs from +8.7% (Tennoji) to −18.7% (Konohana), a 27.4-point spread. A single prefecture-wide number hides these area differences.
- Even in months when rates fell about 30% year-over-year, estimated OCC held at 77.6–83.8%. The adjustment is showing up in price, not in inventory absorption.
Metric Definitions Used in This Article
- ADR (Average Daily Rate) = an estimated settled rate (tax-excluded equivalent), calculated by applying category-specific adjustment factors to the lowest plan price each property publishes on OTAs and other channels (per room, 2 guests per room, tax included). Checked against property-level results disclosed by listed hotel REITs (91 properties, latest 3 months), the median error is about 7%. These are estimates and differ from each property’s actual settled prices and accounting figures. Area-level ADR is the median of the covered properties (the level of a typical property in the area).
- Finalized figures / listing snapshot = past months whose monthly data are closed use the verified historical basis (“finalized figures” in this article); the current month onward is estimated from listed prices at the time of the survey (“listing snapshot”). Because the bases differ, levels should only be compared within the same basis.
- OCC (Occupancy Rate) = rooms sold as a share of total rooms in the area (estimate based on OTA sales inventory).
- Where listed prices are mentioned, they are per-room prices for 2 guests per room (tax included).
- Data source: MetroEngines Research. Data as of September 20, 2026.
The Low YoY Comes From the Shape of 2025, Not 2026
First, we overlay Osaka Prefecture’s estimated settled ADR for four years: 2019, 2024, 2025 and 2026. Rather than one line running across years, the chart aligns January–December on the horizontal axis, so it is easy to see which year has a different shape in which period.
Source: MetroEngines Research; compiled by HotelBank Editorial Team
2024 stays in a ¥8,400–¥10,200 range all year — some seasonal ups and downs, but essentially flat. 2025 tracks 2024 through March, jumps to ¥13,200 in April, stays high through a September peak of ¥13,800 and ¥13,400 in October, then falls to ¥12,000 in November and ¥11,100 in December. This elevated period almost exactly matches the Expo 2025 Osaka, Kansai period (April 13 – October 13, 2025; 184 days; 25.57 million general visitors).
For 2026, the finalized figures are ¥8,100 in June, ¥8,800 in July and ¥9,100 in August — nearly the same path as the same months of 2024 (¥8,400 / ¥8,900 / ¥9,400). In other words, 2026 has simply returned to 2024 levels; year-over-year shows double-digit declines only because 2025, the denominator, is an “island” one step higher. As long as the comparison is against that 2025 island, Osaka’s year-over-year figures will structurally stay negative through October 2026.
The Expo’s April 13 opening and October 13 closing show up directly in the monthly declines. In April 2025, 18 days fell within the Expo period (60% of 30 days); in October, 13 days (42% of 31 days). The fact that 2026 year-over-year is deepest in September and becomes rapidly shallower in October and November follows the order in which Expo days drop out of the comparison months.
Three Yardsticks Side by Side — YoY, Two-Year Change and Annualized Trend
What should you look at in months when year-over-year does not work? In practice there are three candidates. The first is the two-year change (vs the same month two years earlier), which skips the abnormal year entirely and compares directly with a normal year. The second is the 2-year CAGR (annualized), which turns the two-year change into “how much it moved per year.” The third is a long-term trend line, which shows the annual rate of growth since pre-COVID 2019. The table below lays out Osaka Prefecture’s monthly figures on these three axes.
| Month | 2019 | 2024 | 2025 | 2026 | 2026 basis | Axis 1: YoY | Axis 2: vs 2024 | Axis 3: vs 2019, annualized |
|---|---|---|---|---|---|---|---|---|
| Jun | — | ¥8,417 | ¥11,918 | ¥8,070 | Finalized | −32.3% | −4.1% | — |
| Jul | ¥6,928 | ¥8,876 | ¥12,645 | ¥8,761 | Finalized | −30.7% | −1.3% | +3.41% |
| Aug | ¥7,634 | ¥9,433 | ¥13,452 | ¥9,058 | Finalized | −32.7% | −4.0% | +2.47% |
| Sep | ¥6,838 | ¥9,030 | ¥13,764 | ¥9,094 | Listing snapshot | −33.9% | +0.7% | +4.16% |
| Oct | ¥7,046 | ¥9,440 | ¥13,392 | ¥11,306 | Listing snapshot | −15.6% | +19.8% | +6.99% |
| Nov | ¥7,697 | ¥10,166 | ¥11,982 | ¥11,341 | Listing snapshot | −5.3% | +11.6% | +5.69% |
| Dec | ¥6,968 | ¥10,106 | ¥11,120 | ¥10,753 | Listing snapshot | −3.3% | +6.4% | +6.39% |
Table 1: Osaka Prefecture estimated settled ADR and three yardsticks (N=622–653 properties). Axis 3 is annualized over the 7 years from the same month of 2019. June 2019 is outside the data period and shown as “—” / Source: MetroEngines Research; compiled by HotelBank Editorial Team
Looking only at Axis 1 (YoY), the reading is “a rapid recovery” from −32.3% in June to −3.3% in December. On Axis 2 (two-year change), June–August are at −4.1% to −1.3% — almost back to 2024 levels, neither recovering nor worsening. The same months in the same series can leave very different impressions.
Source: MetroEngines Research; compiled by HotelBank Editorial Team
Axis 3 serves as a yardstick for absolute level. Against an average of ¥7,300 in July–August 2019, July–August 2026 averaged ¥8,900, an annualized +2.93% over 7 years. Placing this next to the national lodging price index shows where Osaka stands. In the Statistics Bureau of Japan’s Consumer Price Index, the lodging index (national, 2020=100) averaged 125.5 in July–August 2019 and 175.1 in July–August 2026, or +4.88% per year. Osaka’s long-term estimated settled ADR trend has therefore built up about 2 points per year more slowly than national lodging prices. Why a price index and actual settled rates diverge is a separate question; a national three-year comparison (about 17,000 properties, 2023 average = 100) differs from this article’s Osaka, 2019-based annualized view in both scope and base year, so the size of the gaps cannot be compared directly.
Which of the three axes should be the internal KPI? In a market where the prior year was unusual, a practical order is Axis 2 as the primary indicator, Axis 3 as a supplementary indicator, and Axis 1 for reference. There is no need to drop Axis 1, but presenting it alone in meeting materials leads readers to misread the level. If you show Axis 1, always place Axis 2 next to it in the same table. That alone aligns how everyone interprets “−15.6%.”
Do Not Draw Finalized Figures and Listing Snapshots as One Line
Looking at Table 1 again, 2026 estimated settled ADR mixes two bases. Through August it is the verified historical basis after the month closed (finalized figures); from September onward it is an estimate based on prices listed on OTAs and elsewhere at the time of the survey (listing snapshot). Tracing the two-year change column from top to bottom, June–August are −4.1% to −1.3%, then a step appears: +0.7% in September and +19.8% in October.
To check whether this step is unique to Osaka, we lined up the two-year changes for Tokyo, Kyoto and Fukuoka using the same method. Even in markets without a large-event hangover like the Expo, a step in the same direction appears between August and September.
Source: MetroEngines Research; compiled by HotelBank Editorial Team
Taking the difference between the 3-month (June–August) average of finalized figures and the 4-month (September–December) average of listing snapshots gives Tokyo +25.9 points, Kyoto +22.8 points, Fukuoka +26.5 points and Osaka +12.8 points. In all four prefectures the step goes the same way, and by double-digit points. Aichi opens up even further at +57.3 points, but a large international sporting event scheduled in Nagoya for September–October 2026 also affects it, so it cannot be treated the same way.
Telling them apart is simple: read listing snapshots as progress, not as levels. They capture which price bands of inventory are listed at the time of the survey, so they move as check-in approaches, with new plans added and prices adjusted. They are therefore not grounds for stating as a level that “October has recovered to +19.8% vs two years ago”; they are best treated as progress information: “this is the price band currently listed for October.” Judge levels with finalized figures, and use listing snapshots to see how properties are pricing ahead. Keeping the two apart improves the accuracy of autumn reports.
It also means something that Osaka’s step, at +12.8 points, is the smallest of the four prefectures. One reading is that the bigger the prior-year surge in a market, the more its 2026 listed prices are set at a distance from prior-year results, which holds down the jump in listing snapshots.
By Category — Comparing Three Years Only Where Sample Sizes Hold Up
Stopping the three-year comparison at area level hides what happened in each hotel category. But the finer the category split, the fewer properties are covered, and the numbers start to move just from properties entering and leaving the sample. Using the June–August 2026 average, where Osaka Prefecture has finalized figures, we compare the three categories with sufficient sample size.
| Category | Properties | Jun–Aug 2024 | Jun–Aug 2025 | Jun–Aug 2026 | Axis 1: YoY | Axis 2: vs 2024 | Axis 3: vs 2019, annualized |
|---|---|---|---|---|---|---|---|
| Business hotels | 495〜503 | ¥8,761 | ¥12,442 | ¥8,362 | −32.8% | −4.6% | +2.89% |
| City hotels | 95〜97 | ¥12,349 | ¥16,237 | ¥12,143 | −25.2% | −1.7% | +3.49% |
| Ryokan | 36〜37 | ¥10,161 | ¥12,121 | ¥9,980 | −17.7% | −1.8% | +7.11% |
| Prefecture total | 644〜653 | ¥8,909 | ¥12,672 | ¥8,630 | −31.9% | −3.1% | +2.93% |
Table 2: Osaka Prefecture estimated settled ADR by category (average of June–August 2026 finalized figures). Axis 3 is annualized from the July–August 2019 average / Source: MetroEngines Research; compiled by HotelBank Editorial Team
On Axis 2, all three categories fall within −4.6% to −1.7%. Year-over-year they appear spread by more than 7 points — business −32.8%, city −25.2%, ryokan −17.7% — but that just mirrors differences in the prior-year surge. Measured by distance from 2024 levels, every category sits in a similar place. The bigger the surge in a category, the deeper its pullback appears.
Axis 3 brings out differences in long-term trend by category. Ryokan are highest of the three at +7.11% per year, followed by city hotels at +3.49% and business hotels at +2.89%. However, the ryokan sample shrank from 41–42 properties in 2019 to 36 in 2026, so changes in property mix may be affecting the figure. It is safer to use this to confirm that “long-term growth differs by category” than to lean on the size of the annual rates.
Resort hotels (7 properties) and capsule hotels (10 properties) in Osaka Prefecture were excluded from the three-year comparison because in some months their samples fall to single digits. In thin series, properties entering and leaving show up in the numbers more strongly than market movement. Checking the number of properties before comparing is also part of “resetting the yardsticks.”
10 Osaka City Wards — Recovery Differs by 27 Points by Area
The single prefecture-wide two-year figure of −3.1% averages away area differences within the city. Do wards near Yumeshima, the Expo site, recover differently from wards driven mainly by business demand? Using the June–August 2026 average, where finalized figures are available, we ranked 10 major Osaka City wards by two-year change.
| Ward | Main lodging clusters | Properties | 2024 | 2025 | 2026 | Axis 1: YoY | Axis 2: vs 2024 |
|---|---|---|---|---|---|---|---|
| Tennoji | Tennoji, Uehommachi | 24 | ¥7,534 | ¥10,772 | ¥8,190 | −24.0% | +8.7% |
| Suminoe* | Sakishima, Nanko | 7 | ¥10,315 | ¥15,046 | ¥10,640 | −29.3% | +3.2% |
| Yodogawa | Shin-Osaka | 38〜39 | ¥7,765 | ¥11,510 | ¥7,768 | −32.5% | ±0.0% |
| Kita | Umeda, Nakanoshima | 72〜74 | ¥9,655 | ¥13,658 | ¥9,507 | −30.4% | −1.5% |
| Minato* | Tempozan, Bentencho | 10〜11 | ¥10,434 | ¥15,905 | ¥10,224 | −35.7% | −2.0% |
| Abeno* | Abeno, Abenosuji | 5 | ¥11,531 | ¥18,245 | ¥11,146 | −38.9% | −3.3% |
| Naniwa | South Namba, Shin-Imamiya | 51〜56 | ¥9,940 | ¥14,792 | ¥9,553 | −35.4% | −3.9% |
| Chuo | Shinsaibashi, Namba, Hommachi | 193〜194 | ¥10,546 | ¥15,033 | ¥9,791 | −34.9% | −7.2% |
| Nishi | West Hommachi, Horie | 27〜28 | ¥9,611 | ¥14,066 | ¥8,572 | −39.1% | −10.8% |
| Konohana* | Sakurajima, Maishima, Yumeshima | 13 | ¥22,831 | ¥28,668 | ¥18,556 | −35.3% | −18.7% |
Table 3: Estimated settled ADR in 10 major Osaka City wards (average of June–August 2026 finalized figures, sorted by two-year change, descending). * Fewer than 20 properties covered; for reference only / Source: MetroEngines Research; compiled by HotelBank Editorial Team
Source: MetroEngines Research; compiled by HotelBank Editorial Team
The two-year change ranges from +8.7% in Tennoji to −18.7% in Konohana, a 27.4-point spread. The single prefecture-wide figure of −3.1% erases this spread entirely. Re-sorting by Axis 1 (YoY) gives only a 15.1-point spread, from −24.0% to −39.1%, and the ranking changes. For area comparisons too, Axis 2 is the higher-resolution yardstick.
There is a pattern in the distribution. Tennoji and Yodogawa (Shin-Osaka) at the top are driven mainly by business demand and travel within the Kinki region, and saw relatively small surges in 2025. A small surge means a small pullback, leaving them above 2024 levels. By contrast, Chuo (Shinsaibashi, Namba), Nishi and Konohana at the bottom took visitor demand directly in 2025, and show both a large surge and a large pullback.
Konohana is the only one of the 10 wards with a double-digit decline. It includes Yumeshima, where the Expo site was, and a large theme park, and the estimated settled ADR of its 13 covered properties moved from ¥22,800 in 2024 to ¥28,700 in 2025 and ¥18,600 in 2026. With only 13 properties, however, individual properties’ pricing can sway the total, so this should be read with a discount. Even so, the fact that “hardly any ward moves close to the prefecture-wide average” shows the value of resetting the yardsticks by area.
Adding Volume — Even When Rates Moved 30%, Inventory Absorption Stayed Around 80%
So far this has been about price. What you want to know next in practice is: “Did demand itself fall, or did only rates return to normal?” Separating whether the adjustment happened in price or in volume changes which actions to take. As the volume yardstick we use estimated OCC (based on OTA-listed inventory).
| Stay month (2026) | Properties | Rooms covered | Estimated OCC | Est. settled ADR (YoY) |
|---|---|---|---|---|
| May | 411 | 59,643 rooms | 83.8% | −26.2% |
| Jun | 405 | 59,272 rooms | 77.6% | −32.3% |
| Jul | 414 | 59,634 rooms | 81.7% | −30.7% |
| Aug | 409 | 58,700 rooms | 80.8% | −32.7% |
Table 4: Osaka Prefecture estimated OCC (based on OTA-listed inventory; estimates). Fixed cohort of properties listing at least 30% of total rooms on major booking sites / Source: MetroEngines Research; compiled by HotelBank Editorial Team
Source: MetroEngines Research; compiled by HotelBank Editorial Team
All four months fall within 77.6–83.8%, with a seasonal shape of a slight dip in June and recovery in July–August. In months when estimated settled ADR moved about 30% year-over-year, there is no sign that inventory absorption broke down. The adjustment is in price, while volume has broadly held. If this breakdown holds, the response leans toward resetting prices rather than additional spending to stimulate demand. September 2026 had only been observed for the 1st–20th at the time of this analysis; estimated OCC for that span was 80.2% (410 properties, 59,647 rooms).
Estimated OCC itself, however, cannot be used for a three-year comparison. Our inventory observation began in March 2026, so we have no matching values for the same months of 2024 and 2025. Where a long-term comparison on the volume side is needed, the published figures of the Japan Tourism Agency’s Overnight Travel Statistics Survey should be used instead. Price can be reset on three axes, but the yardsticks available for volume are limited — a constraint worth confirming before building autumn reports.
When Will Year-Over-Year Work Again?
Finally, we pin down month by month how long this will last. The only input needed is the Expo dates: April 13 – October 13, 2025. So in 2026 year-over-year, the denominator includes Expo days for the seven months from April to October; from November, the comparison months fall outside the Expo period again.
Source: MetroEngines Research; compiled by HotelBank Editorial Team
The actual figures move exactly this way. Year-over-year for January–March 2026 was +5.5% / −9.9% / −7.6%, a range that reads as normal. It dropped to −22.1% in April, deepened to −33.9% in September, then recovered to −15.6% in October, −5.3% in November and −3.3% in December. October sits between September and November because only 13 days of October 2025, the 1st through the 13th, fell within the Expo period (42% of 31 days). Months only partly covered by the Expo show only a partial decline.
That said, a clean year-over-year does not return straight away in November. Estimated settled ADR in November and December 2025 was +17.9% / +10.0% versus the same months of 2024. January–March 2025, before the Expo, were +7.8% / +6.9% / +8.0%, so the two months right after the closing still carried an extra lift of about 10 points. Because of that lift, year-over-year for November and December 2026 will also come out lower than it otherwise would. A fully clean comparison, with no Expo effect in either the prior or current year, returns only from April 2027.
In practice, it breaks down as follows. November 2026 – March 2027 is a transition period: move year-over-year back to the primary indicator, but show the two-year change alongside it to capture the post-closing lift. From April 2027, return year-over-year to the primary indicator. Until then, the simplest way to align readers’ interpretation is to put Axis 2 (two-year change) first and Axis 1 (YoY) as reference in internal materials.
Summary — Change the Yardstick and the Same Market Looks Different
Osaka in October 2026 is −15.6% year-over-year, +19.8% versus two years earlier, and +6.99% annualized from 2019. All three are correct figures from the same data, and asking which one is right has no answer. The picture becomes clear when the question becomes “which yardstick to use for which decision.”
Drawing on this article’s figures, four practical rules follow. First, judge levels by the two-year change on finalized figures. Osaka Prefecture is at −4.1% to −1.3% for June–August 2026, and −4.6% to −1.7% by category — back at 2024 levels. Second, check the long-term position with the annualized rate from 2019. The prefecture-wide +2.93% is slower than the national lodging price index (+4.88% per year), leaving room for further growth. Third, do not put finalized figures and listing snapshots on the same line. The step between August and September goes the same way in all four prefectures and is not unique to Osaka. Fourth, reset the yardsticks by area. The two-year change across 10 city wards spans 27.4 points, from +8.7% to −18.7%, so a single prefecture-wide figure is not enough to base decisions on.
A period when year-over-year does not work is also a chance to sharpen how you read the market. With several yardsticks in hand, the same steps can be reused the next time a large event or disaster distorts the denominator.
Related Articles
- Osaka Settled ADR June 2026: City −26.3%, Business −32.8% Post-Expo
- Japan Lodging CPI Rebased to 2025: YoY Cut by up to 1.6pt vs Your ADR (the switch to the new base from July 2026 data and how to connect the series)
- H1 2026 ADR YoY: 16 Prefectures Aligned, 31 Split Across 4 Categories (placing Osaka’s negative YoY within the national distribution)
- Osaka Sep 2026 Holiday: Demand Peaks First 2 Nights, Sep 23 at 58.0% (a worked example breaking volume down to the daily level)
- Osaka City vs Business Hotels: 1.49x ADR Gap Explained by Meals (what lies behind the rate gap between categories)
⚠ Note on ADR for future dates: In this article, estimated settled ADR from September 2026 onward is based on selling prices published on OTAs and elsewhere at the time of the survey (September 20, 2026) and will change as check-in dates approach. As noted in the text, these use a different basis from months with finalized figures and cannot be compared as levels on the same line.
References & Sources
■ Data Sources
MetroEngines Research estimated settled ADR (Osaka Prefecture, 10 Osaka City wards and by category, July 2019 – December 2026, N=622–653 properties) and estimated OCC (May–September 2026, 405–414 properties). The prefecture comparison covers Tokyo, Kyoto, Aichi and Fukuoka using the same method. The price index is the Statistics Bureau of Japan’s Consumer Price Index (2020 base, lodging, national). Expo period days and visitor numbers are published figures from Expo 2025 Osaka, Kansai. Data as of September 20, 2026.
■ Estimation Assumptions
Estimated settled ADR is an estimated settled rate (tax-excluded equivalent) obtained by applying category-specific adjustment factors to each property’s lowest plan price (per room, 2 guests per room, tax included); area-level figures are the median of covered properties. Past closed months use the verified historical basis (finalized figures); September 2026 onward is estimated from listed prices at the time of the survey (listing snapshot). Axis 1 is year-over-year, Axis 2 is the change versus the same month two years earlier (vs 2024), and Axis 3 is the rate annualized over 7 years from the same month of 2019 (July–August 2019 average for categories). Estimated OCC is based on OTA-listed inventory and calculated for a fixed cohort of properties listing at least 30% of total rooms on major booking sites.
■ Limitations
ADR and OCC are both estimates and differ from each property’s actual settled prices and accounting figures (median error about 7% against property-level results disclosed by listed hotel REITs). Finalized figures and listing snapshots use different bases, so levels cannot be compared as one line. Wards with fewer than 20 covered properties (Suminoe, Minato, Abeno, Konohana) are for reference only, and the resort hotel and capsule hotel series, which fall to single-digit samples, are excluded from the three-year comparison. Estimated OCC cannot be used for a three-year comparison with 2024 and 2025 because inventory observation began in March 2026.
■ Market Data
- MetroEngines Research — estimated settled ADR for Osaka Prefecture, 10 Osaka City wards and by category (July 2019 – December 2026); estimated OCC (May–September 2026). The prefecture comparison covers Tokyo, Kyoto, Aichi and Fukuoka using the same method.
■ Government Statistics & Public Data
- Statistics Bureau of Japan, Consumer Price Index (2020 base, lodging, national; e-Stat table ID 0003427113)
- Japan Tourism Agency, Overnight Travel Statistics Survey (宿泊旅行統計調査)
■ Expo Period & Visitor Numbers