

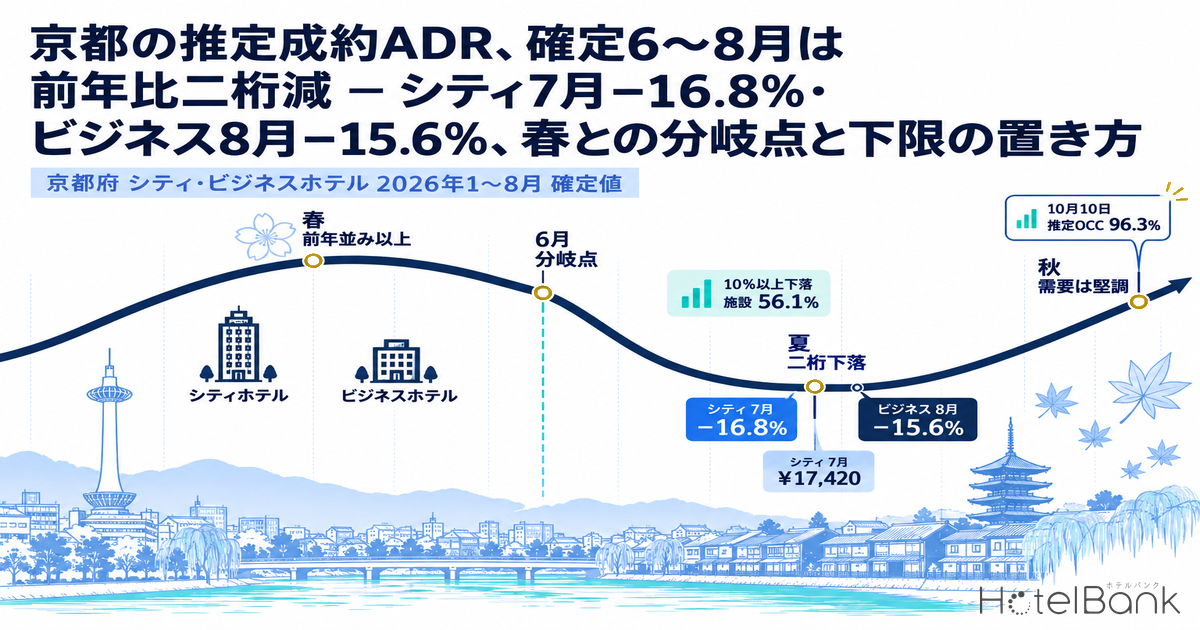
In Kyoto Prefecture’s hotel market, the year-on-year decline in estimated settled ADR (tax-exclusive equivalent) widened to double digits from June 2026. Comparing finalized figures month by month, city hotels were −14.6% in June, −16.8% in July and −10.2% in August, and business hotels −9.8% in June, −13.0% in July and −15.6% in August. By contrast, business hotels beat the prior year in all three months from March to May, and city hotels were also up in March and May. The summer decline was not confined to a few properties: comparing the same properties year on year, 56.1% of city hotels and 53.3% of business hotels landed at least 10% below the prior year in August. This article breaks down “which month it turned” using monthly finalized figures, and sets out how to rebuild price ranges and where to put the price floor in a double-digit decline.
Scope: Kyoto Prefecture city hotels N=56–59 properties and business hotels N=319–329 properties (finalized figures, January–August 2026). The price metric in this article is estimated settled ADR (the settled price level estimated from OTA and other sales data, tax-exclusive equivalent); occupancy is an estimate based on OTA-listed inventory. Both are defined at the end of the article. Data as of: September 24, 2026.
- — June was the turning point: comparing finalized figures year on year, city hotels were −16.8% in July and business hotels −15.6% in August. From March to May, both segments were broadly at or above the prior year
- — Summer also fell below 2024: city hotels in July were −14.5% against two years earlier. The summer price band itself dropped a notch, while business hotels were strong in spring, +26–27% vs 2024 in April and May
- — In August, more than half of the same properties fell by 10% or more (city 56.1%, business 53.3%). In July, however, about a quarter of properties held at or above the prior year
- — Tokyo moved the same way; Osaka is a different case: Tokyo city hotels were −20.6% in August. Osaka’s declines of double digits to over 30% reflect an Expo year in the prior-year base, so they cannot be read on the same terms as Kyoto
- — Autumn demand is strong: Saturday, October 10 reached an estimated OCC of 96–98% at 17 days out. Set price floors by season, and protect the upper price bands on high-demand dates
YoY by finalized month — June was the turning point
First, we line up the finalized figures for January–August 2026 (estimated settled ADR finalized as past months) against the finalized figures for the same months of 2025. The two segments moved through three phases.
The first was a small year-on-year dip in January–February: city hotels were −8.9% in January and −0.3% in February, and business hotels −3.7% and −3.0%. The second was a firm March–May phase. Business hotels beat the prior year at +6.7% in March, +1.3% in April and +10.5% in May, and city hotels were also positive at +2.4% in March and +3.7% in May. City hotels were −8.1% in April, but this partly reflects a high base: the April 2025 finalized figure of ¥32,625 was well above April 2024 (¥28,168), and this April’s ¥29,986 is above the April 2024 level.
The third is the double-digit decline from June onward. City hotels were ¥17,738 in June (prior year ¥20,768), ¥17,420 in July (¥20,926) and ¥19,662 in August (¥21,892). Business hotels were ¥9,616 in June (¥10,659), ¥10,230 in July (¥11,752) and ¥9,993 in August (¥11,846), with August’s −15.6% the largest decline so far this year. City hotels bottomed in July and the decline narrowed in August, while business hotels’ decline widened into August, so the bottom came in different months for the two segments. For the June picture on its own, see Kyoto Hotel ADR Falls YoY in June 2026: City -14.6%, Business -9.8%.
Source: compiled by HotelBank Editorial Team from MetroEngines Research
It is also worth comparing with two years earlier. Against the finalized figures for the same months of 2024, city hotels in 2026 were −3.8% in June, −14.5% in July and −7.0% in August, and business hotels −1.0%, −6.2% and −3.1%: all three summer months came in below 2024 levels too. Rather than the 2025 summer gains simply disappearing, the more straightforward reading is that the summer price level dropped a notch below where it had been. Spring was the opposite, however: business hotels’ ¥20,308 in April and ¥15,278 in May were 26.0% and 27.4% above the same months of 2024 (¥16,120 and ¥11,993). Prices held in the high-demand season, and the decline concentrated in the summer, which is the off-peak period.
| Stay month | City 2025 (finalized) | City 2026 (finalized) | YoY | Business 2025 (finalized) | Business 2026 (finalized) | YoY |
|---|---|---|---|---|---|---|
| Jan | ¥20,233 | ¥18,432 (N=57) | −8.9% | ¥10,148 | ¥9,773 (N=319) | −3.7% |
| Feb | ¥18,724 | ¥18,660 (N=56) | −0.3% | ¥9,941 | ¥9,641 (N=319) | −3.0% |
| Mar | ¥26,141 | ¥26,774 (N=58) | +2.4% | ¥15,904 | ¥16,969 (N=329) | +6.7% |
| Apr | ¥32,625 | ¥29,986 (N=58) | −8.1% | ¥20,038 | ¥20,308 (N=328) | +1.3% |
| May | ¥24,956 | ¥25,867 (N=57) | +3.7% | ¥13,820 | ¥15,278 (N=329) | +10.5% |
| Jun | ¥20,768 | ¥17,738 (N=57) | −14.6% | ¥10,659 | ¥9,616 (N=324) | −9.8% |
| Jul | ¥20,926 | ¥17,420 (N=58) | −16.8% | ¥11,752 | ¥10,230 (N=325) | −13.0% |
| Aug | ¥21,892 | ¥19,662 (N=59) | −10.2% | ¥11,846 | ¥9,993 (N=325) | −15.6% |
Estimated settled ADR (tax-exclusive equivalent, area median). N= is the number of properties used to calculate estimated settled ADR in each month of 2026. N for the same months of 2025 was 55–58 for city hotels and 312–320 for business hotels.
Source: compiled by HotelBank Editorial Team from MetroEngines Research
On the demand side, Japan National Tourism Organization (JNTO) estimates put visitor arrivals to Japan in July 2026 at 3,442,100 (+0.1% YoY), a record for July. By market, however, China was reported to have fallen sharply to 428,200 (−56.1% YoY). Even with the total flat, the country and region mix changed, so destinations such as Kyoto, where particular markets carry high weight, faced conditions in which summer room rates were easily affected. In addition, Kyoto City revised its accommodation tax for stays from March 1, 2026, raising the tax in steps for rates of ¥6,000 or more per person per night (¥10,000 per person per night for rates of ¥100,000 or more). Estimated settled ADR is tax-exclusive, so it does not include the tax itself, but the higher total paid by guests is worth keeping in mind when designing the upper price bands.
Comparison with other areas — Tokyo moved the same way; Osaka has a different prior-year base
To see whether Kyoto’s summer decline is specific to Kyoto, we lined up the same YoY for estimated settled ADR (finalized) against the same segments in four major areas. For city hotels, Tokyo also fell in the same direction and by the same order of magnitude, −12.8% in June, −17.1% in July and −20.6% in August, with a larger decline than Kyoto in August. For business hotels, by contrast, Tokyo’s decline stayed at −4.7 to −8.9%, and Kyoto’s −9.8 to −15.6% was about twice as wide. Fukuoka beat the prior year in all three months in both segments. In Hokkaido, business hotels were above the prior year, while city hotels went from small declines in June–July to −11.3% in August.
Osaka shows the largest declines, −24 to −26% for city hotels and −32 to −34% for business hotels, but because the Osaka-Kansai Expo ran from April to October 2025, the Expo period sits in the prior-year base, so it cannot be read on the same terms as Kyoto. Kyoto’s summer decline is less a “rebound from a particular international event” and closer to the move seen in Tokyo city hotels, where the summer room rate itself fell.
| Area | City Jun | City Jul | City Aug | City N | Business Jun | Business Jul | Business Aug | Business N |
|---|---|---|---|---|---|---|---|---|
| Kyoto | −14.6% | −16.8% | −10.2% | 57–59 | −9.8% | −13.0% | −15.6% | 324–325 |
| Tokyo | −12.8% | −17.1% | −20.6% | 107–109 | −4.7% | −5.3% | −8.9% | 913–915 |
| Osaka | −26.3% | −25.1% | −24.4% | 95–97 | −32.8% | −31.9% | −33.6% | 495–503 |
| Fukuoka | +1.2% | +3.1% | +6.2% | 40–41 | +6.5% | +3.6% | +2.2% | 340–341 |
| Hokkaido | −3.6% | −5.7% | −11.3% | 75 | +2.7% | +4.1% | +2.5% | 429–438 |
YoY between finalized figures of estimated settled ADR (tax-exclusive equivalent, area median). N= is the number of properties used in the calculation for June–August 2026. For Osaka, April–October 2025 was the period of the Osaka-Kansai Expo.
Source: compiled by HotelBank Editorial Team from MetroEngines Research
Seasonal shape year over year — the spring peak held, the summer trough deepened
Plotting the same numbers as overlaid January–December lines makes the change in this year’s shape easier to see. In 2025 there were peaks in spring (April) and autumn (October–November), and summer was a trough but held in the ¥20,000s (city). In 2026 the height of the spring peak was almost unchanged, while the June–July trough deepened to the ¥17,000s for city hotels.
Source: compiled by HotelBank Editorial Team from MetroEngines Research
The dotted lines from September onward are estimates for months not yet finalized, based on current sales, and may change. As reference levels, city hotels stand at ¥19,178 in September (N=60), ¥30,292 in October (N=60), ¥33,579 in November (N=61) and ¥22,486 in December (N=60), and business hotels at ¥11,838 in September (N=324), ¥20,807 in October (N=321), ¥24,090 in November (N=316) and ¥14,113 in December (N=306). The autumn peak is drawn at about the same height as last year, but these are forward levels based on inventory still on sale, and a straight comparison with last year’s finalized figures has to wait until each month is finalized.
How widely the decline spread among the same properties
The area median alone cannot distinguish between “a few properties cut deeply” and “many properties cut at once”. So for properties with finalized figures in the same month of both 2025 and 2026, we calculated each property’s YoY and looked at the distribution.
| Stay month | City hotels | Business hotels | ||||||||
|---|---|---|---|---|---|---|---|---|---|---|
| N | Median | Middle 50% range | Down 10% or more | At or above prior year | N | Median | Middle 50% range | Down 10% or more | At or above prior year | |
| Mar | 57 | +3.4% | −1.8% to +12.5% | 8.8% | 64.9% | 307 | +4.5% | −2.4% to +12.6% | 9.8% | 66.1% |
| Apr | 57 | +2.3% | −5.0% to +9.4% | 10.5% | 61.4% | 309 | −1.0% | −7.9% to +8.6% | 18.1% | 46.9% |
| May | 56 | +9.9% | −1.4% to +16.7% | 12.5% | 73.2% | 310 | +6.0% | −1.6% to +15.9% | 11.6% | 70.3% |
| Jun | 57 | −5.4% | −17.1% to +1.4% | 33.3% | 29.8% | 306 | −5.8% | −15.6% to +2.8% | 37.9% | 32.4% |
| Jul | 57 | −9.2% | −20.5% to +0.5% | 49.1% | 26.3% | 305 | −8.6% | −18.8% to +0.3% | 45.9% | 25.9% |
| Aug | 57 | −12.6% | −21.8% to −1.6% | 56.1% | 17.5% | 302 | −10.8% | −21.0% to +1.8% | 53.3% | 27.8% |
Same-property YoY in estimated settled ADR (finalized). N= is the number of properties with finalized figures in that month of both 2025 and 2026. The middle 50% range runs from the 25th to the 75th percentile.
Source: compiled by HotelBank Editorial Team from MetroEngines Research
In March and May, more than 60% of properties in both city and business hotels landed at or above the prior year (in April, city 61.4% and business 46.9%), and properties that fell by 10% or more stayed at around 10–20% throughout March–May. That changed completely in June. The share of properties down 10% or more rose month by month, from 33.3% in June to 49.1% in July and 56.1% in August for city hotels, and from 37.9% to 45.9% and 53.3% for business hotels. In August it exceeded half in both segments, showing that the summer decline was not concentrated in particular properties but was a downward shift in the price band of the whole market.
At the same time, a certain number of properties held at or above the prior year even in the downturn. In July, 26.3% of city hotels and 25.9% of business hotels held at or above the prior year. The middle 50% range for city hotels in July was also wide, at −20.5% to +0.5%, so even in the same market conditions, where prices landed varied widely by property. Note that the median of per-property changes (city July −9.2%) is smaller than the YoY in the area median (−16.8%) because they are aggregated differently: the former is “each property’s rate of change”, the latter “a comparison of each year’s area median”.
August outcomes by position in the distribution — optimistic, middle, pessimistic
Converting the width of the distribution into yen shows how large the differences between properties were. We take a hypothetical property that sold at the area median in August 2025 (city ¥21,892, business ¥11,846) and split its August 2026 outcome into three cases depending on whether its YoY fell at the 75th percentile, the median or the 25th percentile of the same-property distribution. The gap between the 75th and 25th percentiles is ¥4,422 per room for city hotels and ¥2,701 for business hotels. Even in the same market conditions, the summer room rate differed by around 20% depending on where a property landed.
| Case | Position in distribution | City YoY | City Aug 2026 | Business YoY | Business Aug 2026 |
|---|---|---|---|---|---|
| Optimistic | 75th percentile | −1.6% | ¥21,542 | +1.8% | ¥12,059 |
| Middle | Median | −12.6% | ¥19,134 | −10.8% | ¥10,567 |
| Pessimistic | 25th percentile | −21.8% | ¥17,120 | −21.0% | ¥9,358 |
The starting point is the area estimated settled ADR for August 2025 (finalized, median). YoY is taken at the quartiles of the same-property distribution in the table above (August: 57 city properties, 302 business properties). This is not a forecast for any individual property but an estimate that turns the width of the distribution into yen.
Source: compiled by HotelBank Editorial Team from MetroEngines Research
Current autumn demand — booking curves for an October holiday weekend and a weekday
To see whether the summer decline continues into autumn, we tracked how estimated OCC (based on OTA-listed inventory) built up for two dates in October 2026, from 45 days before the stay date to the latest observation (September 23): Saturday, October 10, the middle day of a three-day weekend, and Wednesday, October 14, a weekday. The population is 37 city hotels with 5,084 rooms and 202 business hotels with 19,808 rooms (based on listings on major booking sites).
Source: compiled by HotelBank Editorial Team from MetroEngines Research
| Stay date / segment | 45 days out | 30 days out | Latest observation | Gain since 45 days out |
|---|---|---|---|---|
| Sat Oct 10, city N=37 | 90.2% | 93.4% | 96.3% (17 days out) | +6.1pt |
| Sat Oct 10, business N=202 | 89.2% | 94.9% | 97.8% (17 days out) | +8.6pt |
| Wed Oct 14, city N=37 | 85.4% | 88.0% | 89.1% (21 days out) | +3.7pt |
| Wed Oct 14, business N=202 | 78.4% | 83.4% | 86.7% (21 days out) | +8.3pt |
Estimated OCC (based on OTA-listed inventory). Latest observation as of September 23, 2026.
Source: compiled by HotelBank Editorial Team from MetroEngines Research
At 45 days out, October 10 had already reached about 90% in both segments, and by 17 days out it had built up to 96.3% for city hotels and 97.8% for business hotels. On the weekday of October 14 too, business hotels added +8.3pt, from 78.4% at 45 days out to 86.7% at 21 days out, so weekday demand has not dried up either.
For reference, the finalized estimated OCC for August averaged 82.7% for city hotels (N=32–36 properties, 4,875–5,050 rooms) and 81.6% for business hotels (N=185–194 properties, 18,888–19,851 rooms). By day of week, Thursday and Saturday were high (business hotels: Thursday 85.3%, Saturday 85.2%) and Sunday and Monday low (77.3% and 77.5%). August was a month when estimated settled ADR was down double digits on the prior year, yet inventory absorption held in the 80% range. The summer decline may have been less “cutting prices because rooms went unsold” and more an outcome of lowering the price band to secure occupancy. If so, this is a phase in which where the floor is placed directly drives revenue.
How much a lower floor can win back — sensitivity of ADR decline × occupancy
When lowering prices to win occupancy, how far revenue (RevPAR) can be brought back to the prior-year level is largely determined by the size of the ADR cut and the prior year’s occupancy. The table below shows the occupancy needed to keep the same RevPAR as the prior year when ADR falls by each rate. With prior-year occupancy of 80%, an ADR cut of −10% can be won back at 88.9%, but the same −15.6% as business hotels’ actual August figure requires 94.8%. For properties that ran at 85% or more in the prior year, a cut of more than −15% cannot be won back even at full occupancy. Kyoto’s estimated OCC in August was in the 80% range (city 82.7%, business 81.6%), and winning back a double-digit price cut from that level would require occupancy of around 90% up to nearly full. That was a gap that is hard to fill with extra occupancy alone. The practical way to set the floor is not “how far below the prior year can we go” but to work backwards from this table: “is it within the range that occupancy can win back?”
| ADR YoY \ prior-year occupancy (assumed) | Prior year 75% | Prior year 80% | Prior year 85% | Prior year 90% |
|---|---|---|---|---|
| −5% | 78.9% | 84.2% | 89.5% | 94.7% |
| −10% | 83.3% | 88.9% | 94.4% | 100.0% |
| −15% | 88.2% | 94.1% | 100.0% | Not achievable |
| −15.6% (actual, business hotels in August) | 88.9% | 94.8% | Not achievable | Not achievable |
| −20% | 93.8% | 100.0% | Not achievable | Not achievable |
Required occupancy = prior-year occupancy ÷ (1 + ADR YoY). An estimate from the identity RevPAR = ADR × occupancy; it excludes ancillary revenue, sales-channel commissions and variable costs. Combinations above 100% are shown as “Not achievable”.
Source: compiled by HotelBank Editorial Team from MetroEngines Research
For revenue managers running city and business hotels in Kyoto — implications and action plan
1. Assume the market’s “summer price band” has dropped a notch, and set price floors by season. On finalized figures, summer 2026 in Kyoto came in below not only the prior year but also the same months of 2024: city hotels landed in the ¥17,000s in June–July and the ¥19,000s in August, and business hotels in the high ¥9,000s to the ¥10,000s. Meanwhile, March–May held at or above the prior year. With a single year-round floor, the floor sticks in summer and stops working, while in spring and autumn a floor that is too low can become the entry point for price erosion. Consider holding separate floors for the off-peak, regular and peak seasons.
2. Read your own YoY by where you sit in the market distribution. In August, comparing the same properties, 56.1% of city hotels and 53.3% of business hotels fell by 10% or more. If your decline falls within this “majority”, your outcome followed the market as a whole; if you are in the minority that held at or above the prior year (about a quarter in July), there is room to analyse why you were able to hold price and still win occupancy, and to apply it in autumn and winter.
3. Do not let the summer decline drag down prices on high-demand dates. October 10 reached an estimated OCC of 96–98% at 17 days out, and market inventory is almost fully absorbed. Rather than taking a cautious stance across the board after the summer decline, protecting the upper price bands on high-demand dates is likely to be the rational call.
4. Judge weekdays by the “speed of build-up”. Business hotels for Wednesday, October 14 added +8.3pt between 45 and 21 days out. If your own weekday curve is building at the same pace as the market, there is little need to rush into early price cuts.
| Timing | Action | Decision trigger (figures in this article) | Aim |
|---|---|---|---|
| This week | Line up your own actual ADR for June–August of 2025 and 2026 and calculate YoY | If your decline is larger than the market’s (city July −16.8%, business August −15.6%), review your summer floor settings as the top priority | Separate market factors from property-specific factors |
| This week | Check remaining rooms and prices for October holiday weekends and weekends against the market curve | At 17 days out, the market’s estimated OCC for October 10 was 96.3% for city hotels and 97.8% for business hotels. If your absorption matches or exceeds this, consider room to raise prices | Avoid leaving money on the table on high-demand dates |
| Within 2 weeks | Reset price floors by season (off-peak / regular / peak) | If your floor is a single year-round figure based on the market’s finalized summer figures (city ¥17,420–¥19,662, business ¥9,616–¥10,230), set separate floors for spring and autumn | Stop the summer level from leading to price erosion in other seasons |
| Within 2 weeks | Make it a rule to decide weekday price cuts on “absorption at 30 days out” | The market for business hotels on October 14 went from 83.4% at 30 days out to 86.7% at 21 days out. If your property has not reached the market level at 30 days out, consider reviewing your plan mix and sales channels first | Avoid cutting prices too early |
| Ahead of next month | When September’s finalized figures come out, recheck whether the summer decline is continuing into autumn | September is currently estimated at city ¥19,178 and business ¥11,838. Once finalized, judge whether the double-digit decline is continuing by comparing with the same month last year (city ¥23,624, business ¥11,992) | Run the price-range review monthly |
| Ahead of next month | Decide the price range for the December–January off-peak in advance | December’s current estimate for city hotels is ¥22,486 (prior-year finalized ¥25,300; a straight comparison must wait for month-end finalization). If the forward level stays below the prior-year finalized figure, consider re-checking the floor | Get ahead of a repeat of the summer decline pattern |
The above are perspectives for consideration based on market data and do not guarantee results for any individual property.
Summary — three yardsticks for a double-digit decline
| Yardstick | Reading for Kyoto (2026) | How to use it |
|---|---|---|
| YoY between finalized months | Double-digit declines from June. City −16.8% in July, business −15.6% in August. Spring (March–May) at or above the prior year | Tell whether the decline is a seasonal problem or a year-round one |
| Same-property distribution | In August, more than half fell by 10% or more. In July, about a quarter held at or above the prior year | Change tactics depending on whether you are in the majority or the minority |
| Current booking curves | The October holiday weekend was at 96–98% at 17 days out. Weekdays are also still building from 45 days out | Protect prices on high-demand dates and set floors by season |
Source: compiled by HotelBank Editorial Team from MetroEngines Research
On finalized figures, Kyoto’s summer was a phase in which the market’s price band itself dropped a notch. Spring strength remains, however, and current absorption for autumn is fast. “Don’t set the whole year by the summer numbers” is the starting point for price-range design in this phase.
Frequently Asked Questions
Q. How much did estimated settled ADR for Kyoto hotels fall year on year in 2026?
A. Comparing finalized figures year on year, city hotels were −14.6% in June, −16.8% in July and −10.2% in August, and business hotels −9.8% in June, −13.0% in July and −15.6% in August. From March to May, business hotels were above the prior year.
Q. Is the decline concentrated in a few properties?
A. Comparing the same properties, 56.1% of city hotels and 53.3% of business hotels were at least 10% below the prior year in August. The move spread across many properties.
Q. What does autumn demand look like?
A. At 17 days out, estimated OCC for Saturday, October 10 was high, at 96.3% for city hotels and 97.8% for business hotels. Estimated settled ADR from September onward is an estimate based on current sales, and comparison with finalized figures has to wait until each month is finalized.
Q. Is Kyoto’s decline larger than in other cities?
A. Comparing finalized figures year on year, Tokyo city hotels fell −20.6% in August, more than Kyoto (−10.2%). For business hotels, Tokyo was −4.7 to −8.9%, and Kyoto’s decline (−9.8 to −15.6%) was larger. Osaka cannot be compared on the same terms, because the 2025 Expo period sits in its prior-year base.
Q. How should the price floor be set?
A. One option is to set it separately for the off-peak, regular and peak seasons rather than as a single year-round figure. With prior-year occupancy of 80%, cutting ADR by 15.6% requires 94.8% occupancy to keep the same RevPAR as the prior year, a gap that is hard to fill with extra occupancy alone. The practical approach is to work backwards from whether the cut is within the range occupancy can win back.
About the Data
| Definition of estimated OCC | OTA-listed-inventory occupancy = 100 − 100 × rooms remaining on OTAs ÷ total rooms. The population is a fixed cohort of properties that list at least 30% of their total rooms on OTAs (the same set of properties for every stay date). It is an estimate based on how inventory sold on OTAs is absorbed, and is defined differently from actual room occupancy (rooms not listed are counted as absorbed, so it tends to read higher). |
| Booking curve | Based on observations from 45 days before the stay date to the latest. The population is 37 city hotels with 5,084 rooms and 202 business hotels with 19,808 rooms (based on listings on major booking sites). Latest observation: September 23, 2026. |
| Definition of estimated settled ADR | The settled price level (tax-exclusive equivalent) estimated from OTA and other sales data (cheapest-plan level × segment coefficient, ensemble across multiple channels). Past months are finalized figures; current and future months are estimates based on current sales. The median error against published operating results is 6.6%. |
| Scope (N) | Kyoto Prefecture. Area estimated settled ADR: city hotels 52–56 properties in 2024, 55–58 in 2025 and 56–59 in January–August 2026; business hotels 299–308 properties in 2024, 312–320 in 2025 and 319–329 in January–August 2026. Same-property YoY distribution: 56–57 city hotels and 302–310 business hotels (varies by month). August estimated OCC: 32–36 city hotels and 185–194 business hotels. |
| Data as of | Data as of: September 24, 2026. Sales and inventory change daily, so the figures in this article are a snapshot at the time of retrieval. |
References and Sources
■ Data sources
MetroEngines Research estimated settled ADR (Kyoto Prefecture city and business hotels, monthly from January 2024 to December 2026; past months are finalized figures, September 2026 onward are estimates for inventory still on sale), and finalized figures for the same properties in the same months of 2025 and 2026. Comparison areas are the same segments in Tokyo, Osaka, Fukuoka and Hokkaido. Estimated OCC is based on OTA-listed inventory: daily figures for August 2026 (monthly average and by day of week), and booking curves for the stay dates of October 10 and 14, 2026, from 45 days out to the September 23, 2026 observation. External statistics are the Japan National Tourism Organization (JNTO) estimates of visitor arrivals and Kyoto City’s material on the accommodation tax revision.
■ Calculation assumptions
YoY is the ratio between each year’s area estimated settled ADR (median). The same-property distribution is limited to properties with finalized figures in that month of both 2025 and 2026. The optimistic / middle / pessimistic table is a hypothetical that starts from the August 2025 area median and applies the YoY at the 75th percentile, median and 25th percentile of the same-property distribution; it is not a forecast for any individual property. The sensitivity table is calculated from the identity RevPAR = ADR × occupancy as required occupancy = prior-year occupancy ÷ (1 + ADR YoY), and excludes ancillary revenue, commissions and variable costs.
■ Limitations and caveats
Estimated settled ADR is an estimate from sales data, with a median error of 6.6% against published operating results. Estimated OCC counts unlisted rooms as absorbed, so it reads higher than actual room occupancy. Estimated OCC for August 2025 is not available on the same basis, so the sensitivity table uses prior-year occupancy as an axis. Because the properties used in the calculation (N) change from month to month, the area median does not match the median of same-property changes. The quartiles can move by about 0.3pt depending on the calculation method. For Osaka, April–October 2025 overlaps the Expo period, so its YoY is strongly affected by the base year. Figures from September onward are not yet finalized and may change.
| Japan National Tourism Organization (JNTO), “Visitor Arrivals to Japan (July 2026 Estimates)” (in Japanese) | https://www.jnto.go.jp/news/press/20260819_montly.html |
| Travel Voice, “Visitor arrivals to Japan in July 2026 hit a record 3.44 million for the month” (figures by market; in Japanese) | https://www.travelvoice.jp/20260819-160365 |
| Kyoto City, “Revision of the accommodation tax from March 1, 2026 formally decided” (in Japanese) | https://www.city.kyoto.lg.jp/gyozai/page/0000345893.html |