

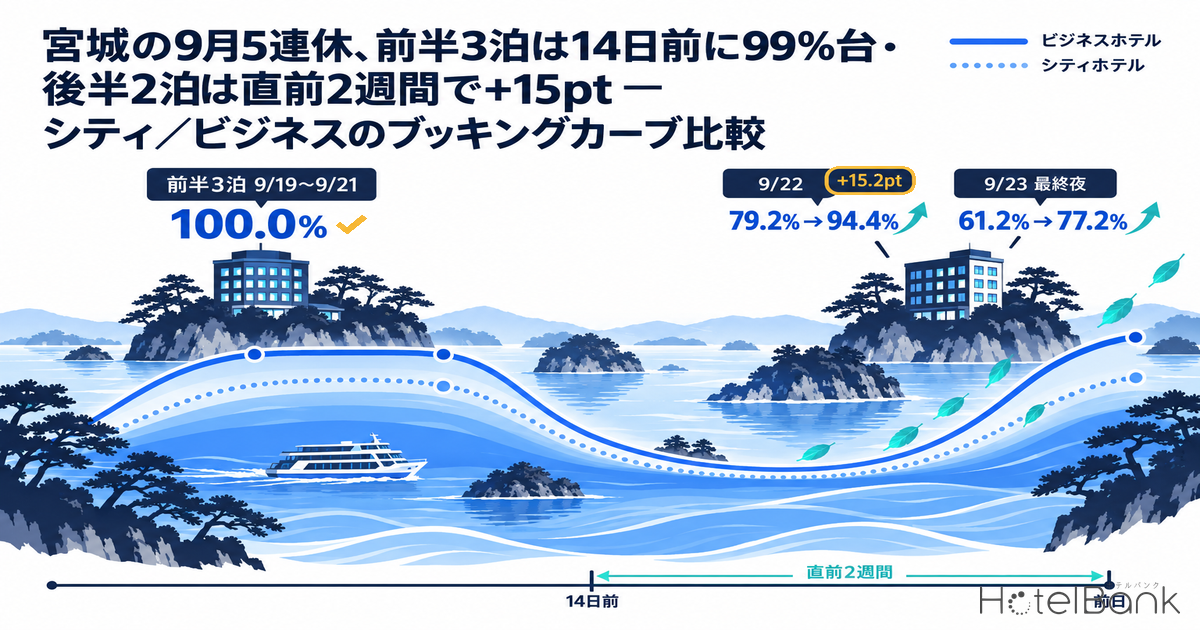
Over the five-day holiday from Saturday, September 19 to Wednesday, September 23, 2026 (Autumnal Equinox Day), hotel demand in Miyagi Prefecture split clearly into two patterns: the front half settled early, while the back half kept moving until the last minute. For business hotels (N=60–61 properties), estimated OCC (based on OTA-listed inventory) for the first three nights, Sep 19–21, reached 99.6–100.0% at 14 days before the stay date. By contrast, Sep 22 went from 79.2% at T-14 to 94.4% at T-1, and the final night, Sep 23, from 61.2% to 77.2% — gains of +15.2pt and +16.0pt in the last two weeks. For city hotels (N=10 properties), Sep 19 and Sep 20 were essentially settled at 97.3% and 98.0% as early as T-45. This article lines up the booking curves for all five nights at fixed points — T-45, T-30, T-14 and T-1 — and, alongside the current picture for the October three-day weekend, sets out how to build the back-half nights over the final one to two weeks.
Scope: Miyagi Prefecture city hotels N=10 properties (1,047 rooms), business hotels N=59–61 properties (8,540–8,915 rooms). The price metric in this article is estimated settled ADR (the achieved price level estimated from OTA and other sales data, tax-excluded equivalent); occupancy is an estimate based on OTA-listed inventory. Both are defined at the end of the article. Data as of September 24, 2026.
- — The first three nights settled by T-14: Over the September 2026 five-day holiday, estimated OCC for Miyagi business hotels (N=60–61 properties) reached 99.6–100.0% for Sep 19–21 at T-14. City hotels (N=10 properties) were at 97.3% and 98.0% for Sep 19 and Sep 20 as early as T-45
- — The last two nights gained 15pt+ in the final two weeks: Business hotels’ Sep 22 went from 79.2% at T-14 to 94.4% at T-1 (+15.2pt); the final night, Sep 23, went from 61.2% to 77.2% (+16.0pt)
- — The final night fell short of a regular Saturday: At T-1, city hotels’ Sep 23 stood at 82.5%, below the 98.3% of a regular Saturday (Sep 12), and only 20.0% of properties were sold out
- — Inventory returns after the peak: Business hotels’ first three nights fell back 2.8–3.7pt from their T-14 peak by T-1, leaving a last-minute resale window
- — The October three-day weekend shows the same sequence: As of September 23, Oct 10 stood at 97.6% (T-17), Oct 11 at 74.9% and the final night, Oct 12, at 57.6% — almost the same levels as September’s front-half and back-half types
Lining up the five nights at fixed points
In 2026, the September holidays formed a five-day run from Saturday to Wednesday: Tuesday, Sep 22, which fell between Respect for the Aged Day (Mon, Sep 21) and Autumnal Equinox Day (Wed, Sep 23), became a national bridge holiday. By stay date, the four nights of Sep 19–22 are each followed by another holiday, while only the night of Sep 23 is the “final night,” after which the next day is a workday.
The table below shows estimated OCC (based on OTA-listed inventory) for each stay date at four points: T-45, T-30, T-14 and T-1. For comparison, it also includes Sep 12, a regular non-holiday Saturday.
| City hotels (N=10 properties, 1,047 rooms) | ||||||
|---|---|---|---|---|---|---|
| Stay date | T-45 | T-30 | T-14 | T-1 | Pickup (T-45→T-1) | Sold-out share at T-1 |
| Sep 19 (Sat) | 97.3% | 98.0% | 99.1% | 99.4% | +2.1pt | 70.0% |
| Sep 20 (Sun) | 98.0% | 99.2% | 99.9% | 99.5% | +1.5pt | 80.0% |
| Sep 21 (Mon, Respect for the Aged Day) | 90.5% | 94.1% | 98.4% | 99.0% | +8.5pt | 80.0% |
| Sep 22 (Tue, bridge holiday) | 81.4% | 87.4% | 88.6% | 93.7% | +12.3pt | 40.0% |
| Sep 23 (Wed, Autumnal Equinox Day) | 73.5% | 79.9% | 78.3% | 82.5% | +9.0pt | 20.0% |
| Ref: Sep 12 (Sat) | 94.6% | 97.0% | 97.1% | 98.3% | +3.7pt | 60.0% |
| Business hotels (N=59–61 properties, 8,540–8,915 rooms) | ||||||
| Stay date | T-45 | T-30 | T-14 | T-1 | Pickup (T-45→T-1) | Sold-out share at T-1 |
| Sep 19 (Sat) | 89.6% | 98.5% | 99.6% | 95.9% | +6.3pt | 43.3% |
| Sep 20 (Sun) | 78.0% | 94.1% | 100.0% | 97.2% | +19.2pt | 50.0% |
| Sep 21 (Mon, Respect for the Aged Day) | 62.8% | 80.7% | 99.8% | 96.3% | +33.5pt | 48.3% |
| Sep 22 (Tue, bridge holiday) | 48.1% | 61.6% | 79.2% | 94.4% | +46.3pt | 29.5% |
| Sep 23 (Wed, Autumnal Equinox Day) | 42.2% | 50.5% | 61.2% | 77.2% | +35.0pt | 1.6% |
| Ref: Sep 12 (Sat) | 86.6% | 89.8% | 91.1% | 94.5% | +7.9pt | 27.1% |
Sold-out share = share of properties with no listed inventory confirmed on OTAs etc. (estimate). Source: MetroEngines Research; compiled by HotelBank Editorial Team
City hotels’ first two nights were already in the high-97% range at T-45, and subsequent pickup was limited to +1.5–2.1pt. Business hotels, by contrast, started from lower levels at T-45 and grew substantially from there. Sep 21 rose +37.0pt from 62.8% at T-45 to 99.8% at T-14, and Sep 22 rose +46.3pt from 48.1% at T-45 to 94.4% at T-1 — the largest pickup of the five nights.
Another feature is how much the end point differed night by night within the same holiday. At T-1, business hotels’ first three nights and Sep 22 lined up at 94.4–97.2%, whereas the final night, Sep 23, was at 77.2%. Among city hotels, too, Sep 23 was at 82.5%, below a regular Saturday (Sep 12, 98.3%). The final night of a holiday clearly takes on the character of the night before a return to the working week. The movement of the last two days of this same five-day holiday, tracked from a fixed point at T-47, is covered in Silver Week 2026 Back Half at T-47.
Type 1, “early settlement”: Sep 19–21 reached the 99% range at T-14
Overlaying the booking curves for the five nights at business hotels shows the difference between the first three nights and the last two clearly. Sep 19 was at 98.5% at T-30; Sep 20 went from 94.1% at T-30 to 100.0% at T-14; and Sep 21 from 80.7% at T-30 to 99.8% at T-14 — all three front-half nights reached near-full levels by T-14.
Miyagi Prefecture business hotels, N=60–61 properties, 8,815–8,915 rooms. Source: MetroEngines Research; compiled by HotelBank Editorial Team
A point worth noting is that the three front-half nights, after peaking at T-14, slipped back slightly by T-1. Sep 19 went from 99.6% at T-14 to 95.9% at T-1 (−3.7pt), Sep 20 from 100.0% to 97.2% (−2.8pt), and Sep 21 from 99.8% to 96.3% (−3.5pt). This looks like listed inventory reappearing due to cancellations and similar factors, and the sold-out share for Sep 20 also fell from 100.0% at T-14 to 50.0% at T-1. The front-half nights were not simply “sold out at T-14 and done” — there remained a phase of reselling rooms that came back at the last minute.
City hotels’ first two nights settled even earlier, already in the high-97% range at T-45. Sep 21 (Respect for the Aged Day) grew from 90.5% at T-45 to 98.4% at T-14 and 99.0% at T-1, so for city hotels too, the third consecutive night settled around T-14, as it did for business hotels.
Type 2, “late build”: Sep 22 and Sep 23 kept growing until T-1
The last two nights looked completely different. Business hotels’ Sep 22 kept growing to the end — 79.2% at T-14, 86.0% at T-7 and 94.4% at T-1 — for a pickup of +15.2pt from T-14 to T-1. The final night, Sep 23, also went from 61.2% at T-14 to 65.5% at T-7 and 77.2% at T-1, a gain of +16.0pt in the last two weeks. Of Sep 23’s total pickup from T-45 to T-1 (+35.0pt), nearly half came in the final 14 days.
Miyagi Prefecture city hotels, N=10 properties, 1,047 rooms. Source: MetroEngines Research; compiled by HotelBank Editorial Team
The same shape appears among city hotels. Sep 22 rose from 81.4% at T-45 to 87.4% at T-30, paused at 88.6% at T-14, then grew again to 93.7% at T-1. Sep 23 dipped slightly from 79.9% at T-30 to 78.3% at T-14 and landed at 82.5% at T-1. For city hotels, the final night barely grew beyond its T-30 level.
The difference between the front-half and back-half types is not only about the strength of demand but also about “when it gets decided.” Front-half nights fill early, so the time to set prices also comes early. Back-half nights are decided by movement in the final two weeks, leaving room to adjust price and inventory right up to the end. Running all five nights off a single rate table makes it easy to miss this difference in timing. Late pickup shaping the end point also appeared as a difference between property types in the booking curve for Miyagi’s Obon night of Aug 15.
Price context: estimated settled ADR exceeds the prior year in closed months
It is also worth checking the pricing backdrop. In August 2026, the most recent closed month, Miyagi Prefecture’s estimated settled ADR was ¥10,900 for city hotels (N=21 properties) and ¥8,600 for business hotels (N=142 properties). Compared with ¥10,100 and ¥8,100 in the same month of the prior year (August 2025, closed figures), that is +7.7% and +6.5% respectively (changes calculated from values to the yen). Business hotels exceeded the prior-year month in every closed month from January to August 2026, and city hotels did so in six of the eight months.
Miyagi Prefecture city hotels N=20–21 properties, business hotels N=135–143 properties. September 2026 onward are estimates based on current sales (dotted lines) and may change. Source: MetroEngines Research; compiled by HotelBank Editorial Team
For September 2026, which includes the holiday, estimates based on current sales put city hotels at ¥13,400 (N=21 properties) and business hotels at ¥10,900 (N=137 properties). These are above the prior-year September closed figures (city ¥8,700, business ¥7,300), but estimates should not be compared directly with closed figures; the year-on-year change needs to be confirmed once the month closes. Either way, the strength of demand that took the first three nights into the 99% range in estimated OCC suggests this was a period in which rate could also be pursued.
Applying it to the next holiday: the same sequence for the October three-day weekend
These two types are not unique to September. We lined up estimated OCC for Miyagi business hotels (N=61 properties, 8,915 rooms) for the October three-day weekend (Sat, Oct 10 to Mon, Oct 12, Sports Day) as of September 23 against the nights in the same position of the September five-day holiday at the same number of days out.
| Position in holiday | Sep five-day holiday (business) | Est. OCC at same point | Oct three-day weekend (business) | Est. OCC as of Sep 23 |
|---|---|---|---|---|
| First night | Sep 19 (Sat) | 99.8% (T-17) | Oct 10 (Sat) | 97.6% (T-17) |
| Night before final night (next day also a holiday) | Sep 22 (Tue) | 73.7% (T-18) | Oct 11 (Sun) | 74.9% (T-18) |
| Final night (next day is a workday) | Sep 23 (Wed) | 58.1% (T-19) | Oct 12 (Mon, Sports Day) | 57.6% (T-19) |
October three-day weekend figures are estimates based on current sales and may change. Source: MetroEngines Research; compiled by HotelBank Editorial Team
The first night, Oct 10, is already at a front-half-type level of 97.6% at T-17, while Oct 11, followed by another holiday, stands at 74.9% and the final night, Oct 12, at 57.6%. These are almost the same as the September five-day holiday’s night before the final night (Sep 22, 73.7% at T-18) and final night (Sep 23, 58.1% at T-19), so the front-half/back-half sequence is repeating itself. How to apply September’s experience to October’s night before the final night and final night is the practical theme for the next two weeks.
For revenue managers at Miyagi city and business hotels — implications and action plan
1. Treat a holiday not as “one block of five nights” but as “a combination of front-half and back-half types”
In the September five-day holiday, business hotels’ first three nights reached 99.6–100.0% at T-14, while the final night, Sep 23, was at only 77.2% even at T-1. Within the same holiday, the right time to set prices differs night by night. Managing your own holiday calendar by splitting each night into “nights that settle early” and “nights that settle late” makes it easier to organize when to make decisions.
2. On front-half nights, resale “after selling out” is where it counts
For the first three nights, estimated OCC fell back 2.8–3.7pt from the T-14 peak by T-1. It is worth checking inventory movements on the day before and the day of arrival to make sure rooms that come back at the last minute are not left empty.
3. On back-half nights, prepare price tiers that assume pickup in the final two weeks
Business hotels’ Sep 22 and Sep 23 grew by more than 15pt between T-14 and T-1. Even if your back-half nights are not filled at T-14, the market follows a pattern that moves from there. Rather than cutting prices sharply early, preparing price tiers that can absorb late demand makes it easier to secure both rate and occupancy.
4. Work from a backdrop in which estimated settled ADR in closed months exceeds the prior year
August 2026 closed figures were up year on year by +7.7% for city hotels and +6.5% for business hotels. Amid strong front-half demand, there is room to check whether nights are filling early at prices still set at prior-year levels.
| Timeline | Action | Decision trigger (figures from this article) | Objective |
|---|---|---|---|
| T-45 | Sort each night of the holiday into “front-half type” or “back-half type,” and lock in pricing for front-half nights first | Compare your own pace at the same point against the market pattern: city hotels’ first two nights at 97–98% at T-45, business hotels at 94–98% by T-30 | Avoid early discounting on front-half nights and protect rate |
| T-45 | Set consistent conditions for multi-night and extended stays that include the final night (last day of the holiday) | Is the pattern where the business-hotel final night stalled at 42.2% at T-45 and 50.5% at T-30 also showing at your property? | Build an early path that channels strong front-half demand into the final night |
| T-30 | Review front-half rate increases and single-night pricing for the night before the final night separately | If your front-half nights have reached the market’s T-30 level (business 94.1–98.5%), there is room to raise rates; if the night before the final night is around 61.6%, consider holding rates | Capture rate on the front half while leaving headroom for back-half growth |
| T-14 | Rebuild inventory and pricing for the night before the final night and the final night | Benchmark your pace against the pattern in which business hotels grew +15–16pt late: Sep 22 from 79.2% at T-14 to 94.4% at T-1, Sep 23 from 61.2% to 77.2% | Have price tiers ready so late demand is not left on the table |
| Last minute (T-3 to T-1) | Resell inventory that returns on front-half nights | Is the pattern where business-hotel front-half nights fell back from the 99% range at T-14 to 95.9–97.2% at T-1 also occurring at your property? | Do not leave rooms returned by cancellations etc. unsold |
| After the holiday | Record the T-45→T-1 pickup for each of the five nights and use it as the baseline for the next holiday | Keep your own figures in the same format as Table 1 (T-45, T-30, T-14, T-1) | Identify front-half vs back-half types earlier for the October and November holidays |
Decision trigger figures are market estimates for Miyagi Prefecture from this article. Source: MetroEngines Research; compiled by HotelBank Editorial Team
The October three-day weekend is now entering the period inside T-14. As of September 23, the night before the final night (Oct 11) at 74.9% and the final night (Oct 12) at 57.6% sit in almost the same position as the last two nights of the September five-day holiday. It is worth tracking, against your own booking pace, whether they follow the same pattern of growing over the final two weeks as in September.
Summary
Lining up Miyagi Prefecture’s September 2026 five-day holiday at fixed points reveals three “yardsticks” for reading holiday demand.
| Yardstick | Benchmark seen in the September five-day holiday | How to use it |
|---|---|---|
| Timing of settlement | City hotels’ first two nights at 97–98% at T-45; business hotels’ first three nights in the 99% range at T-14 | Decide when to lock in front-half pricing |
| Late pickup | Business hotels’ Sep 22 and Sep 23 gained +15.2pt and +16.0pt from T-14 to T-1 | Decide how much inventory and which price tiers to hold back after T-14 for back-half nights |
| Pullback after peak | Business hotels’ first three nights fell back 2.8–3.7pt from their T-14 peak by T-1 | Prepare for last-minute resale |
Source: MetroEngines Research; compiled by HotelBank Editorial Team
Splitting holiday nights by “when they get decided,” and viewing them from three angles — rate on the front half, late growth on the back half, and resale after the peak — is an approach that can be applied directly to the October and November holidays.
Frequently Asked Questions
Q. Which night filled earliest during Miyagi’s September five-day holiday?
A. In the September 2026 five-day holiday, city hotels (N=10 properties) had already reached estimated OCC of 97.3% and 98.0% for Sep 19 and Sep 20 at T-45, making the first two nights the earliest to fill. Among business hotels (N=60–61 properties), the three nights of Sep 19–21 reached 99.6–100.0% at T-14.
Q. How late did bookings keep growing for the back-half nights?
A. At business hotels, Sep 22 rose from 79.2% at T-14 to 94.4% at T-1, and Sep 23 from 61.2% to 77.2%, each gaining more than 15pt in the two weeks before the stay date. The back-half nights followed a pattern that left room to rework inventory and pricing right up to the end.
Q. Was there any movement on the front-half nights after they sold out?
A. Yes. Business hotels’ first three nights reached 99.6–100.0% at T-14, then fell back 2.8–3.7pt to 95.9–97.2% by T-1. For Sep 20, the sold-out share also dropped from 100.0% at T-14 to 50.0% at T-1, leaving a last-minute phase of reselling rooms that returned through cancellations and similar factors.
Q. How did the final night of the holiday compare with a regular weekend?
A. In estimated OCC at T-1, city hotels’ Sep 23 was at 82.5% and business hotels’ at 77.2%. Both were below a regular Saturday, Sep 12 (city 98.3%, business 94.5%), reflecting the character of a night followed by a return to the working week.
Q. Is the same pattern appearing for the October three-day weekend?
A. As of September 23, Miyagi business hotels (N=61 properties) stood at 97.6% for Oct 10, 74.9% for Oct 11 and 57.6% for Oct 12. Compared at the same number of days out, these are almost the same as the September five-day holiday’s first night, night before the final night and final night, so the front-half/back-half sequence is repeating.
About the Data
- Definition of estimated OCC (based on OTA-listed inventory): OTA-listed-inventory occupancy = 100 − 100 × OTA-listed remaining rooms ÷ total rooms. The sample is a fixed cohort of properties that list at least 30% of their total rooms on OTAs (the same set of properties for each stay date). It is an estimate based on the sell-through of inventory sold on OTAs and is defined differently from actual room occupancy (it tends to read high because unlisted rooms are counted as consumed).
- Booking curves: Based on observations from 45 days before the stay date to the latest available. “T-1” in this article is the observation one day before the stay date. Stay dates covered: September 12 and 19–23, and October 10–12, 2026.
- Estimated settled ADR: The achieved price level (tax-excluded equivalent) estimated from OTA and other sales data (lowest-plan level × property-type coefficient, ensemble across multiple channels). Past months are closed figures; current and future months are estimates based on current sales. Median error of 6.6% against published operating results.
- Sample size N: For estimated OCC, city hotels N=10 properties (1,047 rooms) and business hotels N=59–61 properties (8,540–8,915 rooms, varying by stay date), both based on listings on major booking sites. For estimated settled ADR, city hotels N=20–21 properties and business hotels N=135–143 properties (varying by month).
- Data as of: September 24, 2026. Sales status and inventory change daily, so the figures in this article are a snapshot at the time of retrieval.
References and Sources
■ Data sources
Booking curves of estimated OCC (based on OTA-listed inventory) from MetroEngines Research. For Miyagi Prefecture city hotels (N=10 properties, 1,047 rooms) and business hotels (N=59–61 properties, 8,540–8,915 rooms): daily observations from T-45 to T-1 for stay dates September 12 and 19–23, 2026, and observations up to September 23, 2026 for October 10–12. Prices are MetroEngines Research estimated settled ADR (Miyagi Prefecture city and business hotels, monthly from January 2025 to December 2026; closed figures through August 2026, on-sale estimates from September onward).
■ Calculation assumptions
Estimated OCC = 100 − 100 × OTA-listed remaining rooms ÷ total rooms. Using a fixed cohort tracking the same set of properties for each stay date, we calculated four fixed points — T-45, T-30, T-14 and T-1 — and “pickup” (the difference between fixed points, in pt). The sold-out share is the share of properties with no listed inventory confirmed. The comparison with the October three-day weekend aligns nights in the same position of the September five-day holiday at the same number of days out (T-17 to T-19). Year-on-year changes in estimated settled ADR compare closed months only, with rates of change calculated from values to the yen.
■ Limitations
Estimated OCC is based on the sell-through of inventory sold on OTAs and reads higher than actual room occupancy because unlisted rooms are counted as consumed. The city hotel sample is small at 10 properties, so a single property adding or removing inventory can move the figure by several points. The post-peak pullback may include re-listed inventory as well as cancellations. Estimated settled ADR is an estimate from sales data, with a median error of 6.6% against published operating results. Estimated settled ADR from September 2026 onward and estimated OCC for the October three-day weekend are not yet final and may change.