

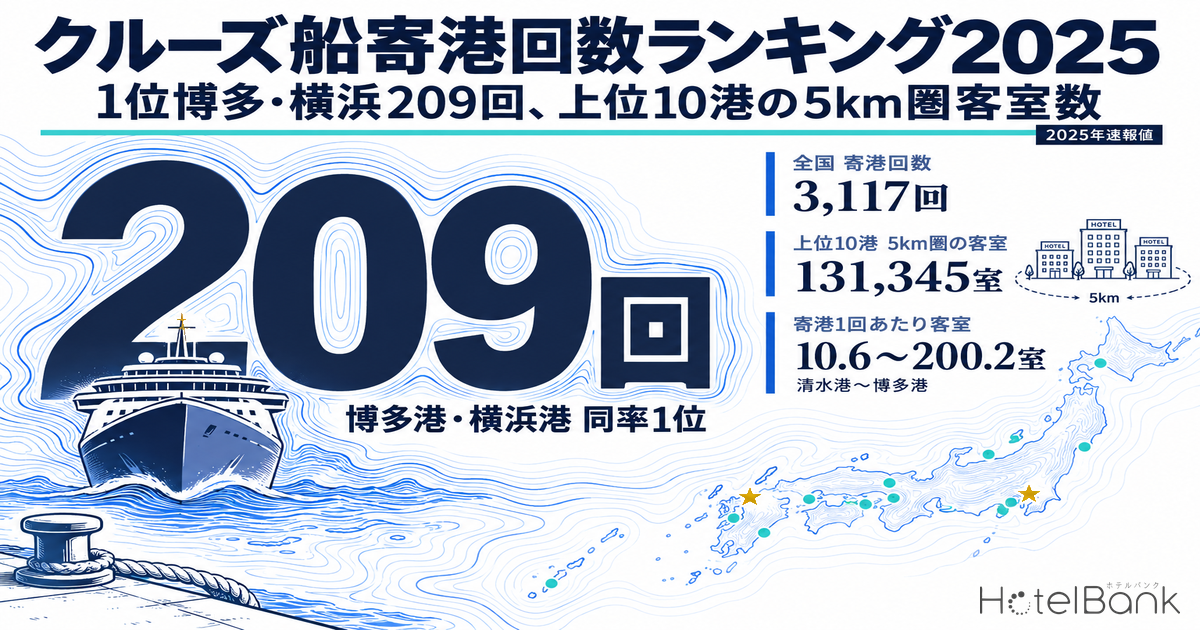
According to “Inbound Cruise Passengers and Cruise Ship Port Calls (2025 Preliminary Figures)”, published by Japan’s Ministry of Land, Infrastructure, Transport and Tourism (MLIT) on February 20, 2026, cruise ships made 3,117 calls at Japanese ports in 2025. That is a record, above the pre-COVID peak of 2,930 calls in 2018. By port, Hakata and Yokohama tied for first place with 209 calls each, followed by Naha (205), Nagasaki (198) and Kobe (142). But when a ship arrives at one of these ports, how many hotel rooms are there to receive its passengers? This article measures the room count within a 5km radius of the main cruise berth at each of the top 10 ports, then re-ranks the 10 ports on a single yardstick: room stock per port call.
Metric Definitions Used in This Article
- Port calls: MLIT Ports and Harbours Bureau’s 2025 preliminary figures, compiled from interviews with port management bodies. Covers cruise ships with at least one overnight stay on board; day cruises are excluded. In addition to ports under the Port and Harbor Act, calls where the ship anchored offshore and passengers landed by tender, and calls at fishing ports, are included. As preliminary figures, they may be revised.
- Room stock: Total rooms at properties located within a 5km radius of each port’s main berth and confirmed as listed on major booking sites in the latest three months (June–August 2026). Properties not confirmed as listed are excluded. Port calls are counted for the whole port (including multiple piers), whereas room stock is counted within a circle drawn from a single main berth, so the two spatial units do not match exactly.
- Room stock per port call: The room stock above divided by the number of 2025 port calls. It normalizes a port’s room supply against how often ships call there. This is a metric we defined for this article.
- ADR (average daily rate): An estimated settled rate (tax-excluded equivalent), calculated by applying a property-type adjustment factor to the lowest published plan price on OTAs and similar channels (two guests per room, price per room, tax included). Checked against property-level results disclosed by listed hotel REITs (91 properties, latest three months), the median error is about 7%. These are estimates and differ from each property’s actual settled prices and accounting figures. Area-level ADR is the median of the properties covered (the level of a typical property in the area); in this article, monthly values for the municipality where each port is located are averaged with equal weight.
- Data sources: MLIT, “Inbound Cruise Passengers and Cruise Ship Port Calls (2025 Preliminary Figures)” / MetroEngines Research
- — Cruise ship port calls in 2025 totaled 3,117 (2,352 by foreign cruise lines, 765 by Japanese cruise lines), about 106% of the 2018 peak of 2,930. Inbound cruise passengers numbered 1.767 million, about 70% of the 2017 peak.
- — By port, Hakata and Yokohama tied for first with 209 calls each, followed by Naha 205, Nagasaki 198, Kobe 142, Ishigaki 130, Kagoshima 129, Sasebo 128, Hiroshima 106 and Shimizu 105. The top 10 ports account for 1,561 calls, or 50.1% of the total.
- — Room stock within 5km of the top 10 ports totals 1,610 properties and 131,345 rooms. Per port call, it ranges from 10.6 rooms at Shimizu to 200.2 rooms at Hakata, a gap of about 19x (10-port average: 84.1 rooms).
- — At Yokohama and Kobe, which serve as embarkation ports for Japanese cruise lines, 88.9% and 86.8% of rooms in the radius are in properties with 100+ rooms, and the average property size is large at 154.8 and 127.7 rooms. Their supply is well suited to taking group room blocks.
- — For January–August 2026, estimated settled ADR is highest in Hakata Ward at about ¥14,300 among the 10 cities, 2.1x the lowest, Kagoshima City (about ¥6,700). The strongest year-on-year gains were Naha +15.9%, Hakata Ward +12.8% and Ishigaki +9.7%.
Source: Compiled by HotelBank Editorial Team from MLIT, “Inbound Cruise Passengers and Cruise Ship Port Calls (2025 Preliminary Figures)” (published February 20, 2026) and MetroEngines Research (room stock: 1,610 properties / 131,345 rooms confirmed as listed in June–August 2026)
3,117 Calls, 106% of the 2018 Peak — Passenger Numbers Are Still Recovering
Of the 3,117 port calls in 2025, 2,352 were made by ships operated by foreign cruise lines and 765 by ships operated by Japanese cruise lines. Foreign-line calls rose about 1.2x year on year to about 117% of their pre-COVID peak in 2017 (2,013 calls). Japanese-line calls rose about 1.4x year on year but are still only about 75% of the 1,017 calls in 2018, so this segment is still recovering.
Inbound cruise passengers, meanwhile, numbered 1.767 million. That is about 1.2x the previous year but only about 70% of the 2017 peak of 2.529 million, so passenger numbers are recovering more slowly than port calls. The gap means that more of the calls are by ships carrying fewer passengers each. MLIT’s materials note that casual-class ships made up the majority before COVID, while since COVID, calls by smaller premium, luxury and expedition-class ships have increased, as have calls at regional ports. In 2025, the breakdown by class was 1,377 casual-class calls and 975 across the three higher-priced classes combined.
The government’s 2025 targets were 2.5 million inbound cruise passengers, more than 2,000 port calls by foreign cruise ships, and 100 ports receiving foreign cruise ships. Port calls reached 2,352 and beat the target, but passengers (1.767 million) and ports (93) still have room to grow. In other words, the number of calls has come back first, while passenger volume and geographic breadth are catching up behind it. From the lodging side, demand moves in that order: calls rise at a port first, then passenger numbers follow.
Source: Compiled by HotelBank Editorial Team from MLIT, “Inbound Cruise Passengers and Cruise Ship Port Calls (2025 Preliminary Figures)”
Top 10 Ports by Port Calls — Hakata and Yokohama Share First Place at 209
By port (foreign and Japanese cruise lines combined), Hakata and Yokohama tied for first place with 209 calls each. Hakata was also first the year before (204 calls) and has held the top spot. Yokohama rose from fourth place (146 calls) with 63 more calls, the largest increase among the top 10. Third-place Naha had 205 calls (2nd the previous year, 175), fourth-place Nagasaki 198 (3rd, 160) and fifth-place Kobe 142 (7th, 95).
The rankings change when you split by the nationality of the cruise line. Counting only foreign cruise lines, Nagasaki is first with 194 calls, Hakata second with 191 and Naha third with 187, while Yokohama drops to seventh with 105. Counting only Japanese cruise lines, Yokohama is first with 104 calls and Kobe third with 43. Yokohama’s 209 calls reflect heavy volumes of both foreign transit calls and Japanese embarkation/disembarkation (turnaround) calls, so its demand is very different in character from Nagasaki’s 198.
| Rank | Port | Location | 2025 port calls | Foreign lines | Japanese lines | 2024 | Change |
|---|---|---|---|---|---|---|---|
| 1 | Hakata | Fukuoka City, Fukuoka | 209 | 191 | 18 | 204 (1st) | +5 |
| 1 | Yokohama | Yokohama City, Kanagawa | 209 | 105 | 104 | 146 (4th) | +63 |
| 3 | Naha | Naha City, Okinawa | 205 | 187 | 18 | 175 (2nd) | +30 |
| 4 | Nagasaki | Nagasaki City, Nagasaki | 198 | 194 | 4 | 160 (3rd) | +38 |
| 5 | Kobe | Kobe City, Hyogo | 142 | 99 | 43 | 95 (7th) | +47 |
| 6 | Ishigaki | Ishigaki City, Okinawa | 130 | 121 | 9 | 120 (5th) | +10 |
| 7 | Kagoshima | Kagoshima City, Kagoshima | 129 | 122 | 7 | 105 (6th) | +24 |
| 8 | Sasebo | Sasebo City, Nagasaki | 128 | 122 | 6 | 72 (10th) | +56 |
| 9 | Hiroshima | Hiroshima City, Hiroshima | 106 | 100 | 6 | — | — |
| 10 | Shimizu | Shizuoka City, Shizuoka | 105 | 99 | 6 | 87 (9th) | +18 |
| — | Top 10 total | — | 1,561 | 1,340 | 221 | — | — |
| — | Japan total | — | 3,117 | 2,352 | 765 | 2,472 | +645 |
Source: Compiled by HotelBank Editorial Team from MLIT, “Inbound Cruise Passengers and Cruise Ship Port Calls (2025 Preliminary Figures)”. “Japanese lines” is total calls minus foreign-line calls (for Hakata, Yokohama, Naha and Kobe it matches the Japanese-line figures published in the same source). Hiroshima was outside the 2024 top 10, so no change is shown.
The top 10 ports total 1,561 calls, 50.1% of Japan’s 3,117. Put the other way, the other half is spread across ports outside the top 10: foreign cruise ships called at 93 ports in all. The defining feature of 2025 is that concentration at the top and a wider spread of ports are happening at the same time.
Measuring the Rooms Within 5km of the Top 10 Ports
Next, we look at how many rooms are within reach of passengers and crew, on foot or by a short ride, when a ship arrives at each port. Taking each port’s main cruise berth as the center, we drew a 5km radius and added up the rooms of properties confirmed as listed on major booking sites in the latest three months. The 10 ports total 1,610 properties and 131,345 rooms. We set the radius at 5km to capture the realistic catchment, including taxi and shuttle trips, rather than only what embarking and disembarking passengers can reach on foot within about 1,500m of the terminal. Our earlier piece, Record 3,117 Cruise Calls: Hotel Capacity at Japan’s Top 10 Ports, counted rooms across each port’s whole city; this article narrows the count to the area around the berth, so its figures are not directly comparable with that article’s.
Source: Compiled by HotelBank Editorial Team from MetroEngines Research (circle size shows rooms within a 5km radius)
| Port | Port calls | Properties within 5km | Rooms within 5km | Avg rooms per property | Rooms in 100+ room properties | Share | Rooms per port call |
|---|---|---|---|---|---|---|---|
| Hakata | 209 | 547 | 41,837 | 76.5 | 33,862 | 80.9% | 200.2 |
| Naha | 205 | 319 | 23,723 | 74.4 | 17,376 | 73.2% | 115.7 |
| Yokohama | 209 | 127 | 19,660 | 154.8 | 17,481 | 88.9% | 94.1 |
| Kobe | 142 | 103 | 13,150 | 127.7 | 11,419 | 86.8% | 92.6 |
| Hiroshima | 106 | 104 | 8,549 | 82.2 | 7,021 | 82.1% | 80.7 |
| Kagoshima | 129 | 92 | 9,148 | 99.4 | 6,813 | 74.5% | 70.9 |
| Nagasaki | 198 | 128 | 7,456 | 58.2 | 5,284 | 70.9% | 37.7 |
| Ishigaki | 130 | 143 | 4,685 | 32.8 | 2,090 | 44.6% | 36.0 |
| Sasebo | 128 | 30 | 2,024 | 67.5 | 1,291 | 63.8% | 15.8 |
| Shimizu | 105 | 17 | 1,113 | 65.5 | 653 | 58.7% | 10.6 |
| 10-port total | 1,561 | 1,610 | 131,345 | 81.6 | 103,290 | 78.6% | 84.1 |
Source: Compiled by HotelBank Editorial Team from MetroEngines Research (5km radius; 1,610 properties confirmed as listed in the latest three months)
In absolute terms, Hakata’s 41,837 rooms stand far above the rest, 1.8x second-place Naha’s 23,723. Hakata’s radius takes in the whole city center of Fukuoka’s Hakata and Chuo wards, so the hotel clusters around Tenjin and Hakata Station act as its catchment. The largest property in the radius is Hilton Fukuoka Sea Hawk (ヒルトン福岡シーホーク) with 1,052 rooms (Hilton’s published figure), a single property with nearly as many rooms as one ship’s passenger load.
By contrast, Shimizu’s radius holds just 17 properties and 1,113 rooms, and Sasebo’s 30 properties and 2,024 rooms. At both ports, lodging is concentrated within walking distance of the JR station, and with so few properties each one carries more weight. The largest properties in each radius are Toyoko Inn Shizuoka Shimizu-eki Mae (東横INN静岡清水駅前, 246 rooms) and Toyoko Inn Sasebo-eki Mae (東横INN佐世保駅前, 272 rooms), both next to the station and well placed on the routes embarking and disembarking passengers take.
Source: Compiled by HotelBank Editorial Team from MLIT, “Inbound Cruise Passengers and Cruise Ship Port Calls (2025 Preliminary Figures)” / MetroEngines Research
Room Stock per Port Call Ranges from 10.6 to 200.2 — a 19x Gap
Because absolute room counts are driven by city size, we normalize by call frequency. Dividing room stock by 2025 port calls gives “room stock per port call”. Hakata is the deepest at 200.2 rooms, followed by Naha 115.7, Yokohama 94.1, Kobe 92.6, Hiroshima 80.7 and Kagoshima 70.9. The 10-port average is 84.1 rooms.
At the bottom are Shimizu at 10.6 rooms, Sasebo 15.8, Ishigaki 36.0 and Nagasaki 37.7. The gap between the deepest (Hakata) and the thinnest (Shimizu) is about 19x. The key point is that a low figure does not by itself mean the port’s lodging is failing to cope. Transit calls by foreign cruise ships are mostly day calls, arriving in the morning and leaving in the evening, so they generate little overnight demand to begin with. Foreign-ship calls at Shimizu (99), Sasebo (122) and Nagasaki (194) currently benefit the local economy mainly through shore excursions and spending in town.
In other words, these four ports already have plenty of calls, and converting even a small share of them into overnight stays would move lodging demand. The thinner a port’s room stock per call, the bigger the impact one night of demand has on room supply and demand. Conversely, deep ports like Hakata and Naha have spare capacity to absorb group pre- and post-cruise stays and even crew accommodation.
Source: Compiled by HotelBank Editorial Team from MLIT, “Inbound Cruise Passengers and Cruise Ship Port Calls (2025 Preliminary Figures)” / MetroEngines Research
Property Size — At Turnaround Ports, Rooms Are Concentrated in 100+ Room Properties
Beyond the volume of rooms, it is worth looking at how they are divided up. Pre- and post-cruise stays and crew accommodation often move in blocks of dozens of rooms per property, so a few large properties handle them more easily than many small ones.
Average rooms per property are largest at Yokohama (154.8), Kobe (127.7) and Kagoshima (99.4). By the share of rooms in properties with 100+ rooms, the leaders are Yokohama 88.9%, Kobe 86.8%, Hiroshima 82.1% and Hakata 80.9%. The largest property in Yokohama’s radius is APA Hotel & Resort Yokohama Bay Tower (アパホテル&リゾート〈横浜ベイタワー〉) with 2,311 rooms, large enough to take a big block on its own. In Kobe’s radius, the largest is Kobe Portopia Hotel (神戸ポートピアホテル, 737 rooms).
Ishigaki, on the other hand, averages 32.8 rooms per property, with only 44.6% of rooms in 100+ room properties, the most fragmented supply of the 10 ports. Ishigaki Island has a wide variety of lodging, including guesthouses (minshuku), small hotels and condominiums, and its 143 properties in the radius outnumber Yokohama’s 127. That mix gives individual travelers plenty of options, but group blocks have to be handled differently than at ports built around large properties. The largest property in Ishigaki’s radius is ANA InterContinental Ishigaki Resort (ANAインターコンチネンタル石垣リゾート, 458 rooms).
Ports with deep spare capacity
Hakata 200.2 rooms, Naha 115.7 rooms. The hotel clusters of the city center fall entirely within the radius, able to absorb both group pre- and post-cruise stays and crew accommodation. Large properties hold 70–80% of rooms.
Turnaround-port supply
Yokohama and Kobe. With 104 and 43 Japanese-line calls, 88.9% and 86.8% of rooms in the radius are in 100+ room properties. The property sizes suit block demand from embarkation and disembarkation.
Ports with the most room to convert calls into stays
Shimizu 10.6, Sasebo 15.8, Nagasaki 37.7 rooms. Foreign-ship calls already number 99–194. If even part of those transit calls turn into overnight stays, the effect on room supply and demand would be large.
Hotel Rates in Port Cities — Hakata Ward Highest at About ¥14,300, 2.1x the Lowest
Next, we compare estimated settled ADR in the municipalities where the top 10 ports are located. The unit is the ward containing the port where applicable (Hakata = Hakata Ward, Fukuoka; Yokohama = Naka Ward, Yokohama; Kobe = Chuo Ward, Kobe; Hiroshima = Minami Ward, Hiroshima; Shimizu = Shimizu Ward, Shizuoka), comparing the same period in January–August 2025 and January–August 2026.
For January–August 2026, the highest level is Hakata Ward at about ¥14,300. It is followed by Ishigaki at about ¥11,900, Yokohama Naka Ward at about ¥11,500, Kobe Chuo Ward at about ¥11,200 and Naha at about ¥10,600. The lowest, Kagoshima City, is about ¥6,700, a 2.1x gap with Hakata Ward. The strongest year-on-year gains were Naha +15.9%, Hakata Ward +12.8% and Ishigaki +9.7%, all cities with strong inbound demand.
Note that these rate differences are not explained by whether or not cruise ships call. Rate levels in Hakata Ward and Naha are shaped by overlapping demand from international visitors arriving by air, domestic business travel and events. Cruise calls add demand on top of that, and the cruise effect alone cannot be isolated from monthly rate levels.
Source: Compiled by HotelBank Editorial Team from MetroEngines Research (17–150 properties per municipality; period average of monthly medians)
Monthly Rates Cannot Isolate the Effect of Port Days — Checking Nagasaki’s 12-Month Trend
Nagasaki City has the most foreign cruise ship calls in Japan (194). We overlaid its monthly estimated settled ADR for 2024, 2025 and 2026. If cruise calls had a visible effect on monthly rates, rates would peak in the seasons with the most calls.
That is not the pattern we see. Nagasaki’s rates are highest in February and October–November (in 2025, August was also high). The February peak (about ¥12,600 in 2024 and about ¥11,400 in 2025) falls during the Nagasaki Lantern Festival, and October–November is the nationwide autumn travel season. So the shape of Nagasaki’s monthly rates is explained almost entirely by domestic events and travel seasonality. Even with 194 calls, the price effect of port days is buried by other factors at a monthly level of detail.
This is to be expected. Transit calls by foreign cruise ships are mostly day calls, and overnight stays generated by one call are limited to some crew members and passengers who book pre- or post-cruise stays themselves. Against a month’s room supply and demand, that volume is not large enough to move the monthly median. Assessing the price effect of port days would require matching daily inventory and price data against the call schedules published by port management bodies, and firm conclusions should not be drawn from monthly data. This article stops at confirming that the effect is not visible monthly.
Source: Compiled by HotelBank Editorial Team from MetroEngines Research (Nagasaki City; monthly medians of 62–64 properties. September 2026 onward is not shown because it would be an estimate based on listed rates at the time of the survey.)
Home Ports and Turnaround Ports Generate Pre- and Post-Cruise Stays by Design
Cruise calls translate directly into lodging demand when the port is used as a turnaround port. On a transit call, passengers sleep on board and no rooms on land are used; at a turnaround port, stays on land occur before boarding and after disembarking. For passengers coming from far away, a night before boarding is almost unavoidable.
MLIT’s materials show this structure appearing in the numbers. Inbound cruise passengers on cruises departing Japan, meaning mainly foreign travelers who fly to Japan and board a cruise here, rose to a record 181,000 in 2025, about twice the pre-COVID peak. By definition, these 181,000 passengers boarded at a Japanese port, and most of them stay overnight in or near the port of embarkation. At turnaround ports, the volume of embarking and disembarking passengers therefore translates directly into pre- and post-cruise room demand.
Ports with many Japanese-line calls map where turnaround ports are. By Japanese-line calls in 2025, Yokohama was first with 104, Bella Vista Marina second with 95 and Kobe third with 43, followed by Itsukushima 32, Shodoshima 28, Naha and Hakata with 18 each, and Nagoya 16. Yokohama is the only top port where half of its total 209 calls are Japanese-line calls.
The outlook points the same way. NYK Cruises (郵船クルーズ) has scheduled 31 “Asuka III” cruises departing Yokohama, Kobe and Hakata in June–October 2026, and 36 departing Yokohama, Tokyo, Nagoya, Kobe and Hakata from October 2026 to April 2027. Mitsui Ocean Cruises (商船三井クルーズ) has also scheduled 27 “MITSUI OCEAN FUJI” cruises in July–December 2026, including several short 2–4 night itineraries from and to Hakata. The ports used for turnarounds are Yokohama, Kobe, Hakata, Tokyo and Nagoya.
Of these five, the three in the top 10 (Yokohama, Kobe and Hakata) all have more than 80% of rooms in 100+ room properties and large average property sizes of 76.5–154.8 rooms. They already meet the requirement a turnaround port needs to meet: being able to secure a large block of rooms at once. For capturing pre- and post-cruise demand, that property size is a practical strength.
2026 Is Expected to Spread Calls Across Even More Ports
In 2025, foreign cruise ships called at 93 ports, about 1.4x the 67 ports of 2019, including 9 first-time calls. Ports outside the top 10 (“others”) took 1,012 foreign-ship calls alone, so calls are spread nationwide. Whether hotels can be built in the land behind a port depends on how the port’s zoning ordinances for port districts (rinko chiku bunku) are designed, so those rules are worth checking as well.
For 2026, regional ports have announced a run of record call schedules. In the Tohoku region, as of the end of March 2026, a total of 134 calls were scheduled at 8 ports in 5 prefectures (excluding Fukushima), expected to set a new record. Aomori Port announced 46 scheduled calls (including 9 first-time calls), above its 2025 record of 41. Iwate Prefecture expects a record 29 calls at its ports in fiscal 2026.
All of these ports fall on the thin side by room stock per port call, but their call numbers are growing. Whether they can prepare the receiving setup while calls are still growing (passenger transfer routes, group handling, crew plans, and links with nearby sightseeing) will determine how much of those calls can become overnight stays. By the numbers, the greatest upside lies with ports that already have many calls and relatively compact room stock.
Conclusion — Where Ships Call and Where Rooms Are Draw Different Maps
Cruise ship port calls reached a record 3,117 in 2025, with Hakata and Yokohama tied at 209. But the map of port calls and the map of room stock do not overlap. Re-ranked by room stock per port call, the gap spans about 19x, from 200.2 rooms at Hakata to 10.6 at Shimizu, and the order changes considerably.
There are two ways to read the gap. The deep ports (Hakata, Naha, Yokohama, Kobe) have spare capacity to absorb group pre- and post-cruise stays and crew accommodation. The thin ports (Shimizu, Sasebo, Ishigaki, Nagasaki) already have plenty of calls, and converting some of them into overnight stays would have a large effect on room supply and demand. Neither is a negative; they simply call for pursuing different kinds of demand.
The surest way to turn port calls into overnight stays is to become a turnaround port. Inbound cruise passengers on cruises departing Japan reached a record 181,000 in 2025, and many Japanese-line cruises departing Yokohama, Kobe, Hakata, Tokyo and Nagoya are scheduled from 2026 onward. For hotels in these five ports, their existing strength, large properties that make room blocks easy to secure, is now positioned to capture pre- and post-cruise demand.
Frequently Asked Questions (FAQ)
Q. Which port had the most cruise ship calls in 2025?
A. In MLIT’s 2025 preliminary figures, Hakata and Yokohama tied for first place with 209 calls each, followed by Naha 205, Nagasaki 198, Kobe 142, Ishigaki 130, Kagoshima 129, Sasebo 128, Hiroshima 106 and Shimizu 105. Counting only foreign cruise lines, Nagasaki is first with 194 calls; counting only Japanese cruise lines, Yokohama is first with 104, so the order changes.
Q. How many inbound cruise passengers did Japan have in 2025?
A. 1.767 million, about 1.2x the previous year. That is about 70% of the 2017 peak of 2.529 million, a slower recovery than port calls (about 106% of the 2018 peak). Of these, a record 181,000 took cruises departing Japan.
Q. Do ports with more cruise calls also have more hotel rooms nearby?
A. Not necessarily. Dividing rooms within a 5km radius of the main berth by port calls gives 200.2 rooms at Hakata versus 10.6 at Shimizu and 15.8 at Sasebo, a gap of about 19x. Nagasaki has the most foreign-ship calls in Japan (194), but its room stock per port call is 37.7 rooms, seventh of the 10 ports.
Q. Do cruise ship calls lead to hotel demand?
A. It depends on the type of call. On transit calls, which are mostly day calls, passengers sleep on board, so demand for rooms on land is limited. At turnaround ports where passengers embark and disembark, pre- and post-cruise stays occur. From 2026 onward, many Japanese-line cruises departing Yokohama, Kobe, Hakata, Tokyo and Nagoya are scheduled, so these ports see pre- and post-cruise demand by design.
Q. Do hotel rates rise on cruise port days?
A. With the monthly estimated settled ADR used in this article, the price effect of port days alone could not be isolated. Even in Nagasaki City, which has the most foreign-ship calls in Japan, monthly rates peak in February (Lantern Festival season) and October–November, a pattern explained by domestic events and travel seasonality. Testing the price effect of port days would require matching daily inventory and price data against the call schedules published by each port management body.
Methodology and Sources
Port calls, inbound cruise passengers, port rankings, the breakdown by class and the number of ports called at are taken as published in MLIT’s “Inbound Cruise Passengers and Cruise Ship Port Calls (2025 Preliminary Figures)” (published February 20, 2026) and the attachment to that press release. The source consists of preliminary figures based on interviews with port management bodies and may be revised. It covers cruise ships with at least one overnight stay on board and excludes day cruises. In addition to ports under the Port and Harbor Act, calls where the ship anchored offshore and passengers landed by tender, and calls at fishing ports, are counted. Inbound cruise passengers are foreign arrivals compiled by the Immigration Services Agency (approximate figures, excluding crew), and a passenger calling at several ports on one cruise is counted as a single arrival. The “Japanese lines” column in Table 1 is total calls minus foreign-line calls; for the four ports where the source publishes Japanese-line figures (Hakata, Yokohama, Naha and Kobe), we confirmed that the difference matches the published values.
Room stock is the total rooms of properties located within a 5km radius of each port’s main cruise berth and confirmed as listed on major booking sites in the latest three months (June–August 2026) (10-port total: 1,610 properties and 131,345 rooms). The berths used as center points are: Hakata = Chuo Pier (Hakata Port International Terminal); Yokohama = Osanbashi Yokohama International Passenger Terminal; Naha = Wakasa Berth; Nagasaki = Matsugae International Cruise Terminal; Kobe = Kobe Port Terminal; Ishigaki = Painuhama-cho (international cruise berth); Kagoshima = Marine Port Kagoshima; Sasebo = Miura district; Hiroshima = Ujina (Hiroshima Port International Terminal); Shimizu = Hinode Pier. Port calls are counted for the whole port (including multiple piers), whereas room stock is counted within a circle drawn from a single main berth, so the two spatial units do not match exactly. At ports with several piers, the room mix within the radius changes depending on where a ship actually berths.
Estimated settled ADR is an estimated settled rate (tax-excluded equivalent) calculated by applying a property-type adjustment factor to the lowest plan price each property publishes on major booking sites (two guests per room, price per room, tax included). At the municipal level, the median of the properties covered is used. The comparison averages the eight months of January–August 2025 and of January–August 2026 with equal weight, covering finalized (actual) months only. Properties covered range from 17 to 150 per municipality; Shimizu Ward, Shizuoka (17 properties), Minami Ward, Hiroshima (24) and Sasebo (34–37) have small samples, so their levels should be read with caution. Figure 5 (Nagasaki’s monthly trend) shows finalized months through August 2026; September 2026 onward is not shown because it would be an estimate based on listed rates at the time of the survey.
Room counts cited for the largest property in each port’s radius are MetroEngines Research figures, except for Hilton Fukuoka Sea Hawk, for which we used the 1,052 rooms stated in Hilton’s “Company Overview” (updated August 25, 2026). Japanese-line cruise schedules from 2026 onward are based on each cruise line’s announcements, and 2026 call schedules at regional ports are based on figures published by port management bodies and news outlets.
About the data: Port calls in this article are MLIT’s 2025 preliminary figures, based on interviews with port management bodies, and may be revised. Room stock counts only properties confirmed as listed on major booking sites and excludes unlisted properties. Estimated settled ADR is an estimate and differs from each property’s actual settled prices and accounting figures. “Room stock per port call” is a metric defined for this article, not an industry-standard measure.
Related Articles
- Record 3,117 Cruise Calls: Hotel Capacity at Japan’s Top 10 Ports
- Hotel Pricing on Cruise Port Days: ADR Premium Analysis for Yokohama, Kobe & Naha
References and Sources
■ Data sources
Port calls, inbound cruise passengers, port rankings and the breakdown by class: MLIT, “Inbound Cruise Passengers and Cruise Ship Port Calls (2025 Preliminary Figures)” (published February 20, 2026) and the attachment to that press release. Room stock within a 5km radius (10-port total: 1,610 properties / 131,345 rooms) and estimated settled ADR by municipality (finalized months, January 2024–August 2026): MetroEngines Research. Room count for Hilton Fukuoka Sea Hawk: Hilton, “Company Overview” (updated August 25, 2026).
■ Assumptions
Room stock is the total rooms of properties located within a 5km radius of a single main cruise berth at each port and confirmed as listed on major booking sites in the latest three months (June–August 2026). “Room stock per port call” is that room stock divided by 2025 port calls, a metric defined for this article. Estimated settled ADR is an estimated settled rate (tax-excluded equivalent) calculated by applying a property-type adjustment factor to the lowest plan price each property publishes (two guests per room, price per room, tax included); at the municipal level the median of the properties covered is used, and the eight months of January–August 2025 and of January–August 2026 are each averaged with equal weight for comparison. Properties covered range from 17 to 150 per municipality.
■ Limitations
Port calls are preliminary figures based on interviews with port management bodies and may be revised. Port calls are counted for the whole port (including multiple piers), whereas room stock is counted within a circle drawn from a single main berth, so the two spatial units do not match exactly. Properties not confirmed as listed are excluded from room stock. Estimated settled ADR is an estimate and differs from each property’s actual settled prices and accounting figures. Shimizu Ward, Shizuoka (17 properties), Minami Ward, Hiroshima (24) and Sasebo (34–37) have small samples, and their levels should be read with caution. The price effect of port days alone cannot be isolated from monthly rate data.
■ Government statistics and public data (Japanese)
- MLIT, “Inbound Cruise Passengers and Cruise Ship Port Calls (2025 Preliminary Figures)” (published February 20, 2026)
- Attachment to the above (Figures 1–11 and list of port calls by port)
- MLIT, “Inbound Cruise Passengers and Cruise Ship Port Calls (2024 Preliminary Figures)”
- MLIT Ports and Harbours Bureau, “Cruise Promotion”
- City of Yokohama, “Port of Yokohama Cruise Ship Arrival Schedule (2026)”
- Iwate Prefecture, “Cruise Ship Call Schedule and Record in Iwate Prefecture”
- MLIT Aomori Port and Airport Office, “2026 Cruise Ship Call Schedule for Aomori Port”
■ Cruise line announcements (Japanese)
- NYK Cruises, “Asuka III 2026 Summer and Autumn Cruises Announced (31 cruises departing Yokohama, Kobe and Hakata)”
- NYK Cruises, “Asuka III: 36 Cruises Departing Yokohama, Tokyo, Nagoya, Kobe and Hakata from Autumn 2026 to Spring 2027 Announced”
- Mitsui Ocean Cruises, “MITSUI OCEAN FUJI New Cruises for July–December 2026 Announced”
■ News reports (Japanese)
- Kahoku Shimpo, “Cruise Ship Calls Rising in Tohoku, Set for a Record in 2026” (May 3, 2026)
- Travel Voice, “Inbound Cruise Passengers in 2025 Up 1.2x Year on Year to 1.77 Million” (February 24, 2026)
■ Market data
- MetroEngines Research — room stock within a 5km radius (10-port total: 1,610 properties / 131,345 rooms; properties confirmed as listed in June–August 2026) and estimated settled ADR by municipality (finalized months, January 2024–August 2026)
Source: Hilton, “Company Overview” (updated August 25, 2026)