

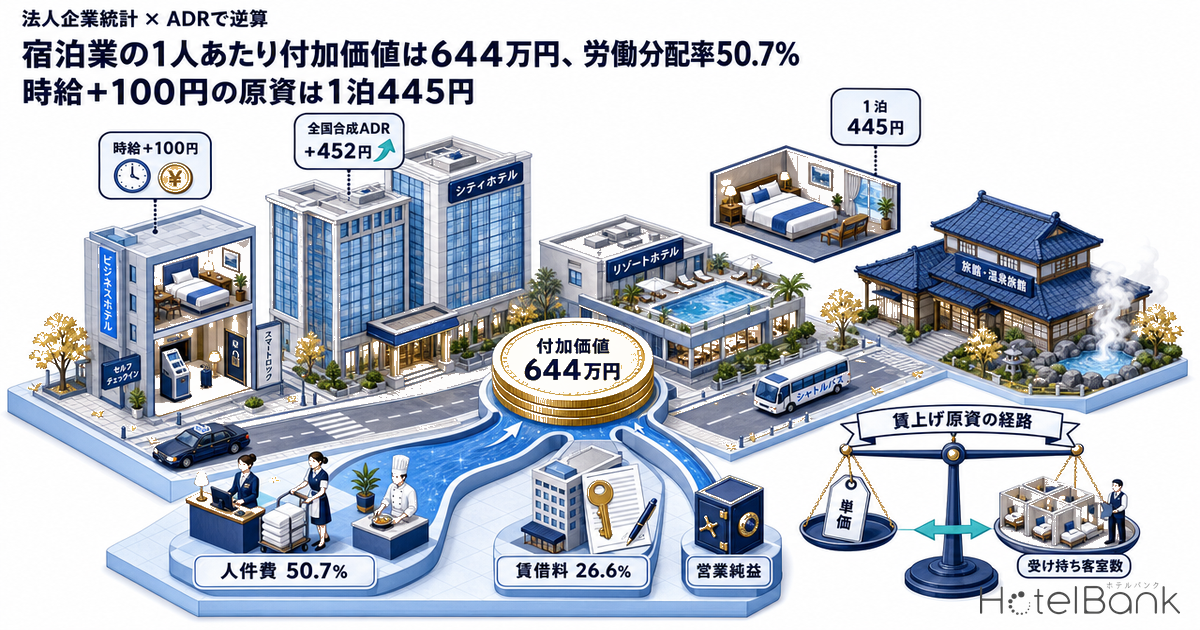
Conversations about raising wages usually start with how much to pay. But the money an employer pays with does not come from revenue; it comes from value added. According to the Ministry of Finance’s Financial Statements Statistics of Corporations by Industry, value added per employee in Japan’s accommodation industry reached ¥6.44M in FY2025. Of that, ¥3.26M went to personnel costs, a share of value added (the labor share) of 50.7%. This article breaks the ¥6.44M down in yen, connects it to MetroEngines Research’s national ADR, and works backwards to answer one question: how much more revenue per room does it take to raise hourly pay by ¥100?
How this differs from earlier coverage: Japan Minimum Wage 2026: Chiba & Aichi ¥1,195, Oct 1-15 Rollout listed the new rates themselves. Earlier HotelBank analyses (in Japanese) covered the additional cost of meeting the legal minimum (about ¥9,600 per room per year) and the denominator of productivity (rooms per employee). This article covers what value added consists of and how it is distributed: where the ¥6.44M goes, and how much of a rate increase can be turned into funding for wages. It is an angle HotelBank has not used before.
Metric Definitions Used in This Article
- Value added: as defined by the Ministry of Finance’s Financial Statements Statistics of Corporations by Industry. The sum of net operating profit + personnel costs (directors’ salaries, directors’ bonuses, employee salaries, employee bonuses and welfare expenses) + interest paid etc. + rent on movable and real property + taxes and public dues.
- Value added per employee: the survey’s published “value added per employee” figure. Value added ÷ average number of employees during the period; directors are not included in the denominator. Under a definition that adds directors to the denominator, the accommodation industry’s FY2025 figure is ¥6.03M, and an earlier HotelBank article used that definition. This article uses the published employee-based figure.
- Labor share: personnel costs ÷ value added.
- ADR (Average Daily Rate): an estimated settled rate (tax-exclusive equivalent), calculated by applying a property-type adjustment factor to the lowest-plan rate each property publishes on OTAs and elsewhere (per room, 2 guests, tax-inclusive). Checked against the property-level results disclosed by listed hotel REITs (91 properties, most recent 3 months), the median error is about 7%. These are estimates and differ from each property’s actual settled prices and accounting figures. Area-level ADR is the median of the properties covered (the level of a typical property in the area).
- National composite ADR: a composite of area ADRs for 47 prefectures × 4 property types (business, city, resort, ryokan), weighted by the number of properties covered in each cell. FY2025 monthly average N=16,643 properties.
- Minimum wage: Ministry of Health, Labour and Welfare, “FY2026 Regional Minimum Wage Revisions” (published September 3, 2026). National weighted average ¥1,177, taking effect prefecture by prefecture between October 1 and December 2, 2026.
- Data sources: MetroEngines Research (ADR) / Ministry of Finance, Ministry of Internal Affairs and Communications, Ministry of Economy, Trade and Industry, Ministry of Health, Labour and Welfare (public statistics)
- — Value added per employee in the accommodation industry was ¥6.44M in FY2025, a 2.4-fold recovery from ¥2.68M in FY2021 and the highest level since at least FY2012.
- — The ¥6.44M splits into personnel costs of ¥3.26M (50.7%), rent of ¥1.71M (26.6%) and net operating profit of ¥1.03M (16.0%). The rent share is 3.1 times the all-industry figure of 8.6%.
- — Funding a ¥100 hourly raise for every employee takes ¥114k per room per year (at 2.02 rooms per employee). Per night, that is ¥445 (assuming 70% occupancy).
- — The national composite ADR rose +¥452 (+3.8%) from FY2023 to FY2025. That increase is equivalent to funding for roughly ¥100 an hour.
- — By property type, the rate increase at business hotels is worth +¥249 an hour and at city hotels +¥505. The more rates have moved, the more room there is to convert them into pay.
Value Added per Employee Hits ¥6.44M, 2.4 Times the FY2021 Level
The chart below plots value added per employee by fiscal year for the accommodation industry, all industries (excluding finance and insurance) and manufacturing, from the Ministry of Finance’s Financial Statements Statistics of Corporations. The accommodation industry reached ¥6.44M in FY2025. After falling to ¥2.42M in FY2020 and ¥2.68M in FY2021, it has recovered 2.4-fold to its highest level since at least FY2012.
For comparison, all industries stood at ¥8.51M and manufacturing at ¥10.13M. The accommodation industry’s ratio to all industries was 75.7%, a much narrower gap than 59.9% in FY2019 and 37.1% in FY2021. The rate recovery of recent years has flowed straight into value added per employee.
This comes with a caveat. The survey is a sample survey of corporations with capital of ¥10M or more, and the accommodation sample is small relative to all industries. In FY2025 the industry’s employee count moved from 731,000 in the prior year to 548,000, and sales from ¥10.18 trillion to ¥8.18 trillion. A swing of that size reflects changes in sample composition rather than actual changes in the industry’s scale, so the figures are best read as a multi-year trend rather than as single-year levels.
Source: Compiled by HotelBank Editorial Team from Ministry of Finance, Financial Statements Statistics of Corporations
Where the ¥6.44M Goes: ¥1.71M to Rent, 3.1 Times the All-Industry Share
Once generated, value added is split among five destinations: personnel costs, net operating profit, interest paid etc., rent on movable and real property, and taxes and public dues. The table and chart below divide the accommodation industry’s FY2025 value added of ¥3.53 trillion among those five.
What stands out is rent at 26.6%. The figure is 8.6% for all industries and 4.3% for manufacturing, so the accommodation industry’s share is 3.1 times the all-industry level. Per employee, ¥1.71M of the ¥6.44M goes to rent on buildings and equipment. The number reflects the industry’s structure, in which management contracts, fixed-term leases and sub-leases, arrangements where the operator runs the hotel without owning the land and building, are widely used.
That structure matters for the wage debate. Much of the rent is a fixed amount set by contract and does not rise in proportion to room rates (except for variable-rent components). In other words, value added generated by higher rates tends to flow to personnel costs and net operating profit rather than being absorbed by rent. The fact that a destination taking more than a quarter of value added is fixed means there is relatively more freedom in how the increment is allocated.
| Destination | Accommodation | Share | Per employee | All industries share | Manufacturing share |
|---|---|---|---|---|---|
| Personnel costs | ¥1,786.5bn | 50.7% | ¥3.26M | 63.0% | 65.5% |
| Rent on movable and real property | ¥937.7bn | 26.6% | ¥1.71M | 8.6% | 4.3% |
| Net operating profit | ¥563.9bn | 16.0% | ¥1.03M | 22.0% | 25.5% |
| Interest paid etc. | ¥124.8bn | 3.5% | ¥230k | 3.0% | 2.1% |
| Taxes and public dues | ¥113.3bn | 3.2% | ¥210k | 3.4% | 2.6% |
| Total value added | ¥3,526.1bn | 100% | ¥6.44M | 100% | 100% |
FY2025. Per-employee figures divide by the average of 548,000 employees during the period. Source: Compiled by HotelBank Editorial Team from Ministry of Finance, Financial Statements Statistics of Corporations
Source: Compiled by HotelBank Editorial Team from Ministry of Finance, Financial Statements Statistics of Corporations (FY2025)
Reading a 50.7% Labor Share: The Flip Side of an Asset-Light Business Model
The labor share, personnel costs as a share of value added, was 50.7% for the accommodation industry in FY2025, against 63.0% for all industries and 65.5% for manufacturing. Because single-year values are affected by sample composition, the average of the latest three fiscal years (FY2023–FY2025) is a better guide: accommodation 56.1%, all industries 64.1%, manufacturing 66.0%.
Reading this gap as a difference in willingness to share with workers would be inaccurate. As the previous section showed, the accommodation industry allocates 26.6% of its value added to rent. The 18.0-point gap from the all-industry 8.6% pushes down the share left for every other destination. Comparing personnel costs plus net operating profit, accommodation comes to 66.7% and all industries to 85.0%, and most of the difference is explained by rent. The plainest reading is that the difference in labor share is the industry’s structure, specialising in operations without owning assets, showing up directly in the numbers.
Over time, the accommodation industry’s labor share exceeded 100%, at 133.6% in FY2020 and 121.4% in FY2021. Those figures show personnel costs being maintained while value added itself shrank, a record of the industry carrying its workforce through a period with no demand. Since then it has returned toward normal levels as value added recovered: 72.5% in FY2022, 59.0% in FY2023, 58.6% in FY2024 and 50.7% in FY2025.
Source: Compiled by HotelBank Editorial Team from Ministry of Finance, Financial Statements Statistics of Corporations
Value Added per Employee Differs 2.03-Fold by Capital Size
Even within the accommodation industry, value added per employee varies widely with company size by capital. In FY2025, companies with capital under ¥100M generated ¥5.17M and those with ¥100M or more ¥10.51M, a 2.03-fold difference. The ¥100M-plus tier exceeds manufacturing (¥10.13M) and all industries (¥8.51M).
Notably, the higher-value tier combines a lower labor share (42.7%) with a higher rent share (32.0%). Meanwhile, salaries and bonuses per employee are ¥2.31M for companies under ¥100M and ¥3.78M for those at ¥100M or more, a 1.6-fold gap. Even with a lower labor share, twice the value added per employee in the denominator produces higher wages in yen. Within a single industry, this confirms that what sets actual wage levels is first the level of value added per employee, not the labor share.
| Tier (capital) | Value added per employee | Labor share | Rent share | Salaries & bonuses per employee |
|---|---|---|---|---|
| Under ¥100M (418,000 employees) | ¥5.17M | 55.7% | 23.2% | ¥2.31M |
| ¥100M or more (130,000 employees) | ¥10.51M | 42.7% | 32.0% | ¥3.78M |
| All sizes | ¥6.44M | 50.7% | 26.6% | ¥2.66M |
FY2025. Source: Compiled by HotelBank Editorial Team from Ministry of Finance, Financial Statements Statistics of Corporations
A ¥100 Hourly Raise Takes ¥114k per Room per Year
Now for the reverse calculation. Salaries and bonuses per employee in the accommodation industry were ¥2.66M in FY2025. Divided by 2,000 hours a year, that is roughly ¥1,328 an hour, 1.13 times the national weighted-average minimum wage of ¥1,177 that takes effect in stages from October 2026. Raising hourly pay by ¥100 from this level means a 7.5% wage increase.
■ Calculation Assumptions
- Scope: the funding needed to raise hourly pay by ¥100 for all employees across the board. This assumes a voluntary raise, not the additional cost of meeting the legal minimum.
- Annual working hours: 2,000 hours per employee, set as a level consistent with FY2025 salaries and bonuses per employee of ¥2.66M in the accommodation industry.
- Statutory welfare costs: 15% of wages added as the employer’s share. In FY2026 the employer’s combined share of health insurance, employees’ pension, employment insurance, workers’ accident compensation insurance and the child and child-rearing support levy is about 15% for employees not covered by long-term care insurance (Category 2 insured persons), and in the 16% range for those who are.
- Rooms per employee: the national average of 2.02 rooms as the base case, with 1.50 rooms (operations staffed more heavily) and 3.00 rooms (operations with advanced labor saving) shown alongside. These correspond to the measured prefectural range of 1.47–3.33 rooms shown in an earlier HotelBank article.
- Annual room-nights sold: 256 nights per room (70% full-year occupancy) as the base case, with 237 nights (65%) and 274 nights (75%) as sensitivities.
- Revenue and value added: revenue gained from higher rates involves almost no external purchased costs, so the increment is assumed to become value added in full. Sales commissions on bookings via OTAs and other channels are not deducted.
On these assumptions, the funding needed for a ¥100 hourly raise is a ¥200k annual wage increase per employee plus statutory welfare costs, or ¥230k. At 2.02 rooms per employee, a 100-room hotel has about 50 employees. That comes to ¥11.39M a year, or ¥113,900 per room. Spread across nightly rates at 70% occupancy, it is ¥445 per night.
| Staffing density | 30 rooms | 100 rooms | 200 rooms | Per room per year | Per night (occupancy 65/70/75%) |
|---|---|---|---|---|---|
| 1.50 rooms/employee (heavier staffing) | ¥4.60M | ¥15.33M | ¥30.67M | ¥153,300 | ¥647 / ¥599 / ¥560 |
| 2.02 rooms/employee (national average) | ¥3.42M | ¥11.39M | ¥22.77M | ¥113,900 | ¥480 / ¥445 / ¥416 |
| 3.00 rooms/employee (advanced labor saving) | ¥2.30M | ¥7.67M | ¥15.33M | ¥76,700 | ¥323 / ¥300 / ¥280 |
Annual funding needed for a ¥100 hourly raise (including 15% statutory welfare costs, assuming 2,000 hours a year). Source: HotelBank Editorial Team estimates
The table shows that the required nightly increase falls within a range of ¥280 to ¥647. The number of rooms itself does not change the per-night amount. What matters is how many rooms each employee handles and the occupancy rate: moving staffing density from 1.50 rooms to 3.00 rooms alone cuts the required amount by more than half. Raising rates and raising the number of rooms each employee handles are substitutes for funding the same wage increase.
The ADR Increase of the Past Two Years Was Worth About ¥100 an Hour
So how much have rates actually moved? MetroEngines Research’s national composite ADR was ¥12,049 in FY2023 and ¥12,501 in FY2025, a rise of +¥452 (+3.8%) over two years (monthly average N=16,643 properties). That is roughly +1.9% a year.
Converting this +¥452 into hourly pay on the same assumptions as the previous section: the annual revenue gain per room is ¥452 × 256 nights = ¥115,712, and at 2.02 rooms per employee that is ¥233,738 per employee. Deducting statutory welfare costs and dividing by 2,000 hours gives +¥102 an hour. Varying occupancy between 65% and 75% gives a range of +¥94 to +¥109, so it is fair to say that the rate increase of these two years generated funding worth roughly ¥100 an hour.
Not all of the revenue gain stays with the hotel, however. If half of bookings come through OTAs and other channels at a 10% sales commission, about 5% of the increment goes to commissions, bringing the hourly equivalent to about ¥97. Rising utility and food costs also come out of the same value added, so the gain cannot be assumed to go entirely to wages. Even so, knowing in yen how much wage funding a rate increase represents helps put wage decisions in the right order.
By Property Type: The More Rates Moved, the More Room to Convert Them
The national composite +¥452 is an average that smooths out movements across property types. Split by type, rate changes over these two years look quite different.
Business hotels rose from ¥7,788 to ¥8,897, +14.2%, and city hotels from ¥11,773 to ¥14,019, +19.1%. In hourly terms these are worth +¥249 and +¥505 respectively. Against the ¥445 per night needed for a ¥100 hourly raise, business hotels had already generated 2.5 times that increase and city hotels 5.0 times. Resorts rose +3.2%, worth +¥116 an hour, just above the required level.
Ryokan went from ¥15,521 to ¥15,226, −1.9%, so for these two years at least, the funding would have to come from somewhere other than room rates. However, ryokan typically include two meals, and they are the property type pushing up the industry’s overall value-added ratio of 43.1%. Revenue per room including food and beverage cannot be measured by room rates alone, so the rate trend cannot be read directly as the funding trend. Cost pressures also differ by property type: national hotel ADR rose 8.7% over three years while the food CPI rose 13.8%.
| Property type | FY2023 ADR | FY2025 ADR | Change | Hourly-pay equivalent | Pass-through needed for +¥100/hour | Monthly avg. N |
|---|---|---|---|---|---|---|
| Business | ¥7,788 | ¥8,897 | +¥1,109 (+14.2%) | +¥249 | 5.00% | 7,338 |
| City | ¥11,773 | ¥14,019 | +¥2,246 (+19.1%) | +¥505 | 3.17% | 1,090 |
| Resort | ¥16,284 | ¥16,801 | +¥517 (+3.2%) | +¥116 | 2.65% | 1,527 |
| Ryokan | ¥15,521 | ¥15,226 | −¥295 (−1.9%) | −¥66 | 2.92% | 6,687 |
| National composite | ¥12,049 | ¥12,501 | +¥452 (+3.8%) | +¥102 | 3.56% | 16,643 |
Hourly-pay equivalents are estimates at 2.02 rooms per employee, 70% occupancy and 15% statutory welfare costs. Source: Compiled by HotelBank Editorial Team from MetroEngines Research data
Source: Compiled by HotelBank Editorial Team from MetroEngines Research data
The Other Route: Outsourcing and Labor-Saving Investment
Wage funding does not come from room rates alone. As the reverse-calculation table showed, moving rooms per employee from 2.02 to 3.00 cuts the annual per-room amount needed for the same ¥100 hourly raise from ¥113,900 to ¥76,700, a reduction of about 33%. In terms of the required nightly increase, ¥445 becomes ¥300.
One way to move this denominator is to outsource room cleaning. In the value-added calculation, outsourcing fees are deducted from sales as external purchased costs rather than counted as personnel costs, so the value-added ratio itself falls. But outsourcing lets inputs be adjusted to busy and quiet periods, creating a structure that does not carry fixed personnel costs through the off-season. Whether to prioritise the value-added ratio or variable costs depends on how much occupancy swings with the seasons.
The other is capital investment in labor saving. Self-check-in kiosks, housekeeping management systems and smart locks raise the number of rooms per employee and so lower the required amount in the reverse-calculation table itself. HotelBank’s earlier estimate found that using Japan’s labor-saving investment subsidy brings the minimum hotel size for a three-year payback down from 68 rooms to 34, nearly half. With the expansion of social insurance coverage from October 2026 (the end of the ¥1.06M wage threshold), statutory welfare costs for part-time workers will also shift, so comparing shift design and investment plans on the same table matters more than before.
And the room to move this denominator has not yet been evened out. Measured rooms per employee range 2.3-fold across Japan’s 47 prefectures, from 1.47 to 3.33. As long as that spread exists, routes to wage funding that do not depend on raising rates remain open in many regions. The precondition for moving the denominator, however, is being able to hire, and how hard that is also varies by region: the density of Specified Skilled Worker (accommodation) staff per 1,000 hotel rooms differs 15.8-fold between prefectures.
Summary: How Much Room Is There to Turn Higher Rates into Productivity?
Value added per employee in the accommodation industry recovered to ¥6.44M in FY2025, bringing it back to 75.7% of the all-industry level. Of that ¥6.44M, ¥3.26M goes to personnel costs and ¥1.71M to rent. A rent share 3.1 times the all-industry level explains most of the gap in labor share, and at the same time, because so much of the cost base is fixed, it means greater freedom in how increments are allocated.
The funding for a ¥100 hourly raise is ¥113,900 per room per year, or ¥445 per night. The +¥452 rise in the national composite ADR over these two years reached almost exactly that level. By property type, business hotels have already generated 2.5 times that increase and city hotels 5.0 times. On the numbers, there is clearly room to convert higher rates into higher productivity.
The remaining question is allocation: whether to capture that room through rates or through rooms per employee. The former depends on the demand environment; the latter can be moved by the hotel itself through investment and job design. Starting from the minimum wage revision taking effect from October 2026 (national weighted average ¥1,177), putting both routes on the same per-room table makes it faster to decide where the funding for the next raise should come from.
Frequently Asked Questions
Q. What is value added per employee in Japan’s accommodation industry?
¥6.44M in FY2025, according to the Ministry of Finance’s Financial Statements Statistics of Corporations (the published figure, divided by the average number of employees during the period). All industries stood at ¥8.51M and manufacturing at ¥10.13M, putting accommodation at 75.7% of the all-industry level. Under a definition that includes directors in the denominator, the figure is ¥6.03M.
Q. What is the labor share in the accommodation industry?
50.7% in FY2025, and 56.1% on average over the latest three fiscal years. All industries were at 63.0% (three-year average 64.1%) and manufacturing at 65.5% (66.0%). Most of the gap is explained by the industry’s structure, in which 26.6% of value added goes to rent on movable and real property.
Q. How much do room rates need to rise to fund a ¥100 hourly raise?
On estimates of 2.02 rooms per employee, 70% occupancy and 15% statutory welfare costs, ¥113,900 per room per year, or ¥445 per night. At 3.00 rooms per employee it is ¥300 per night, and at 1.50 rooms ¥599 per night, so the required amount varies more than twofold with staffing density.
Q. What is Japan’s minimum wage from October 2026?
The national weighted average is ¥1,177 (+¥56 year on year). The highest rate is ¥1,280 and the lowest ¥1,085, taking effect prefecture by prefecture between October 1 and December 2, 2026 (Ministry of Health, Labour and Welfare, published September 3, 2026).
Related Reading
- Japan Minimum Wage 2026: Chiba & Aichi ¥1,195, Oct 1-15 Rollout
- Japan Ends the ¥1.06M Wage Threshold Oct 2026: Hotel Shift Design
References and Sources
■ Data Sources
Value added, personnel costs, net operating profit, rent on movable and real property, taxes and public dues, interest paid etc. and the average number of employees during the period are from the Ministry of Finance’s Financial Statements Statistics of Corporations, annual series by industry (FY2012–FY2025). ADR is MetroEngines Research’s estimated settled rate, a composite of area values for 47 prefectures × 4 property types weighted by the number of properties covered (FY2023 and FY2025, monthly average N=16,643 properties). The minimum wage is the Ministry of Health, Labour and Welfare’s FY2026 regional minimum wage revisions (published September 3, 2026).
■ Calculation Assumptions
Hourly-pay equivalents use a base case of 2,000 working hours a year, 15% statutory welfare costs (employer’s share), 2.02 rooms per employee and 256 room-nights sold per year (70% full-year occupancy), with staffing density of 1.50–3.00 rooms and occupancy of 65–75% shown as sensitivities. Revenue gained from higher rates involves almost no external purchased costs, so the increment is assumed to become value added in full. Value added per employee uses the published employee-based figure (directors not included in the denominator).
■ Limitations
The Financial Statements Statistics of Corporations is a sample survey of corporations with capital of ¥10M or more. The accommodation sample is small, and single-year levels are affected by changes in sample composition (in FY2025 the employee count moved from 731,000 in the prior year to 548,000), so the figures should be read as a multi-year trend rather than single years. ADR figures are estimates and differ from each property’s actual settled prices and accounting figures (median error of about 7% against property-level disclosures by listed hotel REITs). Hourly-pay equivalents do not deduct changes in sales commissions, utility costs or food costs, and do not imply that the entire revenue gain becomes wage funding.
■ Public Statistics
- Ministry of Finance, Financial Statements Statistics of Corporations by Industry (annual, by industry / e-Stat table ID 0003060791. Value added, personnel costs, net operating profit, rent on movable and real property, taxes and public dues, interest paid etc., average number of employees and directors during the period, and value added per employee for accommodation, all industries (excluding finance and insurance) and manufacturing)
- Ministry of Health, Labour and Welfare, “Revised Regional Minimum Wages Recommended for All Prefectures” (published September 3, 2026) (in Japanese)
- Ministry of Internal Affairs and Communications / Ministry of Economy, Trade and Industry, 2021 Economic Census for Business Activity (employees in industry group 75, accommodation; basis for rooms per employee)
- e-Stat, Portal Site of Official Statistics of Japan
■ Market Data
- MetroEngines Research — estimated settled ADR for 47 prefectures × 4 property types (FY2023, FY2024 and FY2025, monthly average N=16,643 properties)