

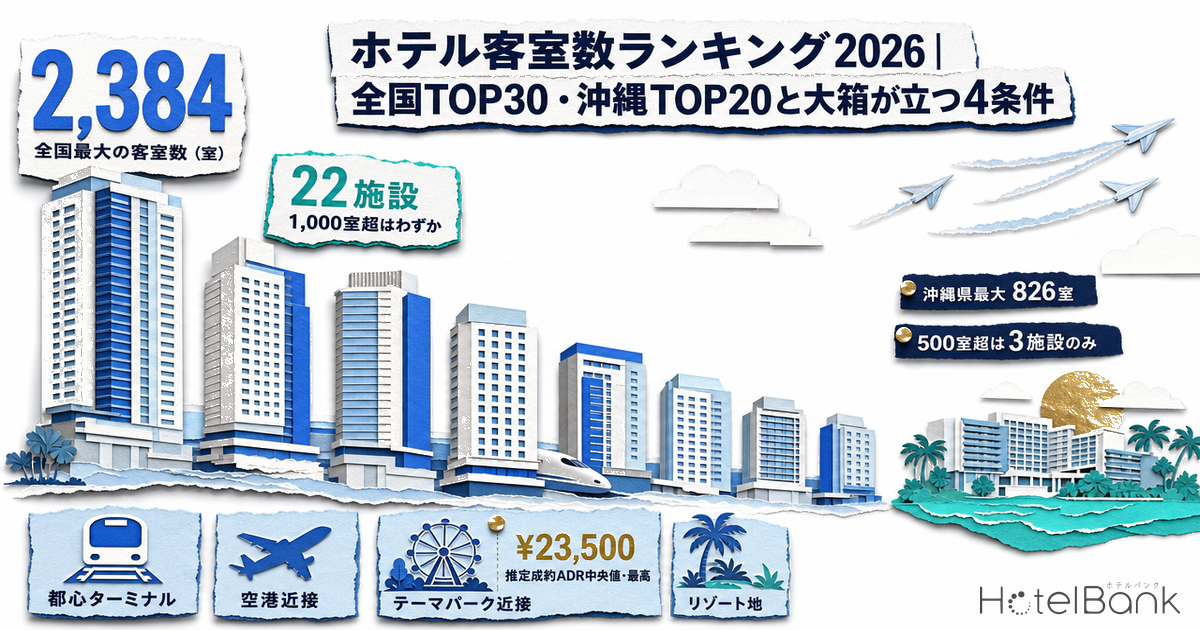
A hotel’s room count is about more than size. Large tour groups, academic conferences and MICE, big concerts and sporting events — demand that needs beds for several hundred people at once can only be absorbed by a limited number of properties nationwide. This article covers properties listed on major OTAs for which we hold room-count data, and ranks them by room count at the property level (one building / one listing) in two tables: a national Top 30 and an Okinawa Prefecture Top 20. We then use the data to test two questions: where do large hotels get built, and how does scale affect rates and guest ratings?
- — Only 22 properties nationwide exceed 1,000 rooms. The largest is Shinagawa Prince Hotel at 2,384 rooms (the operator reports 3,679 rooms across the whole complex); as a single building, APA Hotel & Resort Yokohama Bay Tower is the largest at 2,311 rooms.
- — Of the 546 properties with 300+ rooms, 369 properties with 175,767 rooms are in urban terminal locations. That is two-thirds of all properties by count: large room volumes depend on the pull of major rail terminals.
- — The highest rates are found near theme parks (median estimated settled ADR ¥23,500). This type also has the largest median size (491 rooms) and the highest median rating (4.29) of the four location types, making it the one type that combines volume with rate.
- — Room count and estimated settled ADR are virtually uncorrelated (r=0.05), and room count and guest rating are also uncorrelated (r=0.02). Rate differences come from location type, not scale, with roughly a 3x gap between types.
- — Eight prefectures have no property with more than 300 rooms, and eight more have only one. Okinawa ranks 5th nationally with 34 properties above 300 rooms, but only 3 exceed 500.
Metric Definitions Used in This Article
- Coverage (population): Accommodation properties in Japan listed on major OTAs for which we hold room-count data, limited to properties with confirmed recent listing activity (listed on 20 or more check-in dates between June and July 2026). This is not a census; properties not listed on OTAs, or whose listings could not be confirmed, are excluded.
- Unit of count: The unit listed as one accommodation property on OTAs (one building / one property). For multi-tower complexes, this may not match the whole-complex total published by the operator; such properties are annotated in the tables.
- Room count: Room-count data collected and maintained by us. For top-ranked properties we checked each figure against the operator’s published materials, and where the published figure differs we use the published figure (the source is noted in the table).
- ADR (average daily rate): An estimated settled rate (tax-exclusive equivalent), calculated by applying a property-type adjustment factor to the lowest-plan rate each property publishes on OTAs (per room, two guests, tax included). Checked against property-level results disclosed by listed hotel REITs (91 properties, most recent 3 months), the median error is about 7%. These are estimates and differ from each property’s actual settled prices and accounting figures. This article shows the median of monthly values over the most recent 12 months (September 2025 – August 2026). Estimated settled ADR is calculated only for validated property types (business, city, resort, ryokan, capsule); other types are shown as “—”.
- Guest rating: Overall guest review score (out of 5). Properties without accumulated reviews are shown as “—”.
- Data source: MetroEngines Research
National Top 30 — The Largest Has 2,384 Rooms; Only 22 Exceed 1,000
We start with the national ranking. Of the 886 properties in scope (250+ rooms), 546 have 300 or more rooms, 140 have 500 or more, and just 22 exceed 1,000. Across Japan’s hotel market as a whole, 1,000-room-class “big box” hotels are extremely rare.
The property with the most rooms is Shinagawa Prince Hotel in Shinagawa, Tokyo (2,384 rooms). However, it is a complex made up of the Main Tower, Annex Tower, N Tower and East Tower, and the operator reports 3,679 rooms for the complex as a whole. Because this table counts OTA listing units, the East Tower (919 rooms) appears separately at No. 27. For No. 2, APA Hotel & Resort Yokohama Bay Tower (2,311 rooms), the operator stated in its opening press release that it has “the largest number of rooms in Japan for a single building,” so on a single-building basis it ranks first.
| Rank | Property | Location | Rooms | Opened | Est. Settled ADR | Rating | Location Type |
|---|---|---|---|---|---|---|---|
| 1 | Shinagawa Prince Hotel (品川プリンスホテル) * The operator reports 3,679 rooms across all four towers. This table uses OTA listing units. | Minato, Tokyo | 2,384 | 1978 | ¥32,200 | 3.91 | Urban Terminal |
| 2 | APA Hotel & Resort Yokohama Bay Tower (アパホテル&リゾート〈横浜ベイタワー〉) | Naka-ku, Yokohama, Kanagawa | 2,311 | 2019 | ¥7,900 | 4.11 | Urban Terminal |
| 3 | APA Hotel & Resort Osaka Namba Ekimae Tower (アパホテル&リゾート〈大阪なんば駅前タワー〉) | Naniwa, Osaka | 2,055 | 2024 | ¥12,200 | 3.95 | Urban Terminal |
| 4 | APA Hotel & Resort Tokyo Bay Makuhari (アパホテル&リゾート〈東京ベイ幕張〉) | Mihama-ku, Chiba | 2,007 | 1993 | ¥13,500 | 3.91 | Urban Terminal |
| 5 | APA Hotel & Resort Osaka Umeda Eki Tower (アパホテル&リゾート〈大阪梅田駅タワー〉) | Kita, Osaka | 1,704 | 2023 | ¥14,100 | 4.00 | Urban Terminal |
| 6 | Villa Fontaine Grand Haneda Airport (ヴィラフォンテーヌグランド羽田空港) * Published as 1,717 rooms in total including the adjacent sister property. | Ota, Tokyo | 1,557 | 2022 | ¥25,700 | 4.45 | Airport-Adjacent |
| 7 | Hotel New Otani Tokyo (ホテルニューオータニ東京) | Chiyoda, Tokyo | 1,479 | 1964 | ¥55,300 | 4.47 | Urban Terminal |
| 8 | Keio Plaza Hotel (京王プラザホテル) * Uses the 1,452 rooms stated in the official company profile. | Shinjuku, Tokyo | 1,452 | 1971 | — | 4.62 | Urban Terminal |
| 9 | Hotel Ours Inn Hankyu (アワーズイン阪急) | Shinagawa, Tokyo | 1,388 | 1971 | ¥13,700 | 4.20 | Urban Terminal |
| 10 | Toyoko Inn Chubu International Airport No.2 (東横INN中部国際空港2) | Tokoname, Aichi | 1,287 | 2019 | ¥7,200 | 3.74 | Airport-Adjacent |
| 11 | Shinjuku Washington Hotel Main Building (新宿ワシントンホテル 本館) | Shinjuku, Tokyo | 1,280 | 1983 | ¥17,800 | 3.71 | Urban Terminal |
| 12 | Naeba Prince Hotel (苗場プリンスホテル) | Yuzawa, Niigata | 1,216 | 1962 | ¥12,600 | 3.64 | Resort |
| 13 | APA Hotel & Resort Ryogoku Eki Tower (アパホテル&リゾート〈両国駅タワー〉) | Sumida, Tokyo | 1,111 | 2020 | ¥12,700 | 4.18 | Urban Terminal |
| 14 | Sunshine City Prince Hotel (サンシャインシティプリンスホテル) | Toshima, Tokyo | 1,085 | 1980 | ¥30,200 | 4.20 | Urban Terminal |
| 15 | Hilton Fukuoka Sea Hawk (ヒルトン福岡シーホーク) * Uses the 1,052 rooms stated in the Hilton company overview. | Chuo-ku, Fukuoka | 1,052 | 1995 | ¥37,800 | 3.96 | Urban Terminal |
| 16 | Hotel Hankyu Respire Osaka (ホテル阪急レスパイア大阪) | Kita, Osaka | 1,030 | 2019 | ¥26,600 | 4.30 | Urban Terminal |
| 17 | Sheraton Grande Tokyo Bay Hotel (シェラトン・グランデ・トーキョーベイ・ホテル) | Urayasu, Chiba | 1,016 | 1988 | ¥27,800 | 4.05 | Theme Park-Adjacent |
| 18 | Tokyo Dome Hotel (東京ドームホテル) | Bunkyo, Tokyo | 1,006 | 2000 | ¥29,000 | 4.29 | Urban Terminal |
| 19 | RIHGA Royal Hotel Osaka, Vignette Collection (リーガロイヤルホテル大阪ヴィニェット コレクション) | Kita, Osaka | 1,001 | 1965 | — | 3.69 | Urban Terminal |
| 20 | Toyoko Inn Chubu International Airport No.1 (東横INN中部国際空港1) | Tokoname, Aichi | 1,001 | 2007 | ¥7,100 | 3.98 | Airport-Adjacent |
| 21 | APA Hotel Roppongi SIX (アパホテル〈六本木SIX〉) | Minato, Tokyo | 1,001 | 2020 | ¥11,800 | 3.84 | Urban Terminal |
| 22 | APA Hotel & Resort Niigata Ekimae Odori (アパホテル&リゾート〈新潟駅前大通〉) | Chuo-ku, Niigata | 1,001 | 2022 | ¥7,200 | 3.86 | Urban Terminal |
| 23 | Miyako Hotel Kyoto Hachijo (都ホテル 京都八条) | Minami-ku, Kyoto | 988 | 1975 | ¥19,200 | 4.27 | Urban Terminal |
| 24 | Hotel Gracery Shinjuku (ホテルグレイスリー新宿) | Shinjuku, Tokyo | 970 | 2015 | ¥35,100 | 4.30 | Urban Terminal |
| 25 | Hotel New Hankyu Osaka (大阪新阪急ホテル) | Kita, Osaka | 961 | 1964 | — | 3.91 | Urban Terminal |
| 26 | Keikyu EX Hotel Shinagawa (京急EXホテル品川) | Minato, Tokyo | 935 | 2011 | — | — | Urban Terminal |
| 27 | Shinagawa Prince Hotel East Tower (品川プリンスホテル イーストタワー) * Listed separately from Shinagawa Prince Hotel. | Minato, Tokyo | 919 | 1978 | ¥17,000 | 3.47 | Urban Terminal |
| 28 | APA Hotel & Resort Midosuji Hommachi Eki Tower (アパホテル&リゾート〈御堂筋本町駅タワー〉) | Chuo, Osaka | 913 | 2019 | ¥9,900 | 4.16 | Urban Terminal |
| 29 | Sotetsu Grand Fresa Tokyo-Bay Ariake (相鉄グランドフレッサ 東京ベイ有明) | Koto, Tokyo | 912 | 2009 | ¥15,600 | 3.56 | Urban Terminal |
| 30 | Grand Prince Hotel Shin Takanawa (グランドプリンスホテル新高輪) | Minato, Tokyo | 908 | 1982 | ¥32,700 | 4.06 | Urban Terminal |
Source: Compiled by HotelBank Editorial Team from MetroEngines Research (population N=886 properties / 250+ rooms, based on confirmed OTA listings)
Looking at the list, 26 of the top 30 are concentrated in the Tokyo, Osaka, Chiba, Aichi and Kanagawa metropolitan areas. Outside them, Niigata Prefecture contributes two properties — Naeba Prince Hotel (1,216 rooms) and APA Hotel & Resort Niigata Ekimae Odori (1,001 rooms) — and Fukuoka Prefecture contributes Hilton Fukuoka Sea Hawk (1,052 rooms), showing that 1,000-room-class hubs exist in the regions as well.
Opening years are also telling. Of the top 30, 11 opened in 2015 or later, 10 of them in 2019 or later. Large tower hotels continue to be supplied, and APA Hotel & Resort Osaka Namba Ekimae Tower (2,055 rooms, 40 floors above ground), which opened in December 2024, already ranks third. Ongoing large-scale development shows that operators see growth potential in “locations that can absorb a large volume of rooms at once.”
Okinawa Top 20 — Largest Has 826 Rooms; Only 3 Exceed 500
Next, Okinawa Prefecture. There are 48 properties in scope (250+ rooms), of which 34 have 300 or more rooms. However, only 3 exceed 500 rooms — a thin layer of large properties compared with 42 in Tokyo and 21 in Chiba. One likely reason is that resort sites offer plenty of land, so low-rise, multi-building designs tend to be chosen.
| Rank | Property | Municipality | Rooms | Opened | Est. Settled ADR | Rating | Location Type |
|---|---|---|---|---|---|---|---|
| 1 | Rizzan Sea-Park Hotel Tancha Bay (リザンシーパークホテル谷茶ベイ) | Onna | 826 | 1993 | ¥12,200 | 3.89 | Resort |
| 2 | Loisir Hotel Naha (ロワジールホテル 那覇) | Naha | 533 | 1993 | ¥11,300 | 3.44 | Airport-Adjacent |
| 3 | Okinawa Kariyushi Beach Resort Ocean Spa (沖縄かりゆしビーチリゾート・オーシャンスパ) | Onna | 516 | 1987 | ¥13,000 | 3.23 | Resort |
| 4 | Grand Mercure Okinawa Cape Zanpa Resort (グランドメルキュール沖縄残波岬リゾート) | Yomitan | 465 | 1988 | ¥21,600 | 4.02 | Resort |
| 5 | ANA InterContinental Ishigaki Resort (ANAインターコンチネンタル石垣リゾート) | Ishigaki | 458 | 1988 | ¥31,000 | 3.69 | Resort |
| 6 | Southern Beach Hotel & Resort Okinawa (サザンビーチホテル&リゾート沖縄) | Itoman | 448 | 2009 | ¥13,900 | 3.84 | Resort |
| 7 | Ryukyu Hotel & Resort Nashiro Beach (琉球ホテル&リゾート名城ビーチ) | Itoman | 443 | 2022 | ¥26,700 | 4.36 | Resort |
| 8 | The Busena Terrace (ザ・ブセナテラス) | Nago | 410 | 1997 | — | 4.52 | Regional/Other |
| 9 | ANA InterContinental Manza Beach Resort (ANAインターコンチネンタル万座ビーチリゾート) | Onna | 400 | 1983 | ¥28,200 | 4.03 | Resort |
| 10 | Fusaki Beach Resort Hotel & Villas (Ishigaki) (フサキビーチリゾート ホテル&ヴィラズ(石垣島)) | Ishigaki | 398 | 1982 | ¥24,600 | 4.22 | Resort |
| 11 | Hotel Nikko Alivila Yomitan Resort Okinawa (ホテル日航アリビラ -ヨミタンリゾート沖縄-) | Yomitan | 396 | 1994 | ¥24,400 | 4.29 | Resort |
| 12 | Pacific Hotel Okinawa (パシフィックホテル沖縄) | Naha | 389 | 1973 | ¥6,700 | 3.90 | Airport-Adjacent |
| 13 | Renaissance Okinawa Resort (ルネッサンスリゾートオキナワ) | Onna | 377 | 1988 | ¥36,900 | 3.79 | Resort |
| 14 | THE NEST NAHA (THE NEST那覇) | Naha | 366 | 2025 | ¥14,100 | 4.48 | Airport-Adjacent |
| 15 | APA Hotel Naha Matsuyama (アパホテル〈那覇松山〉) | Naha | 361 | 2007 | ¥8,100 | 3.78 | Airport-Adjacent |
| 16 | Oriental Hotel Okinawa Resort & Spa (オリエンタルホテル 沖縄リゾート&スパ) | Nago | 361 | 2021 | ¥27,600 | 4.38 | Resort |
| 17 | Halekulani Okinawa (ハレクラニ沖縄) | Onna | 360 | 2019 | ¥57,800 | 4.79 | Resort |
| 18 | Okinawa Harbor View Hotel (沖縄ハーバービューホテル) | Naha | 352 | 1975 | ¥13,000 | 4.27 | Airport-Adjacent |
| 19 | Hilton Okinawa Chatan Resort (ヒルトン沖縄北谷リゾート) | Chatan | 346 | 2014 | ¥40,000 | 4.54 | Resort |
| 20 | Hyatt Regency Seragaki Island Okinawa (ハイアット リージェンシー 瀬良垣アイランド 沖縄) | Onna | 343 | 2018 | ¥40,700 | 4.61 | Resort |
Source: Compiled by HotelBank Editorial Team from MetroEngines Research (Okinawa Prefecture population N=48 properties / 250+ rooms, based on confirmed OTA listings)
The largest, Rizzan Sea-Park Hotel Tancha Bay (826 rooms), opened in 1993 and is one of the largest resorts in the prefecture, publishing a site area of 43,281 square meters and a capacity of 2,600 guests. It is followed by No. 2 Loisir Hotel Naha (533 rooms) and No. 3 Okinawa Kariyushi Beach Resort Ocean Spa (516 rooms) in the 500-room range; from No. 4 onward, counts drop into the 400s.
The geographic distribution is also distinctive. The 34 properties with 300+ rooms break down into 9 in Naha, 8 in Onna Village, and 3 each in Ishigaki and Miyakojima. The result is a two-pole structure: city hotels in Naha with strong airport access, and beach resorts along the west-coast resort strip in Onna and Yomitan. The split is clear in rates as well: Pacific Hotel Okinawa in Naha has an estimated settled ADR of about ¥6,700, while Halekulani Okinawa in Onna is about ¥57,800 — a gap of more than 8x within the same prefecture. Room-count rank and rate rank do not line up at all.
Remote-island resorts are also significant. On Ishigaki, ANA InterContinental Ishigaki Resort (458 rooms) and Fusaki Beach Resort Hotel & Villas (398 rooms), plus three properties in Miyakojima, show that 400-room-class capacity is developing beyond the main island. It is also notable that Hilton Okinawa Chatan Resort (346 rooms, rating 4.54) and Hyatt Regency Seragaki Island Okinawa (343 rooms, rating 4.61) maintain high ratings even in the 300-room range.
Four Conditions for Big Hotels — Airports, Urban Terminals, Resorts and Theme Parks
So where do large hotels stand? We classified the 546 properties with 300+ rooms into location types based on the distance from each property’s coordinates to the nearest airport and theme park, together with property type. Properties within 6 km of an airport are “Airport-Adjacent”; those within 4 km of a major theme park are “Theme Park-Adjacent”; other resort or ryokan-type properties are “Resort”; properties in the urban areas of major metropolitan regions are “Urban Terminal”; and regional-city locations that fit none of these are “Regional/Other.”
| Location Type | Properties | Total Rooms | Median Size | Median Est. Settled ADR | Median Rating |
|---|---|---|---|---|---|
| Urban Terminal | 369 | 175,767 | 384 | ¥15,600 (n=325) | 4.1 (n=360) |
| Airport-Adjacent | 52 | 24,206 | 372 | ¥13,600 (n=50) | 4.08 (n=51) |
| Theme Park-Adjacent | 30 | 15,941 | 491 | ¥23,500 (n=23) | 4.29 (n=28) |
| Resort | 56 | 24,045 | 369 | ¥18,200 (n=56) | 3.89 (n=56) |
| Regional/Other | 39 | 14,447 | 351 | ¥7,800 (n=38) | 3.94 (n=39) |
Source: Compiled by HotelBank Editorial Team from MetroEngines Research (300+ rooms, N=546 properties)
Urban Terminal has the most properties, with 369 properties and 175,767 rooms in total — two-thirds of the whole. Filling that many rooms requires steady business demand plus event demand, and the pulling power of rail terminals underpins it. For when those large room volumes actually sell through, Do Big Hotels Fill Last? examines inventory absorption speed by room-count band.
Rates tell a different story. Theme Park-Adjacent has the highest median estimated settled ADR at ¥23,500, and its median size of 491 rooms is also the largest of the four types. Because trip purpose is clear and stays are mostly by families and groups, more guests share each room, allowing rate and scale to coexist. Its median rating of 4.29 is also the highest of the four types, as the experience of being right next to the destination feeds directly into satisfaction. Properties around Tokyo Disney Resort and Universal Studios Japan make up this group.
Airport-Adjacent has 52 properties with a median ADR of ¥13,600, serving demand where “being sure of a bed” comes first — the night before a flight or between connections. Because location certainty is itself the reason guests choose these hotels, the median rating of 4.08 is nearly level with Urban Terminal (4.10), indicating high satisfaction for the purpose. Several 1,000-room-class properties stand around Haneda, Narita and Chubu airports; Villa Fontaine Grand Haneda Airport (1,557 rooms; 1,717 rooms in total with its adjacent sister property, as published) and Toyoko Inn Chubu International Airport No.2 (1,287 rooms) are representative examples.
Resort has 56 properties with a median ADR of ¥18,200. High-rate properties dominate the top of this group, yet the median sits only slightly above Urban Terminal, indicating wide rate dispersion within this layer.
Source: Compiled by HotelBank Editorial Team from MetroEngines Research (500+ rooms, N=140 properties)
Plotting the 140 properties with 500+ rooms on a map makes the skew obvious. They cluster in five groups — Tokyo Bay (Haneda, Maihama, Ariake), Osaka (Umeda, Namba, Universal City), Nagoya and Chubu Airport, Sapporo, and Fukuoka — with almost nothing in between. Circle size shows room count and color shows location type.
Scale Does Not Lower Rates — A Correlation of 0.05
A common view in the industry is that “the more rooms a hotel has, the lower its rate” — the logic being that it must cut prices to fill all those rooms. The data does not support this.
For the 492 properties with 300+ rooms for which estimated settled ADR could be calculated, the correlation coefficient between room count and ADR is r=0.05 — virtually no correlation. Between room count and guest rating, across 534 properties, r=0.02, again showing no relationship.
Source: Compiled by HotelBank Editorial Team from MetroEngines Research (N=492 properties)
The pattern holds when medians are lined up by size band: ¥15,300 for 300–499 rooms, ¥16,400 for 500–799 rooms and ¥17,000 for 800–1,199 rooms — if anything, slightly higher as scale increases. The 12 properties with 1,200+ rooms drop to ¥13,900, but this reflects the concentration of limited-service airport hotels in this band and should be read separately from any effect of scale itself. When smaller properties below 300 rooms are included, the relationship between room count and ADR differs by property type; a size band alone does not determine rate.
Source: Compiled by HotelBank Editorial Team from MetroEngines Research (300+ rooms, N=546 properties)
Ratings follow suit: medians by size band are 4.08 / 4.09 / 4.02 / 3.98, essentially flat. The conventional wisdom that “large hotels deliver standardized service” cannot be confirmed at the level of review scores.
So what determines rates? The answer is location type. The median ADR across the four location types above ranged from ¥7,800 for Regional/Other to ¥23,500 for Theme Park-Adjacent — a gap of roughly 3x. Whereas scale has almost no effect, location type produces a threefold difference. What drives big-box profitability is not the volume of rooms but which demand those rooms are connected to.
Source: Compiled by HotelBank Editorial Team from MetroEngines Research (300+ rooms, N=546 properties)
Capacity by Prefecture — Eight Prefectures Have None Above 300 Rooms
When assessing a region’s potential to attract group tours, MICE and large events, what matters is how many properties of what size it has. We counted properties with 300+ and 500+ rooms by prefecture.
Source: Compiled by HotelBank Editorial Team from MetroEngines Research (300+ rooms, N=546 properties)
| Prefecture | 300+ Rooms | Of Which 500+ | Total Rooms (300+ Properties) |
|---|---|---|---|
| Tokyo | 116 | 42 | 63,453 |
| Osaka | 105 | 27 | 49,373 |
| Hokkaido | 50 | 10 | 20,327 |
| Chiba | 38 | 21 | 22,317 |
| Okinawa | 34 | 3 | 13,020 |
| Aichi | 24 | 7 | 11,719 |
| Kyoto | 24 | 4 | 9,939 |
| Fukuoka | 23 | 7 | 9,731 |
| Kanagawa | 21 | 5 | 10,669 |
| Hyogo | 11 | 2 | 4,612 |
| Niigata | 10 | 3 | 5,057 |
| Hiroshima | 9 | 2 | 4,022 |
| Shizuoka | 8 | 0 | 2,933 |
| Miyagi | 6 | 1 | 2,256 |
| Ishikawa | 6 | 2 | 2,585 |
| Saitama | 5 | 0 | 1,706 |
| Okayama | 5 | 0 | 1,603 |
| Tochigi | 4 | 0 | 1,460 |
| Kumamoto | 4 | 0 | 1,452 |
| Nagasaki | 4 | 0 | 1,425 |
Source: Compiled by HotelBank Editorial Team from MetroEngines Research (300+ rooms N=546 properties; 500+ rooms N=140 properties; top 20 prefectures shown)
Tokyo has the most, with 116 properties and 63,453 rooms, followed by Osaka with 105 properties and 49,373 rooms. These two alone account for 40% of properties with 300+ rooms and 44% of their total rooms. Next come Hokkaido (50 properties), Chiba (38) and Okinawa (34).
Narrowing to 500+ rooms, the concentration intensifies: Tokyo 42, Osaka 27, Chiba 21 and Hokkaido 10 — these four prefectures alone hold 100 of the 140 properties. Chiba has more than twice as many as Hokkaido because it hosts two large clusters: the Narita Airport area and the Maihama area.
On the other hand, eight prefectures have not a single property with 300+ rooms (Aomori, Akita, Yamagata, Ibaraki, Gifu, Tokushima, Kochi and Saga). A further eight have only one such property, meaning that in 16 prefectures in total, lodging for 300-person-scale groups depends on just one or two properties. Accommodation capacity effectively acts as a constraint when selecting host cities for large academic conferences and national conventions.
That said, this also means there is considerable room for operational design, such as distributed hosting or cooperation with neighboring prefectures. Quite a few prefectures — such as Kumamoto, Nagasaki, Ehime and Toyama, each with four 300+ room properties — can secure around 1,300 rooms by combining several properties. If capacity is designed around an area’s overall room pool rather than the size of any single hotel, the range of feasible host regions is wider than the headline numbers suggest.
Summary
Our analysis points to four findings.
First, properties with more than 1,000 rooms are extremely limited: 22 nationwide. The largest is Shinagawa Prince Hotel at 2,384 rooms (the operator reports 3,679 rooms across the whole complex), while as a single building APA Hotel & Resort Yokohama Bay Tower, at 2,311 rooms, is described by its operator as having the most rooms in Japan.
Second, Okinawa has 34 properties with 300+ rooms — the 5th-deepest layer in Japan — yet only 3 exceed 500. Its structure is two-polar, with city hotels in Naha and beach resorts in Onna and Yomitan, and estimated settled ADR ranges more than 8x within the same prefecture.
Third, there is almost no correlation between scale and rate or rating (r=0.05 and r=0.02 respectively). Instead, location type produces a rate gap of about 3x. That Theme Park-Adjacent is both the highest-rated and the largest — a type that “combines volume and rate” — is a meaningful signal for development and investment decisions.
Fourth, while eight prefectures have no property with 300+ rooms, many prefectures can secure several hundred rooms by combining multiple properties. Capacity for large-scale demand should be viewed in terms of an area’s room pool, not the size of a single hotel.
A room-count ranking shows not only “which hotels are biggest” but also “what demand supports that scale.” The most practical conclusion from this data is that the value of a big hotel lies not in its room count itself but in the depth of demand its location connects to.
Frequently Asked Questions
Which hotel in Japan has the most rooms?
By major-OTA listing unit (one building / one property), Shinagawa Prince Hotel has the most, with 2,384 rooms. However, it is a complex made up of the Main Tower, Annex Tower, N Tower and East Tower, and the operator reports 3,679 rooms for the complex as a whole. As a single building, APA Hotel & Resort Yokohama Bay Tower (2,311 rooms) is described by its operator as having the most rooms in Japan for a single building.
How many hotels in Japan have more than 1,000 rooms?
Within this article’s population (886 properties listed on major OTAs for which we hold room-count data), there are 22. There are 546 properties with 300+ rooms and 140 with 500+, so 1,000-room-class hotels are a very small share of the total. This is not a census, so properties not listed on OTAs are not included.
Which hotel in Okinawa has the most rooms?
Rizzan Sea-Park Hotel Tancha Bay (Onna Village, 826 rooms, opened 1993), followed by Loisir Hotel Naha (533 rooms) and Okinawa Kariyushi Beach Resort Ocean Spa (516 rooms). Okinawa has the 5th-deepest layer in Japan with 34 properties of 300+ rooms, but only 3 exceed 500 rooms.
Do hotels with more rooms charge lower rates?
Not according to the data. Among the 492 properties with 300+ rooms for which estimated settled ADR could be calculated, the correlation between room count and ADR was r=0.05, and the correlation with guest rating across 534 properties was r=0.02 — virtually none. Rates are driven by location type rather than scale: the median for Theme Park-Adjacent properties is ¥23,500 versus ¥7,800 for Regional/Other, a gap of about 3x.
Are there prefectures with no hotel of 300+ rooms?
Yes, eight: Aomori, Akita, Yamagata, Ibaraki, Gifu, Tokushima, Kochi and Saga. Another eight prefectures have only one property with 300+ rooms, so in 16 prefectures in total, lodging for 300-person-scale groups depends on one or two properties. On the other hand, prefectures such as Kumamoto, Nagasaki, Ehime and Toyama can secure around 1,300 rooms by combining several properties.
Related Articles
References and Sources
■ Data Sources
Room counts, locations, opening years and guest ratings come from property data collected and maintained by us. Listing status is based on public information from major OTAs (886 properties observed as listed on 20 or more check-in dates for June–July 2026 check-ins). Estimated settled ADR is an estimate derived by applying a property-type adjustment factor to each property’s lowest published OTA plan rate (median of monthly values over the most recent 12 months, September 2025 – August 2026). Room counts for top-ranked properties were individually checked against operators’ published materials.
■ Calculation Assumptions
The unit of count is the unit listed as one accommodation property on OTAs (one building / one property). Location types are derived from property coordinates: within 6 km of an airport = Airport-Adjacent; within 4 km of a major theme park = Theme Park-Adjacent; other resort or ryokan-type properties = Resort; urban locations in major metropolitan areas = Urban Terminal; regional-city locations that fit none of these = Regional/Other. Correlation coefficients are Pearson correlations over the 492 properties for which estimated settled ADR could be calculated (534 properties with accumulated reviews for ratings).
■ Limitations
This is not a census. Properties not listed on OTAs, or whose listings could not be confirmed, are not in the population, and rankings are relative within the range we track. Room counts for multi-tower complexes may not match the whole-complex totals published by operators; such properties are annotated in the tables. Estimated settled ADR is an estimate with a median error of about 7% when checked against property-level results disclosed by listed hotel REITs (91 properties, most recent 3 months), and differs from each property’s actual settled prices and accounting figures. Correlation, or its absence, does not indicate causation.
■ Market Data
- MetroEngines Research — room-count master, estimated settled ADR, OTA listing status (population N=886 properties)
■ Operator Publications (used to verify room counts)
- APA Hotel Co., Ltd., “One of Japan’s Largest With 2,311 Rooms: APA Hotel & Resort Yokohama Bay Tower Opens Today” (press release, Japanese)
- APA Hotel Co., Ltd., “One of Western Japan’s Largest With 2,055 Rooms: APA Hotel & Resort Osaka Namba Ekimae Tower Opens Today” (press release, Japanese)
- APA Hotel Co., Ltd., “One of Western Japan’s Largest With 1,704 Rooms: APA Hotel & Resort Osaka Umeda Eki Tower Opens Today” (press release, Japanese)
- Shinagawa Prince Hotel official website
- Keio Plaza Hotel company profile
- Sumitomo Realty & Development, “1,717 Rooms in Total: Villa Fontaine Premier Haneda Airport and Grand Haneda Airport” (release PDF, Japanese)
- Hotel New Otani Tokyo official website
- Hotel Ours Inn Hankyu official website
- Rizzan Sea-Park Hotel Tancha Bay, “About Rizzan”
- Okinawa Kariyushi Beach Resort Ocean Spa official website
- Loisir Hotel & Spa Tower Naha official website
Source: Hyatt Hotels Japan, “Press Releases, April 2026”
Source: Hilton, “Company Overview” (updated August 25, 2026)