

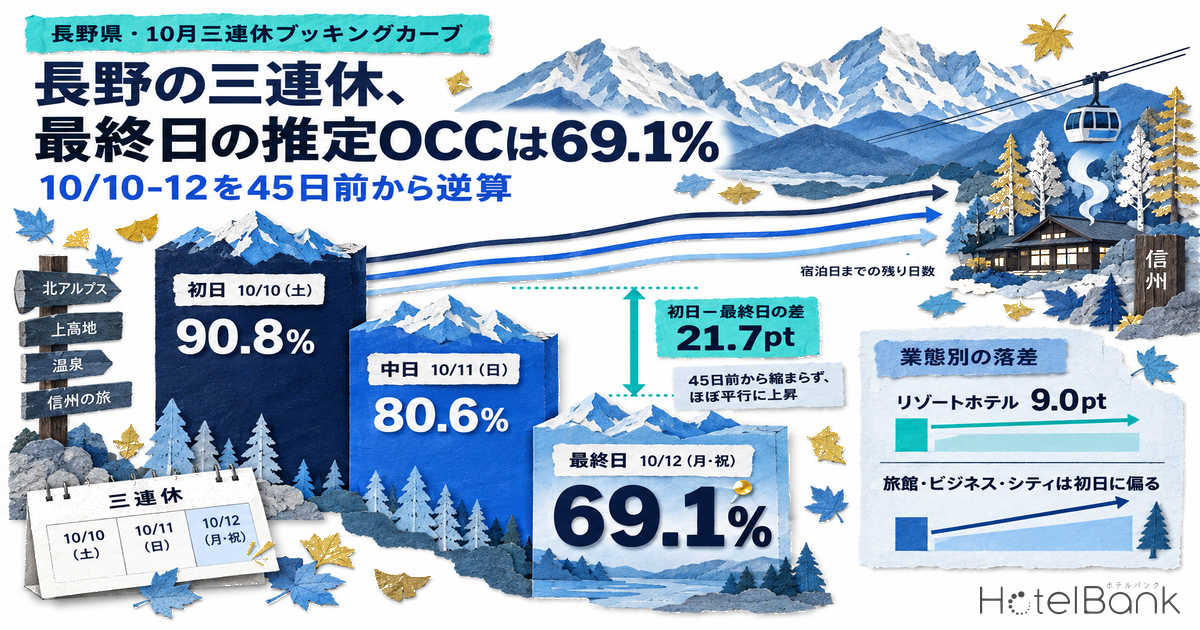
In Nagano Prefecture, the three nights of the Saturday, October 10 to Monday, October 12, 2026 holiday weekend (the Monday is Sports Day) are not the same product. Tracing the booking curve from 45 days before each stay date to the latest observation, estimated OCC (OTA listed-inventory basis) as of the September 20, 2026 observation stood at 90.8% for the first night and 69.1% for the final night. That 21.7pt gap has not narrowed from the 19.8pt recorded 45 days out (observed August 26–28) — if anything it has widened slightly. In other words, the expectation that “the final night catches up later” has not yet shown up in the data for Nagano this time. This article breaks the three-night curve down by property type, sets it against the same pattern observed in the most recent month with final figures, and lays out what revenue managers running properties in Nagano can still move in the time remaining.
Scope: a fixed cohort of Nagano Prefecture properties listed on major booking sites. All properties N=708 properties / 22,259 rooms (709 / 22,358 for October 12); ryokan N=280 / 6,571 rooms (281 / 6,643 for October 12); business hotels N=83 / 7,406 rooms; resort hotels N=64 / 4,355 rooms (65 / 4,394 for October 12); city hotels N=15 / 1,446 rooms. The price metric in this article is estimated settled ADR (the transaction price level estimated from OTA and other sales data, tax-excluded equivalent); occupancy is an estimate based on OTA-listed inventory. Both definitions appear at the end of the article. Data as of: September 21, 2026.
- — At the latest cross-section (observed September 20, 2026), Nagano’s October 2026 holiday weekend steps down night by night: 90.8% for the first night, 80.6% for the middle night and 69.1% for the final night. The 21.7pt first-to-final gap has not narrowed from 19.8pt at 45 days out.
- — Pickup was nearly identical across the three nights, at +8.7 to +10.6pt. The gap persists because the starting points 45 days out were already about 20pt apart — no spillover from the first night into later nights has been observed.
- — The first-to-final drop is small only for resort hotels, at 9.0pt, versus 23.8pt for ryokan, 24.8pt for business hotels and 26.6pt for city hotels. The July 2026 holiday weekend, now final, showed the same order (resorts smallest at 10.6pt).
- — In rooms, all properties had 2,055 rooms left for the first night versus 6,898 for the final night (3.4x). Business hotels have 2,158 rooms and ryokan 2,111 rooms still open on the final night — the larger the property, the larger the absolute volume to move.
- — The price benchmark comes from final months. Estimated settled ADR for October 2025 was ¥12,800 for ryokan, ¥16,600 for resorts, ¥7,800 for business hotels and ¥13,300 for city hotels, with all four types closing above the prior-year month.
The Three-Night Curve: First-to-Final Gap Has Barely Moved Since 45 Days Out
Start with the all-property cohort (N=708 properties, 22,259 rooms) and line up the three nights. At the observation 45 days before each stay date (August 26 for October 10), the first night was at 80.2%, the middle night at 71.2% and the final night at 60.4%. By the latest cross-section (20 days out for October 10, 21 for October 11 and 22 for October 12, all observed September 20), the first night had picked up +10.6pt, the middle night +9.4pt and the final night +8.7pt. The pickup itself is similar across all three nights. The gap does not close because the starting points 45 days out were already about 20pt apart.
Source: MetroEngines Research; compiled by HotelBank Editorial Team
The three lines never cross; they rise almost in parallel. The in-weekend spillover that revenue management practice often counts on — “once the first night fills, demand overflows into the final night” — has not been observed, at least at around 20 days out. If inventory and prices are held on the assumption that demand will eventually roll over to the final night, the current curve says the property will most likely run the remaining three weeks exactly as it is. The same pattern of date-to-date gaps that do not close even close to arrival was also observed for Nagano in September, in Nagano September: Wed 58.7% vs Holiday Sat 93.0%, 34pt Gap Holds.
| Property type (N=properties / rooms) | Oct 10 (Sat) 45 days out → latest |
Oct 11 (Sun) 45 days out → latest |
Oct 12 (Mon, holiday) 45 days out → latest |
First − final night (latest cross-section) |
|---|---|---|---|---|
| All properties (708 / 22,259) | 80.2% → 90.8% | 71.2% → 80.6% | 60.4% → 69.1% | 21.7pt |
| Ryokan (280 / 6,571) | 83.4% → 92.0% | 74.2% → 80.9% | 59.7% → 68.2% | 23.8pt |
| City hotels (15 / 1,446) | 89.3% → 98.4% | 78.1% → 87.6% | 63.3% → 71.8% | 26.6pt |
| Business hotels (83 / 7,406) | 82.2% → 95.7% | 71.7% → 83.2% | 59.9% → 70.9% | 24.8pt |
| Resort hotels (64 / 4,355) | 76.7% → 85.9% | 72.3% → 82.0% | 69.2% → 76.9% | 9.0pt |
Estimated OCC (OTA listed-inventory basis). The latest cross-section is 20 days out for Oct 10, 21 for Oct 11 and 22 for Oct 12 (all observed September 20, 2026). Source: MetroEngines Research; compiled by HotelBank Editorial Team
The most advanced figure is the city-hotel first night, at 98.4%. However, Nagano’s city-hotel segment covers only 15 properties and 1,446 rooms, a small base where inventory moves at a handful of properties can shift the rate by several points, so it should be read with that discount. The segment to watch for volume is business hotels (83 properties, 7,406 rooms): their first night rose +13.5pt from 82.2% at 45 days out to 95.7%, the strongest pickup of the four types. Their final night, by contrast, has only reached 70.9%, leaving a 24.8pt gap to the first night — wider than the all-property average.
How the Final Night Falls Splits by Property Type — Resorts Alone at 9.0pt
Re-arranging the latest cross-section by property type and date reveals a clear split. For ryokan, city hotels and business hotels, the first-to-final gap falls within 23.8–26.6pt; for resort hotels alone it is 9.0pt. On the level of the final night itself, resorts at 76.9% sit 8.7pt above ryokan at 68.2%. On the first night, conversely, resorts are the lowest at 85.9%. In short, resorts sell evenly across all three nights of the weekend, while the other types are heavily skewed toward the first night.
Source: MetroEngines Research; compiled by HotelBank Editorial Team
This difference is not a quirk of this particular weekend. Looking at Nagano’s July 2026 holiday weekend (July 18–20, final night Marine Day) — the most recent one whose stay dates have passed and whose actuals are final — the same order appears. The first-to-final drop was smallest for resort hotels at 10.6pt, followed by ryokan at 19.1pt, business hotels at 20.5pt and city hotels at 21.4pt. July shows actuals after the stay dates passed while October is a mid-sale cross-section, so the levels cannot be compared directly, but the ranking of property types by how far the final night falls is the same in both. The neighbouring prefecture of Yamanashi showed the same shape over this October weekend, with its holiday final night at 76.7% for resorts against 61.8% for ryokan and 64.3% for business hotels.
| Property type | Jul 18 (Sat) actual |
Jul 20 (Mon, holiday) actual |
Drop (actual) |
Oct 10 → Oct 12 drop (latest cross-section) |
|---|---|---|---|---|
| All properties | 98.8% | 80.8% | 18.0pt | 21.7pt |
| Ryokan | 98.8% | 79.7% | 19.1pt | 23.8pt |
| City hotels | 100.0% | 78.6% | 21.4pt | 26.6pt |
| Business hotels | 100.0% | 79.5% | 20.5pt | 24.8pt |
| Resort hotels | 96.8% | 86.2% | 10.6pt | 9.0pt |
July figures are actuals after the stay dates passed; October is a mid-sale cross-section, so levels cannot be compared directly. Properties covered: 552–563 (all properties) in July and 708–709 in October. Source: MetroEngines Research; compiled by HotelBank Editorial Team
There is one more respect in which July and October differ in shape. The July weekend held high for two consecutive nights — 98.8% for the first night and 97.4% for the middle night — and then only the final night fell off a cliff. The October weekend, by contrast, steps down across all three nights at the latest cross-section: 90.8% for the first night, 80.6% for the middle night and 69.1% for the final night. The middle night already being 10.2pt behind the first night means that demand is relatively thin not only for the final night but for the Sunday night as well. The current curve fits better with treating the holiday weekend not as “the first night plus two bonus nights” but as a set of dates that each need their own pricing and product design — first, middle and final night.
Final-Night Inventory in Rooms — 3.4x the First Night Across All Properties
Point gaps are ratios, so how many rooms are actually left depends on the scale of each property type. Converting the same September 20, 2026 cross-section from estimated OCC into listed rooms remaining makes the imbalance in what is still on the market clear. In the all-property cohort (708–709 properties), 2,055 rooms remained for the first night of October 10 and 6,898 for the final night of October 12. The final night has 3.4 times as much inventory still on the market as the first. By sell-out rate, 57.1% of properties had sold out the first night versus 18.1% for the final night — eight in ten properties still hold final-night availability.
| Property type | Oct 10 (Sat) | Oct 11 (Sun) | Oct 12 (Mon, holiday) | Final / first night remaining-room ratio |
|---|---|---|---|---|
| All properties | 2,055 rooms Remaining 9.2% · sold out 57.1% | 4,311 rooms Remaining 19.4% · sold out 34.6% | 6,898 rooms Remaining 30.9% · sold out 18.1% | 3.36x |
| Ryokan | 527 rooms Remaining 8.0% · sold out 66.8% | 1,254 rooms Remaining 19.1% · sold out 41.8% | 2,111 rooms Remaining 31.8% · sold out 24.6% | 4.01x |
| City hotels | 23 rooms Remaining 1.6% · sold out 60.0% | 179 rooms Remaining 12.4% · sold out 26.7% | 408 rooms Remaining 28.2% · sold out 6.7% | 17.7x |
| Business hotels | 321 rooms Remaining 4.3% · sold out 74.7% | 1,247 rooms Remaining 16.8% · sold out 26.5% | 2,158 rooms Remaining 29.1% · sold out 6.0% | 6.72x |
| Resort hotels | 614 rooms Remaining 14.1% · sold out 28.1% | 784 rooms Remaining 18.0% · sold out 28.1% | 1,016 rooms Remaining 23.1% · sold out 15.4% | 1.65x |
Listed rooms remaining are on an OTA listed-inventory basis. Remaining-room rate = listed rooms remaining ÷ total rooms; sell-out rate is the share of properties that had sold all listed inventory for that stay date. The latest cross-section is 20 days out for Oct 10, 21 for Oct 11 and 22 for Oct 12 (all observed September 20, 2026). Source: MetroEngines Research; compiled by HotelBank Editorial Team
By property type, resort hotels — already notable for their small drop — also have the smallest remaining-room ratio at 1.65x (614 rooms → 1,016 rooms), with inventory clearing evenly across the three nights. City hotels, by contrast, go from 23 rooms on the first night to 408 on the final night (17.7x), and business hotels from 321 to 2,158 (6.7x). Having all but sold out the first night, these properties carry heavy inventory on the final night; for the larger business hotels, the absolute volume to move in the remaining three weeks exceeds 2,000 rooms. Ryokan also go from 527 to 2,111 rooms (4.0x), with a first-night sell-out rate of 66.8% against just 24.6% for the final night. It is worth applying these ratio gaps to your own property’s size to see how many rooms that still leaves room to act on.
The Price Benchmark — Where Nagano’s October Landed on a Final Basis
Occupancy alone is not enough to make pricing decisions, so here is a benchmark on the rate side. Estimated settled ADR is canonical at the monthly level and cannot be split by day, but the final figures for past months show where Nagano’s October landed. Final figures for October 2025 were ¥12,800 for ryokan (N=499 properties), ¥16,600 for resort hotels (N=114), ¥7,800 for business hotels (N=162) and ¥13,300 for city hotels (N=16). Year-on-year changes were +5.5%, +9.1%, +6.6% and +26.7% respectively, so all four types closed above October 2024. City hotels, however, cover only 16 properties, a small base where changes in the property mix can easily move the ratio.
| Property type | Oct 2024 estimated settled ADR (final) |
Oct 2025 estimated settled ADR (final) |
YoY | N= (Oct 2025) |
|---|---|---|---|---|
| Ryokan | ¥12,149 | ¥12,820 | +5.5% | 499 properties |
| Resort hotels | ¥15,255 | ¥16,638 | +9.1% | 114 properties |
| Business hotels | ¥7,294 | ¥7,774 | +6.6% | 162 properties |
| City hotels | ¥10,504 | ¥13,305 | +26.7% | 16 properties |
Both columns compare final figures (past months). Source: MetroEngines Research; compiled by HotelBank Editorial Team
Layered year over year, October is not the annual peak for Nagano’s ryokan. In the final-figure series, August forms the summer peak and October sits a step below it. In 2026 the August final figure was ¥14,500 (N=515 properties), +1.1% year on year. The current estimate for October moves with sales conditions and cannot be used for level comparisons, but in terms of the monthly shape, the holiday weekend sits in a mid-tier month “between the August summer peak and the climb toward December” (in both the 2024 and 2025 final figures, October is below both August and December). That is exactly why missing out on the holiday weekend — one of the few dates in October that can command a rate — tends to drag down the average for the whole month.
Nagano Prefecture, ryokan. September–December 2026 are estimates based on current sales conditions (dotted line) and may change. Source: MetroEngines Research; compiled by HotelBank Editorial Team
For Revenue Managers Running Properties in Nagano — Implications and Action Plan
1. Read your own holiday-weekend curve against the market’s “staircase.” The market’s latest cross-section is 90.8% for the first night, 80.6% for the middle night and 69.1% for the final night (all properties). If, lining up your own bookings on the same three points, only the first night is at market level while the middle and final nights sit below it, that is most likely not a lack of demand but a distortion caused by selling all three nights on the same terms. Conversely, if all three nights are flatter than the market, a stay-oriented sales approach is already working.
2. Design the final night on the assumption that “waiting won’t bring demand.” The first-to-final gap of 19.8pt at 45 days out has widened to 21.7pt at the latest cross-section. In this curve there is no support for holding the final night in expectation of in-weekend spillover. Moving the final night requires changing the product, not waiting.
3. Resorts’ 9.0pt can be read as the difference made by selling multi-night stays. Resort hotels are flat, at 85.9% for the first night and 76.9% for the final night, and their drop over the July holiday weekend, now final, was also the smallest at 10.6pt. Inventory designed as 2–3 night stays rather than single nights is structurally less exposed to a weak final night. The 23.8–26.6pt drops for ryokan, business hotels and city hotels are the flip side of the same insight.
4. October is a month with few dates that can command a rate. On a final basis, Nagano ryokan have seen August form the summer peak and October land below it. From the standpoint of protecting the monthly average, holding the first-night rate while moving middle- and final-night inventory through a different sales approach is more likely to help the monthly close than selling all three nights cheaply as a bundle.
Below are concrete actions by time horizon. Every decision trigger is tied to a figure shown in this article.
| Time horizon | Action | Decision trigger | Aim |
|---|---|---|---|
| Today to this week (about 3 weeks left) | Break the three nights into three products rather than one, and set separate terms for the first, middle and final nights | Whether your three nights trace the same “staircase” as the market’s 90.8% / 80.6% / 69.1% — specifically, when only the first night is at market level and the later nights fall away | Protect the first-night rate while targeting a different demand segment for the two weaker nights |
| Today to this week | Put multi-night 2- and 3-night terms that include the final night up front, building a path that does not depend on single-night final-night inventory | When your final-night pace is below the market’s final-night level (69.1% all properties, 68.2% ryokan) | Move toward the resort-style approach that holds the drop to 9.0pt |
| Within 2 weeks (early October) | Package final-night late checkout and timing built around the journey home as added value rather than a discount | When the gap between your first and final nights is wider than the market’s 21.7pt (all properties) | Attract demand to the final night without cutting its rate |
| Within 2 weeks | Review how remaining inventory is released, night by night: restrict the first night and keep visible availability for the middle and final nights | When your first night has reached a level close to the market’s 98.4% (city hotels) or 95.7% (business hotels) | Keep room to shift the remaining first-night allocation to higher rate tiers |
| Toward next month (next holiday weekend) | For the November 21–23 holiday weekend (Labor Thanksgiving Day), set the terms for all three nights in advance, using October 7 — 45 days out — as the reference date | The fact that, this time, the first-to-final gap at 45 days out (19.8pt) barely narrowed afterward | Align preparation with the premise that a holiday weekend is decided early |
| Toward next month | Prepare a framework for reviewing October’s monthly close split into the contribution of the three holiday nights and of weekdays | Use the October 2025 final figure for Nagano ryokan, ¥12,820 (N=499 properties), as the reference point for positioning your property | Feed into next year’s October rate-change calendar |
Source: MetroEngines Research; compiled by HotelBank Editorial Team
Summary — Three Yardsticks for Reading a Holiday Weekend
Nagano’s October 2026 holiday weekend offers three yardsticks to take away. The first is “the gap at 45 days out.” The first-to-final gap was already 19.8pt at 45 days out and, at 21.7pt, has not narrowed at the latest cross-section. A holiday weekend is won or lost much earlier than one might think, and what can be done in the remaining period is not to close the gap but to switch to a sales approach that takes the gap as given.
The second is “the drop by property type.” The first-to-final drop is small for resort hotels at 9.0pt (10.6pt in July actuals) and large for ryokan at 23.8pt, business hotels at 24.8pt and city hotels at 26.6pt. This order matches between mid-sale October and final July, and can be read as a difference in product design: selling by the night versus selling by the stay.
The third is “position within the month.” On a final basis, Nagano’s October sits below the August peak, with few dates that can command a rate. October 2025 closed at ¥12,800 for ryokan, ¥16,600 for resorts, ¥7,800 for business hotels and ¥13,300 for city hotels (all final figures), with all four types above the prior-year month. The holiday weekend is one of the few dates that support that monthly figure, and not treating its three nights as a single product is the first step toward protecting the month’s close.
Frequently Asked Questions
Q. How full is the final night of Nagano’s October 2026 holiday weekend?
A. At the September 20, 2026 observation (22 days before the stay date), estimated OCC (OTA listed-inventory basis) for the all-property cohort of 709 properties in Nagano Prefecture was 69.1% for October 12. That is 21.7 points below the 90.8% for the first night of October 10, and the gap has not narrowed from 19.8 points at 45 days out. In listed rooms remaining, 2,055 rooms were left for the first night against 6,898 for the final night.
Q. Does the final-night drop differ by property type?
A. Yes. At the same cross-section, the first-to-final gap is smallest for resort hotels at 9.0 points (85.9% → 76.9%) and widens to 23.8 points for ryokan, 24.8 points for business hotels and 26.6 points for city hotels. The July 2026 holiday weekend, whose stay dates have passed and whose actuals are final, showed the same order, with resort hotels’ 10.6-point drop the smallest. It can be read as a difference in product design — selling by the night versus selling by the stay.
Q. Is there still anything to act on in the time remaining?
A. Because no in-weekend spillover has been observed in this curve, a plan that waits for final-night demand has no support in the data. The three levers for the remaining period are: put multi-night 2- and 3-night conditions that include the final night up front; keep room to restrict first-night inventory and shift it to higher rate tiers; and for the next holiday weekend (November 21–23, 2026), set the conditions for all three nights in advance, using October 7 — 45 days out — as the reference date.
About the Data
- Definition of estimated OCC (OTA listed-inventory basis): “OTA listed-inventory occupancy = 100 − 100 × OTA listed rooms remaining ÷ total rooms. Covers a fixed cohort of properties that list at least 30% of their total rooms on OTAs (the same set of properties for each stay date; the N= shown in this article is that property count). It is an estimate based on how inventory sold on OTAs is being absorbed and differs in definition from actual room occupancy (rooms not listed are counted on the absorbed side, so it reads higher).”
- Booking curves: based on observations from 45 days before the stay date to the latest.
- Definition of estimated settled ADR: the transaction price level (tax-excluded equivalent) estimated from OTA and other sales data (lowest-plan level × property-type coefficient, an ensemble across multiple channels). Past months are final figures; the current and future months are estimates based on current sales conditions. Median error against published operating results: 6.6%.
- Breakdown of N: booking curves use a fixed Nagano Prefecture cohort — all properties N=708 properties / 22,259 rooms (709 / 22,358 for October 12), ryokan N=280 / 6,571 rooms (281 / 6,643 for October 12), business hotels N=83 / 7,406 rooms, resort hotels N=64 / 4,355 rooms (65 / 4,394 for October 12), city hotels N=15 / 1,446 rooms. July 2026 actuals: all properties N=552–563, ryokan N=235–244, business hotels N=72–73, resort hotels N=57, city hotels N=14–15. Estimated settled ADR for October 2025 covers ryokan N=499, resort hotels N=114, business hotels N=162 and city hotels N=16. The year-over-year chart (ryokan) covers N=380–561 properties depending on the month.
- Holidays are identified from the Cabinet Office’s published “Concerning National Holidays” data (October 12, 2026 = Sports Day; November 23, 2026 = Labor Thanksgiving Day).
- Data as of: September 21, 2026. Sales conditions and inventory change daily, so the figures in this article are a snapshot at the time of retrieval.
References and Sources
■ Data sources
Booking curves and estimated OCC are MetroEngines Research proprietary data, compiled from daily observation of inventory listed on major booking sites in Nagano Prefecture. Estimated settled ADR is the monthly transaction price level estimated from the same sales data. Actuals for the July 2026 holiday weekend are observations finalised after the stay dates passed. Holidays are identified from Cabinet Office published data.
■ Calculation assumptions
Booking curves use only the lead-time window from 45 days before the stay date to the latest observation (observations beyond 45 days include the period before listing allocations build up and do not represent booking pace, so they are excluded). Each stay date uses a fixed cohort of the same set of properties, covering properties that list at least 30% of their total rooms on major booking sites. The latest cross-section is the September 20, 2026 observation, which is 20 days out for October 10, 21 for October 11 and 22 for October 12. Estimated settled ADR has the month as its smallest unit, so it is not broken down by day, and only final (past-month) levels are used as reference points.
■ Limitations and caveats
Estimated OCC is an estimate based on how listed inventory is being absorbed and differs in definition from actual room occupancy (rooms not listed are counted on the absorbed side, so it reads higher). City hotels cover only 15 properties and 1,446 rooms, a small base where inventory moves at a few properties can shift the figure by several points, so this segment should be read for direction of change rather than level. July 2026 figures are actuals after the stay dates passed while October is a mid-sale cross-section, so levels cannot be compared directly (this article compares only the ranking of drops). Estimated settled ADR for October is an estimate based on current sales conditions and is not used for level comparisons against final months. All figures in this article are a snapshot as of September 21, 2026 and change with sales conditions.
- Cabinet Office, “Concerning National Holidays (syukujitsu.csv)” https://www8.cao.go.jp/chosei/shukujitsu/syukujitsu.csv