

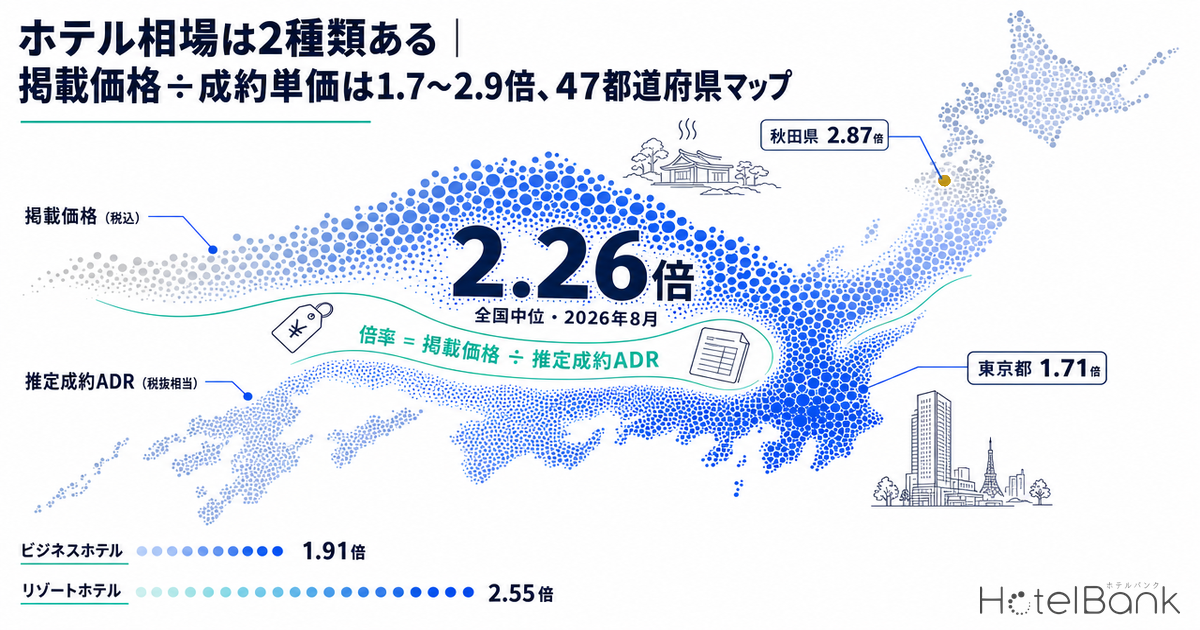
“Hotels in Tokyo go for around ¥20,000-something”; “Hakone runs in the ¥50,000s.” Most figures like these that circulate in market articles and the news are averages of the selling prices listed on booking sites. The room rates used in business plans, real estate appraisals and REIT disclosures, by contrast, are settled rates: what one room actually sold for. Both get called the “going rate,” yet their levels are completely different. Measured in August 2026, the gap was 2.26x at the national median, ranging from 1.71x to 2.87x depending on the prefecture.
This article compares two rate series, listed price and estimated settled ADR, across 47 prefectures × 4 property categories, and quantifies where the ratio between them grows largest. The aim is not to explain rate levels themselves, but to provide a yardstick for converting the numbers in circulation into numbers you can use for your own decisions.
Metric Definitions Used in This Article
- ADR (Average Daily Rate): An estimated settled rate (pre-tax equivalent), calculated by applying category-specific adjustment factors to each property’s lowest-plan level published on major booking sites (2 guests per room, per-room price, tax included). Checked against property-level results disclosed by listed hotel REITs (91 properties, most recent 3 months), the median error is about 7%. It is an estimate and differs from each property’s actual settled prices and accounting figures. Area-level ADR is the median of covered properties (the level of a typical property in the area). This article refers to it as “estimated settled ADR.”
- Listed price: The average price of all plans on sale on major booking sites. Per-room price for 2 guests (tax included), covering everything from room-only to meal-inclusive plans. At area level, it is the median of covered properties’ daily average prices. Every mention of “listed price” in this article refers to this series, and it is never called ADR.
- Ratio: Listed price ÷ estimated settled ADR. Because the two series treat tax differently (listed price includes tax; estimated settled ADR is a pre-tax equivalent), the ratio contains a basis difference of about 1.10x.
- Data source: MetroEngines Research. Reference month: August 2026 (finalized month).
- — National median 2.26x: the category-weighted ratio of listed price (tax included) ÷ estimated settled ADR (pre-tax equivalent), August 2026 (finalized month). It ranges from 1.71x in Tokyo to 2.87x in Akita, with 33 prefectures clustered at 2.1-2.5x.
- — Property category is the biggest driver: business hotels 1.91x, city hotels 2.08x, resort hotels 2.55x, ryokan 2.54x (median of prefecture × category cells; 16,273 properties in total).
- — About 1.10x is the tax-basis difference; on the same basis the real gap is about 2.06x. The category gap comes not from the spread of listed plans but from “lowest plan ÷ settled level” (0.94-0.95x in urban markets, 1.36-1.59x in hot-spring resorts).
- — Stable enough to use as a conversion factor: the national median ratio for business hotels stayed at 1.90-2.00x over the 13 months from July 2025 to August 2026. It is an area × category median, however, and should not be applied to individual properties.
- — Choose by purpose: use estimated settled ADR for business plans, appraisals and REIT comparisons, and listed price for pricing and competitor checks. Building room revenue on listed prices overstates it by roughly 2x.
There Are Two “Going Rate” Series: Listed Price and Estimated Settled ADR
MetroEngines Research tracks about 168,000 properties in Japan, of which about 27,000 properties (about 1.26 million rooms) with confirmed activity on major booking sites form the analysis universe. Two rate measures with different characteristics can be calculated from this population.
The first is listed price. For a given date, the prices of all plans a property is selling are averaged, these are accumulated by property and by day, and the area median is taken. Because it is the asking price actually on the market, it is the most straightforward indicator for seeing how rooms are priced and how deep the plan lineup is. But this average mixes in, with equal weight, high-priced peak-season plans, pre-holiday rates, and premium plans bundling meals or activities. A plan that remains listed because it has not sold also counts as one plan in the average.
The second is estimated settled ADR. Starting from each property’s lowest-plan level, the settled level is estimated by applying adjustment factors validated by property category, and data from two major booking sites are combined to stabilize it. Checked against the settled ADR that listed hotel REITs disclose by property (91 properties, most recent 3 months), the median error is about 7%, on a pre-tax equivalent basis. Because it corresponds to actual room revenue, this is the series to use for business plans, appraisals and REIT comparisons. The definition of ADR itself and its levels by category are covered in What Is Hotel ADR? Settled Rates vs Listed Prices and 2026 Levels by Category.
In other words, for the same area there are two answers at once: “the asking price on the market” and “the rate rooms actually sell at.” The problem is that the distance between the two differs greatly by area and by property category.
Ratio Map of 47 Prefectures: From 1.71x in Tokyo to 2.87x in Akita
We calculated the ratio for all 47 prefectures using finalized August 2026 data. One caution: the two series cover different sets of property categories. Listed price covers every tracked category, while estimated settled ADR is limited to validated categories: business, city, resort, ryokan and capsule. A simple comparison without aligning categories lets differences in category mix leak into the ratio.
This article therefore calculates the ratio by category and uses the average weighted by each category’s number of covered properties as the prefecture ratio. On this basis, the ratio peaks at 2.87x in Akita, bottoms out at 1.71x in Tokyo, and has a median of 2.26x. 33 of the 47 prefectures fall within the 2.1-2.5x range, so the distribution is fairly concentrated.
Source: MetroEngines Research; compiled by HotelBank Editorial Team
The top ranks are regional prefectures with a high share of ryokan: Akita 2.87x, Iwate 2.65x, Yamagata 2.59x and Kagoshima 2.59x. At the bottom are areas with deep urban lodging demand: Tokyo 1.71x, Osaka 1.73x, Kyoto 1.88x and Fukuoka 1.91x. In regional hot-spring and tourist destinations, taking listed price at face value as the “going rate” means looking at a number close to 3x the actual settled level.
Chiba shows the effect of aligning categories most clearly. A simple overall comparison without aligning categories gives Chiba a ratio of 3.47x, the highest in Japan (1,140 properties on the listed side, 422 on the settled side). Aligned and weighted by category, it falls to 2.16x, equivalent to 35th nationwide. The listed-price side includes accommodations priced per whole building or per party size; dividing directly by the settled side, which excludes them, inflates the ratio. When comparing ratios across areas, always align categories.
| # | Prefecture | Ratio (category-weighted) | Business | City | Resort | Ryokan | N (properties) |
|---|---|---|---|---|---|---|---|
| 1 | Akita | 2.87 | 1.94 | — | — | 3.49 | 149 |
| 2 | Iwate | 2.65 | 2.04 | — | — | 3.02 | 225 |
| 3 | Yamagata | 2.59 | 2.12 | — | — | 2.76 | 261 |
| 4 | Kagoshima | 2.59 | 2.00 | 2.48 | 3.00 | 3.54 | 319 |
| 5 | Fukushima | 2.55 | 2.16 | — | 3.11 | 2.73 | 427 |
| 6 | Shimane | 2.50 | 2.15 | — | — | 2.68 | 163 |
| 7 | Kochi | 2.47 | 1.91 | — | — | 3.38 | 106 |
| 8 | Ishikawa | 2.46 | 2.08 | — | — | 2.82 | 225 |
| 9 | Tottori | 2.45 | 1.78 | — | — | 2.92 | 130 |
| 10 | Miyazaki | 2.43 | 1.97 | 2.07 | — | 3.48 | 153 |
| 11 | Saga | 2.42 | 2.12 | — | — | 2.58 | 140 |
| 12 | Yamaguchi | 2.41 | 1.90 | — | — | 3.09 | 173 |
| 13 | Ehime | 2.40 | 2.09 | 2.31 | — | 2.84 | 203 |
| 14 | Nagano | 2.40 | 1.96 | — | 2.63 | 2.48 | 806 |
| 15 | Kumamoto | 2.35 | 1.97 | — | 2.88 | 2.50 | 381 |
| 16 | Ibaraki | 2.35 | 1.97 | — | — | 3.11 | 282 |
| 17 | Nagasaki | 2.34 | 1.93 | 2.13 | 2.62 | 3.05 | 257 |
| 18 | Nara | 2.33 | 1.83 | — | — | 2.52 | 118 |
| 19 | Toyama | 2.32 | 1.98 | — | — | 2.65 | 145 |
| 20 | Niigata | 2.31 | 1.90 | — | 2.82 | 2.45 | 401 |
| 21 | Hokkaido | 2.31 | 1.80 | 1.87 | 2.73 | 2.97 | 953 |
| 22 | Miyagi | 2.30 | 2.00 | 2.20 | — | 2.68 | 279 |
| 23 | Tokushima | 2.27 | 1.96 | — | — | 2.73 | 125 |
| 24 | Yamanashi | 2.26 | 1.90 | — | 2.40 | 2.38 | 294 |
| 25 | Shiga | 2.26 | 1.88 | — | — | 2.84 | 133 |
| 26 | Oita | 2.26 | 2.09 | — | 2.23 | 2.31 | 450 |
| 27 | Hyogo | 2.24 | 1.93 | 2.26 | 2.82 | 2.31 | 542 |
| 28 | Fukui | 2.22 | 2.02 | — | — | 2.29 | 195 |
| 29 | Mie | 2.22 | 1.79 | — | 2.56 | 2.35 | 338 |
| 30 | Wakayama | 2.22 | 2.06 | — | 2.24 | 2.32 | 212 |
| 31 | Gifu | 2.21 | 1.97 | — | — | 2.33 | 356 |
| 32 | Shizuoka | 2.21 | 1.90 | 2.34 | 2.39 | 2.29 | 865 |
| 33 | Aomori | 2.18 | 1.88 | — | — | 2.56 | 159 |
| 34 | Okayama | 2.18 | 1.85 | — | — | 2.71 | 154 |
| 35 | Chiba | 2.16 | 1.83 | 2.08 | 2.54 | 2.42 | 417 |
| 36 | Kagawa | 2.15 | 2.02 | — | — | 2.44 | 133 |
| 37 | Tochigi | 2.15 | 1.88 | — | 2.29 | 2.29 | 394 |
| 38 | Gunma | 2.12 | 1.91 | — | 2.23 | 2.18 | 414 |
| 39 | Okinawa | 2.10 | 1.69 | — | 2.38 | — | 478 |
| 40 | Aichi | 2.08 | 1.88 | 2.59 | — | 2.42 | 490 |
| 41 | Kanagawa | 2.02 | 1.71 | 2.05 | 2.53 | 2.17 | 572 |
| 42 | Hiroshima | 2.02 | 1.90 | 1.69 | — | 2.50 | 287 |
| 43 | Saitama | 1.92 | 1.83 | — | — | 2.22 | 190 |
| 44 | Fukuoka | 1.91 | 1.69 | 1.90 | — | 2.93 | 456 |
| 45 | Kyoto | 1.88 | 1.64 | 1.70 | — | 2.33 | 586 |
| 46 | Osaka | 1.73 | 1.66 | 1.82 | — | 2.53 | 636 |
| 47 | Tokyo | 1.71 | 1.64 | 1.87 | 2.21 | 2.29 | 1,101 |
Source: MetroEngines Research; compiled by HotelBank Editorial Team (August 2026, finalized month. Each category is aggregated only for cells with 20 or more covered properties. N is the total of covered properties across categories.)
Ratio by Property Category: Business Hotels 1.91x, Ryokan 2.54x
Property category is the strongest determinant of the ratio. Aggregating category-level data for the 47 prefectures produces a neat progression.
| Category | Listed price (median, tax incl.) | Est. settled ADR (median, pre-tax equiv.) | Ratio (median) | Ratio IQR | Ratio min-max | Coverage |
|---|---|---|---|---|---|---|
| Business hotels | ¥15,501 | ¥7,900 | 1.91x | 1.83-2.00 | 1.64-2.16 | 47 pref. / 7,428 |
| City hotels | ¥29,420 | ¥13,421 | 2.08x | 1.87-2.31 | 1.69-2.59 | 16 pref. / 730 |
| Resort hotels | ¥52,554 | ¥20,646 | 2.55x | 2.29-2.82 | 2.20-3.11 | 19 pref. / 1,333 |
| Ryokan | ¥37,931 | ¥14,666 | 2.54x | 2.33-2.84 | 2.17-3.54 | 46 pref. / 6,782 |
Source: MetroEngines Research; compiled by HotelBank Editorial Team (August 2026. Prefecture × category cells with 20 or more covered properties.)
Business hotels have a median of 1.91x, with a narrow interquartile range of 1.83-2.00x. Their median listed price is ¥15,500 and median estimated settled ADR ¥7,900. The ratio widens step by step: city hotels 2.08x, resort hotels 2.55x, and ryokan 2.54x. The ryokan maximum is 3.54x, more than 1.6 times the minimum of 2.17x.
Source: MetroEngines Research; compiled by HotelBank Editorial Team
The practical implication is clear. In an area dominated by business hotels, reading listed price as a little under half gets you roughly to the settled level. Apply the same conversion to an area dominated by ryokan and resorts, however, and you overstate revenue by more than 30%. The rule of thumb of “roughly 2x everywhere” works for urban markets but not for hot-spring resorts.
Where Does the Ratio Come From? Breaking It Into Four Factors
We break down why the ratio varies by category and area into four factors.
Factor 1: Tax-basis difference (about 1.10x). Listed price includes tax, while estimated settled ADR is a pre-tax equivalent, the same basis as REIT disclosures. This definitional difference alone adds about 1.10x. Removing it from the national median of 2.26x leaves a real gap of about 2.06x on the same tax basis. When reading the ratio, it helps to mechanically strip out this 10% first.
Factor 2: Breadth of the listed plan price range. Because listed price averages all plans, properties listing many premium plans have an average far above their lowest plan. Measuring this spread as “all-plan average ÷ lowest plan” gives 1.41-1.70x in hot-spring/ryokan markets and 1.72-1.83x in urban business/city markets. Surprisingly, the plan spread itself is wider in urban markets. This factor cannot explain the category gap in the ratio.
Factor 3: Distance between the lowest plan and the settled level. This is what creates the category gap. “Lowest plan ÷ estimated settled ADR” is 0.94-0.95x in urban business/city markets, meaning the estimated settled level sits slightly above the lowest plan. Once the tax basis is aligned, actual settled levels in urban markets largely overlap with the range of lowest plans. In hot-spring/ryokan markets, by contrast, it is 1.36-1.59x: even the lowest plan sits at 1.4-1.6x the settled level.
| Market / category | (1) Plan price spread all-plan avg ÷ lowest plan | (2) Lowest-to-settled gap lowest plan ÷ est. settled ADR | Total ratio (1) × (2) | N (properties) |
|---|---|---|---|---|
| Hakone / Yugawara (ryokan & resort) | 1.61x | 1.36x | 2.16x | 107 |
| Beppu / Yufuin (ryokan & resort) | 1.70x | 1.37x | 2.33x | 105 |
| Kusatsu / Ikaho (ryokan & resort) | 1.41x | 1.59x | 2.24x | 113 |
| Osaka Umeda / Namba (business & city) | 1.77x | 0.94x | 1.65x | 104 |
| Tokyo Shinjuku / Shibuya (business & city) | 1.72x | 0.95x | 1.62x | 87 |
| Naha city center (business & city) | 1.83x | 0.94x | 1.68x | 82 |
Source: MetroEngines Research; compiled by HotelBank Editorial Team (August 2026, finalized month. Medians calculated at property level for properties of the relevant categories in each market.)
Source: MetroEngines Research; compiled by HotelBank Editorial Team
At urban business hotels, the lowest plan is not a limited allotment but close to the everyday best-seller, and most daily occupancy is sold around it. At ryokan, where one night with two meals is the norm, the listed plan lineup itself tends to skew toward pre-holiday, peak-season and premium-dining plans, so even the lowest listed plan sits above the actual average settled level. The category gap in the ratio is determined less by “what plans are listed” than by “where the lowest of those plans sits.”
Factor 4: The rate level itself. Even within the same category, the lower an area’s rates, the larger the ratio. The correlation coefficient between estimated settled ADR level and the ratio was −0.736 for ryokan, −0.660 for city hotels, −0.630 for business hotels and −0.530 for resort hotels, all clearly negative. In areas with thin demand, high-priced plans that stay listed without selling tend to push the average up, widening the distance between listed price and the settled level.
Source: MetroEngines Research; compiled by HotelBank Editorial Team
Category mix alone does not explain the ratio well. The correlation between each prefecture’s “share of ryokan and resort properties” and its category-weighted ratio was only 0.495 (R² 0.245). Oita has a ryokan/resort share of 77.2% but a ratio of 2.26x, while Nagano has 77.7% and 2.40x; a high share alone does not make the ratio jump. Both category and rate level need to be considered.
The Ratio Is Stable Over Time: Can It Serve as a Conversion Factor?
To use the ratio as a practical yardstick, it needs to be stable over time. Tracking the monthly median ratio for business hotels across all 47 prefectures over 13 months, it barely leaves the 1.90-2.00x range. The low was 1.90x in January 2026 and the high 2.00x in June 2026.
Source: MetroEngines Research; compiled by HotelBank Editorial Team
Seasonal swings are small; the ratio is better seen as a structural value set by market and category. It therefore has some practical use as a conversion factor of the form “the ratio for this area and category is about N x.”
There are two caveats, however. First, the ratio must not be applied to individual properties. The ratios in this article are area × category medians; at the property level they vary widely with how inventory is released and how plans are structured. Second, in some areas the ratio itself drifts slowly. Chiba’s simple-comparison ratio widened from 2.89x in August 2025 to 3.47x in August 2026 in one year. Because the ratio moves when the composition of the listed population changes, it is safer to recheck it each time rather than treat it as a fixed constant.
Comparison With Official Statistics: Lodging CPI Sits Between Listed and Settled
Placing the two series next to official statistics gives a sense of which is closer to the “true going rate.” The lodging component of the Ministry of Internal Affairs and Communications’ Consumer Price Index (2020 = 100) is an index based on actually surveyed prices.
Source: Compiled by HotelBank Editorial Team from the Ministry of Internal Affairs and Communications, “Consumer Price Index” (lodging, 2020 = 100)
Lodging CPI for July 2026 was 169.1, +2.0% from 165.8 a year earlier. For the same July 2026, our data on the business hotel median across all 47 prefectures shows listed price up +3.9% YoY and estimated settled ADR up +0.7%. On the 2020-base series, growth in the official statistic sits between the two series. However, from the July 2026 release the ministry switched the published index to a 2025 base, on which lodging rose +0.9% YoY, close to the growth in estimated settled ADR. Because a base revision changes the index’s calculation basis, the relative position depends on which base you compare against.
On either base, listed price growth (+3.9%) is the largest, showing that listed prices tend to overstate growth rates. Price increases show up first in listed prices, but whether they carry through to settled rates is another matter. When discussing year-on-year change, putting the two series side by side is more informative. A phase in which only listed prices rise while settled rates stay flat suggests that price increases may not yet be fully absorbed by demand. Note also that CPI is published with a lag of about two months, so it cannot be used to compare the most recent month. Over the medium to long term, lodging CPI and settled rates have diverged considerably: over the past three years, lodging CPI rose +25.6% while settled rates rose +10.9%.
Practical Guide: Which Number Should You Use?
Here is which series to use for which purpose. The principle is simple: use estimated settled ADR where revenue, earnings or appraisal is involved, and listed price for pricing, competitor checks and the guest’s perspective.
| Purpose | Series to use | Why |
|---|---|---|
| Pre-opening feasibility / room revenue assumptions in business plans | Estimated settled ADR | Corresponds to the per-room rate actually sold. Building on listed prices puts revenue at around 2x. |
| Real estate appraisal / NOI and variable-rent assumptions in DCF | Estimated settled ADR | Same basis (pre-tax equivalent) as the settled ADR listed hotel REITs disclose by property, so the levels can be reconciled. |
| Benchmarking against REITs and listed operators | Estimated settled ADR | Disclosures are on a settled basis; comparing them with listed prices buries real level differences under definitional ones. |
| Checking competitor pricing and plan design | Listed price (all-plan average, tax incl.) | The asking prices on the market right now. Shows the depth of the plan lineup. |
| Checking price position (lineup of lowest rates) | Listed price (lowest-plan level, tax incl.) | Close to the level readers and guests see first on comparison screens. |
| “How much will it cost to stay” for guests | Listed price | What guests pay is the tax-inclusive listed price. Settled ADR is a pre-tax-equivalent estimate with a different purpose. |
| Looking at year-on-year growth | Both series side by side | If listed prices rise but settled rates do not, it signals that price increases may not be carrying through to sales. |
Source: Compiled by HotelBank Editorial Team
The most error-prone moment is setting room revenue assumptions in a pre-opening business plan. If a figure picked up from public sources, such as “the going rate in this area is ¥30,000,” is based on listed prices, the actual settled level could well be around ¥12,000-¥15,000. However carefully you set the occupancy assumption, the plan will not hold up if the rate assumption is off by 2x.
Conversely, looking at estimated settled ADR is pointless when you want to check competitor pricing. What readers and guests see on comparison screens is the listed price, and plan design should be discussed at that level. The two series differ in purpose, not in quality.
In practice, the procedure has four steps: (1) confirm which series the figure you found belongs to; (2) if it is based on listed prices, divide it by the ratio for the relevant area and category; (3) align the tax basis (listed prices include tax); and (4) check the resulting level against settled-basis figures such as REIT disclosures. For the level at which appraisal assumptions are set, hotel REIT appraisal values and cap rate distributions are also a useful reference.
Summary
Most figures circulating as “hotel going rates” are based on listed prices, and their level differs from the rates used for business plans and investment decisions. Measured in August 2026, the category-aligned ratio had a national median of 2.26x, ranging from 1.71x in Tokyo to 2.87x in Akita. About 1.10x of this is the tax-basis difference; the real gap on the same basis is about 2.06x.
The ratio is driven mainly by two axes: property category and rate level. The category gap is clear (business hotels 1.91x, city hotels 2.08x, resort hotels 2.55x, ryokan 2.54x), and within the same category, lower-rate areas have larger ratios (correlation −0.736 for ryokan). Decomposing it, the spread of listed plans explains almost none of the category gap; the difference is concentrated in “how far the lowest plan sits from the settled level”: 0.94-0.95x in urban markets versus 1.36-1.59x in hot-spring/ryokan markets.
The ratio was stable across 13 months (national median for business hotels 1.90-2.00x) and can be used as an area × category conversion factor. Good practice, however, is not to apply it to individual properties and to recheck it each time, on the assumption that the population mix can change.
Related Articles
References and Sources
■ Data sources
MetroEngines Research monthly aggregates by prefecture × category (business, city, resort, ryokan). Listed price is the all-plan average for 2 guests per room, per room, tax included (area median of property daily averages); estimated settled ADR is a pre-tax-equivalent estimate from lowest-plan level × category factor (area median). Reference month: August 2026 (finalized); time series: July 2025 to August 2026. Official statistics: lodging component of the Ministry of Internal Affairs and Communications’ “Consumer Price Index.”
■ Calculation assumptions
Prefecture ratio = category-level ratio (listed price ÷ estimated settled ADR) averaged with weights equal to the number of covered properties on the settled side. Prefecture × category cells with fewer than 20 covered properties on the settled side were excluded. The tax-basis difference is taken as 1.10x for the 10% consumption tax, giving a real gap of 2.26 ÷ 1.10 ≈ 2.06x. The Table 3 decomposition uses medians calculated at property level for properties of the relevant categories in the 6 markets.
■ Limitations and caveats
The ratio is an area × category median and cannot be used to convert figures for individual properties. Estimated settled ADR is an estimate; checked against property-level disclosures by listed hotel REITs, the median error is about 7%. The ratio moves if the composition of the listed population changes (Chiba’s simple-comparison ratio went from 2.89x in August 2025 to 3.47x in August 2026). Lodging CPI in the text and chart is on the 2020 base, so its YoY change differs from the published figures from July 2026 onward (2025 base).
■ Market data
- MetroEngines Research — listed price (2 guests per room, per room, tax included, all-plan average) and estimated settled ADR (pre-tax equivalent). Reference month August 2026; prefecture × category cells with 20 or more covered properties (total covered properties by category: business 7,428 / city 730 / resort 1,333 / ryokan 6,782)
- MetroEngines Research — property-level listed plan spread and lowest-plan level (6 markets, N=82-113 properties)
■ Government statistics
- Statistics Bureau of Japan, “Consumer Price Index (CPI)” — lodging (2020 base, 2020 = 100), e-Stat table ID 0003427113, January 2024 to July 2026
- Statistics Bureau of Japan, “2025-Base Consumer Price Index, Japan, July 2026” — released August 21, 2026; lodging +0.9% YoY (2025 base)
- Japan Tourism Agency, “Overnight Travel Statistics Survey” — reference for understanding the lodging market population
■ Reference data for validating estimated settled ADR
- Monthly operating results of listed hotel REITs (property-level disclosures) — Ichigo Hotel REIT (いちごホテルリート投資法人, 3463), Invincible Investment Corporation (インヴィンシブル投資法人, 8963), Nippon Hotel & Residential Investment Corporation (日本ホテル&レジデンシャル投資法人, 3472), Japan Hotel REIT (ジャパン・ホテル・リート投資法人, 8985), Hoshino Resorts REIT (星野リゾート・リート投資法人, 3287), Mori Trust REIT (森トラストリート投資法人, 8961), Kasumigaseki Hotel REIT (霞ヶ関ホテルリート投資法人, 401A). Estimated settled ADR was checked against property-level disclosures for 91 properties over the most recent 3 months, with a median error of about 7%