

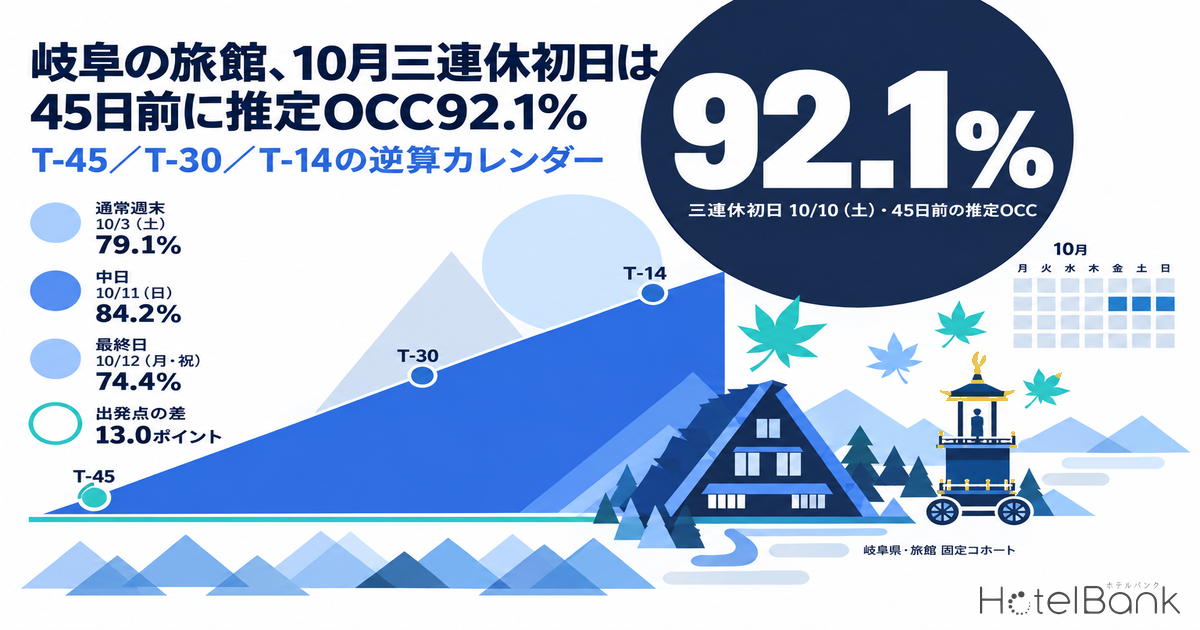
In Gifu Prefecture’s ryokan market, estimated OCC (OTA-listed-inventory basis) for Saturday 10 October 2026 — the opening day of the October long weekend — had already reached 92.1% at 45 days before the stay date. Saturday 3 October, an ordinary October weekend, stood at 79.1% at the same 45-day mark. Two Saturdays, and a 13.0-point gap already present at the starting line. At the most recent observation (19 September 2026), 10 October stands at 95.6% and 3 October at 89.1%, narrowing the distance between them to 6.5 points. In other words, 3 October added 10.0 points over the roughly one month since T-45, while 10 October moved only 3.5 points. The opening day of the long weekend was a date that had largely been decided 45 days out; the ordinary weekend was a date that accumulated after that point. This article tracks a fixed cohort of 145 ryokan in Gifu Prefecture, observing the key October stay dates within a 45-day lead time window and translating the result into a T-45 / T-30 / T-14 countdown calendar.
About the data in this article|Scope: Gifu Prefecture, ryokan category, N=145 properties / 3,545 rooms (a fixed cohort based on listings on major booking sites). Price figures in this article are estimated settled ADR (the transaction price level estimated from OTA and other sales data, tax-excluded equivalent); occupancy is an estimate on an OTA-listed-inventory basis. Both definitions appear at the end of the article. Data as of 20 September 2026.
- — The long weekend’s opening day was at 92.1% estimated OCC 45 days out. The ordinary weekend of Saturday 3 October stood at 79.1% — a 13.0-point difference in starting position between two Saturdays.
- — The T-45 ranking never once changes through to the latest observation. The 45-day-out grading of opening day 92.1%, middle day 84.2%, ordinary weekend 79.1% and closing day 74.4% survives intact.
- — The room to grow stays with the dates that start low. Over a matched 15-day observation window from T-45 to T-30, 3 October added 6.0 points against just 1.8 points for 10 October.
- — Design the closing day of the holiday separately. The sold-out property rate for Monday 12 October (public holiday) barely moved, from 32.4% at 45 days out to 33.6% at the latest reading, and sits below the Monday day-of-week average of 84.3%.
- — Hold your price yardstick at the monthly level. Estimated settled ADR for Gifu ryokan was ¥16,491 in August 2026 (N=234 properties), and October currently estimates at ¥17,214 (N=219 properties) — among the higher bands of the year.
Four days tracked from a fixed point — opening day 92.1%, middle day 84.2%, closing day 74.4% at 45 days out
Monday 12 October 2026 is Sports Day (Cabinet Office, “National Holidays”), so Saturday 10, Sunday 11 and Monday 12 October form a three-day weekend. The table below tracks those three days, plus Saturday 3 October — the ordinary weekend one week earlier — from 45 days before the stay date through to the latest observation, using the same set of properties throughout (a fixed cohort).
| Stay date | Properties | T-45 | T-30 | Latest | T-45 → latest | Sold-out rate T-45 → latest |
|---|---|---|---|---|---|---|
| Oct 3 (Sat), ordinary weekend | 145 properties 3,545 rooms | 79.1% | 85.1% | 89.1% (T-14) | +10.0pt | 35.2% → 49.7% |
| Oct 10 (Sat), opening day | 145 properties 3,542 rooms | 92.1% | 93.9% | 95.6% (T-21) | +3.5pt | 63.9% → 75.9% |
| Oct 11 (Sun), middle day | 143 properties 3,526 rooms | 84.2% | 88.2% | 90.6% (T-22) | +6.4pt | 52.1% → 65.0% |
| Oct 12 (Mon, holiday), closing day | 143 properties 3,524 rooms | 74.4% | 79.3% | 80.1% (T-23) | +5.7pt | 32.4% → 33.6% |
Source: MetroEngines Research; compiled by the HotelBank Editorial Team (estimated OCC = OTA-listed-inventory basis; based on observations from 45 days before the stay date through to the latest reading)
Across the three days of the long weekend, the starting points at 45 days out line up as a staircase — opening day 92.1%, middle day 84.2%, closing day 74.4%, a spread of 17.7 points. Demand for the holiday concentrates on the opening day and thins towards the closing day, and that shape is already complete as early as 45 days before the stay. What is more, the ranking never once changes through to the latest observation. This early hardening of the order within a holiday period is not unique to October: the same yardstick applied to the five-day Silver Week holiday in September for Gifu ryokan showed the opening day reaching 93.7% at 45 days out, with only the closing day left behind at 76.3%.
The way the dates move, however, differs. Looking at the sold-out property rate (the estimated share of properties for which no listed inventory can be confirmed on OTAs and similar channels), 10 October rose 12.0 points from 63.9% at 45 days out to 75.9% at the latest reading, leaving three-quarters of the cohort with no confirmable listed inventory. Monday 12 October, by contrast, went from 32.4% to 33.6% — essentially flat, with almost no additional properties selling out over the month since T-45. Estimated OCC likewise advanced only 5.7 points, from 74.4% to 80.1%. For the closing day of the holiday, the low starting point observed at 45 days out simply stays put. This pattern of a trough remaining on the public-holiday side is not specific to Gifu: in Shizuoka’s Izu and Atami areas, the same October long weekend shows ryokan at 83.1% on the Saturday against 61.5% on the public holiday.
Source: MetroEngines Research; compiled by the HotelBank Editorial Team
Note that the “latest” column above sits at a different observed lead time for each stay date (T-14 for Oct 3, T-21 for Oct 10, T-22 for Oct 11, T-23 for Oct 12). Matching the window length and comparing only the 15 days from T-45 to T-30 gives +6.0 points for Saturday 3 October, +4.0 points for Sunday 11 October, +4.9 points for Monday 12 October and +1.8 points for Saturday 10 October. Even on an identical observation window, the opening day of the long weekend still shows the smallest gain — so the reading that it “had largely been decided 45 days out” is not an artefact of differing windows.
Looking at the shape of the curves, the line for 10 October runs flat just under the ceiling from 45 days out onwards. The other three days slope upwards, and the steepest of them is 3 October, the ordinary weekend. Over the 31 days from 45 days out to the latest reading, 3 October accumulated 10.0 points, a pace of roughly 0.32 points per day. Set against the opening day’s +3.5 points over 24 days, it was the ordinary weekend rather than the long weekend that still had room to grow in the later stretch.
October Saturdays are already ranked at the 45-day mark
The same yardstick applied to the other October Saturdays and to the first public holiday in November gives the following, lined up at the common fixed point of T-45 (45 days before each stay date).
| Stay date | Properties | Estimated OCC at T-45 | Latest estimated OCC (observed Sep 19) |
Latest sold-out rate |
|---|---|---|---|---|
| Oct 3 (Sat) | 145 properties | 79.1% | 89.1% (T-14) | 49.7% |
| Oct 10 (Sat), opening day | 145 properties | 92.1% | 95.6% (T-21) | 75.9% |
| Oct 17 (Sat) | 147 properties | 84.4% | 89.0% (T-28) | 51.0% |
| Oct 24 (Sat) | 143 properties | 87.3% | 90.6% (T-35) | 58.7% |
| Oct 31 (Sat) | 147 properties | 87.7% | 88.2% (T-42) | 53.7% |
| Nov 3 (Tue, holiday) | 146 properties | 73.8% | — | 27.4% |
Source: MetroEngines Research; compiled by the HotelBank Editorial Team (for Nov 3, only the T-45 observation is available)
Reading the T-45 column vertically, the October Saturdays run 79.1% (Oct 3) → 92.1% (Oct 10) → 84.4% (Oct 17) → 87.3% (Oct 24) → 87.7% (Oct 31). The first Saturday of the month is the lowest, the opening day of the long weekend stands out, and the level climbs back into the 87% range towards the end of the month. Gifu Prefecture’s ryokan supply is concentrated in mountain hot-spring areas such as Hida, Okuhida, Gero and Gujo, and the reading here is that late-October Saturdays, which fall in the autumn foliage season, have already secured a higher level than non-holiday weekends at the early stage of 45 days out.
Behind the standout position of 10 October, alongside its status as the opening day of the long weekend, is the Autumn Takayama Festival (Hachiman Festival), held on 9 and 10 October 2026 (Gifu Prefecture official tourism site, “Gifu Travel Guide”). Accommodation demand around Takayama City is being absorbed early, compounded by the day-of-week effect of the holiday’s opening day. Tuesday 3 November, by contrast, sits at 73.8% with a sold-out property rate of 27.4% at T-45 — a lower starting point than any October Saturday. A public holiday that stands alone on a weekday does not trace the same curve as a weekend, and that difference shows up here.
Estimated OCC for Gifu ryokan by day of week — Saturday 94.9%, Wednesday 83.7%
Building a countdown calendar first requires knowing the day-of-week structure of the market your property sits in. Grouping the daily actuals for the most recent completed months, June to August 2026 (same category, Gifu Prefecture), by day of week gives the following distribution.
Source: MetroEngines Research; compiled by the HotelBank Editorial Team (completed-month actuals for June to August 2026; 13 to 14 days per weekday)
Saturday stands out at 94.9%, followed by Friday at 88.8% and Sunday at 88.5%. Monday through Thursday fall within a narrow 83.7% to 84.3% range, with almost no difference between them. The gap between Saturday and Wednesday is 11.2 points, showing that Gifu’s ryokan market is concentrated on a single weekend peak. On a monthly average, the level rises into summer: 82.9% in June 2026, 86.0% in July and 91.8% in August.
Against that structure, the 89.1% latest reading for Saturday 3 October cited at the top of this article sits 5.8 points below the June-to-August Saturday average of 94.9%. Conversely, the 95.6% for Saturday 10 October is marginally above the Saturday average. The 80.1% for Monday 12 October (public holiday) is 4.2 points below the Monday average of 84.3% — a public holiday that is absorbing inventory at a weekday pace or slower.
The price yardstick — estimated settled ADR for Gifu ryokan enters one of the year’s higher bands in October
This article does not go into day-of-week price differences, but the monthly price level is a premise for the countdown calendar. Overlaying years for estimated settled ADR (tax-excluded equivalent) in Gifu Prefecture’s ryokan category traces the following seasonal shape.
Source: MetroEngines Research; compiled by the HotelBank Editorial Team (solid line = confirmed figures; dotted line = estimates based on current sales conditions)
The most recent month comparable on a confirmed-to-confirmed basis is August 2026, at ¥16,491 (N=234 properties). Against ¥16,368 (N=230 properties) in the same month a year earlier, that is +0.8% — essentially flat. The average of confirmed figures for January to August 2026 is roughly ¥14,700, against roughly ¥14,300 for the same period in 2025, or +2.7%. The through-the-year level is edging up, but the summer peak itself has plateaued at around the prior-year level.
October 2026 shows ¥17,214 (N=219 properties), but this is an estimate based on current sales conditions and may move before the month closes. A simple comparison with the confirmed ¥15,056 (N=219 properties) for October last year should wait for the month to be finalised. What can be said on a confirmed basis is that estimated settled ADR for Gifu ryokan in 2025 stepped up from autumn into winter — ¥15,056 in October, ¥16,432 in November and ¥17,259 in December. October is a month that enters one of the higher price bands of the year, and how far demand formation has progressed at the 45-day mark at the entrance to that month determines whether that shape can be realised. Within the prefecture, incidentally, the month in which rates peak is not uniform: Takayama peaks in October while Gero peaks in November.
For revenue managers running ryokan in Gifu — implications and an action plan
(1) The T-45 starting point is the grade of the date. The 45-day-out scores — opening day 92.1%, middle day 84.2%, ordinary weekend 79.1%, closing day 74.4% — never changed order through to the latest reading. At your own property, record on-the-books (OTB) at 45 days before each stay date and use that single number as the branch point for how you will treat the date. Whether you are above or below the comparable market level at 45 days out changes what you should do next.
(2) The size of the upside is inversely correlated with the level at 45 days out. Over the 31 days from T-45, 3 October added 10.0 points, while 10 October moved only 3.5 points over 24 days. Market-wide, dates with a high starting point barely grow afterwards, and dates with a low starting point catch up later. If your own ordinary weekends sit around 80% at 45 days out, the reading is that the market held roughly 10 points of room to accumulate from there.
(3) Design the closing day of the holiday separately. For Monday 12 October (public holiday) the sold-out property rate barely moved, from 32.4% at 45 days out to 33.6% at the latest reading, and estimated OCC stopped at 80.1%. That is also below the Monday day-of-week average of 84.3%. Treat the holiday as three uniformly strong days and the closing day’s inventory will still be there at the end. Whether to capture it through consecutive-night stays or to market the closing day on its own needs to be decided separately within the holiday period.
(4) Hold the price yardstick at the monthly level. Estimated settled ADR for August 2026 was ¥16,491, +0.8% year on year. The current estimate for October is ¥17,214, one of the higher bands of the year. Rather than fine day-of-week price differences, checking where your own October settings sit against the market’s monthly level is the coarser yardstick better suited to decisions made as early as 45 days out.
| Time frame | Action | Decision trigger | Objective |
|---|---|---|---|
| T-45 Fix inventory and rate ranges | Record OTB at 45 days before the target date and sort dates into three grades: strong, ordinary, weak | The market’s long-weekend opening day is at 92.1% at 45 days out; an ordinary weekend is at 79.1%. If your own date is a holiday opening day yet sits close to the market’s ordinary-weekend level, revisit the grading | Fix the upper and lower rate bounds per date at 45 days out and limit how far pricing can move thereafter |
| T-45 | Check your own settings against the October monthly price band | If your October settings remain markedly below the market’s current October estimate of ¥17,214 and have not moved, consider room to revisit the upper bound | Build into the rate-range design the fact that October enters one of the higher bands of the year |
| T-30 Review plan exposure and consecutive-night conditions | Set up conditions that stretch demand concentrated on the opening day into the middle and closing days via consecutive-night stays | In the market, Oct 10 reaches 93.9% at 30 days out while Oct 12 is at 79.3%. If your own gap between opening and closing day is 10 points or wider, put those dates into the consecutive-night conditions | Level out absorption across the three days and start moving the closing day’s remaining inventory earlier |
| T-30 | Review plan exposure on ordinary weekends and go after the room to accumulate | In the market, Oct 3 grew from 85.1% at 30 days out to 89.1% at the latest reading. If your comparable weekends sit below the market at 30 days out, prioritise a review of exposure | Avoid missing the dates that accumulate late, and advance absorption by means other than discounting |
| T-14 Clear remaining inventory | Take stock of the inventory that moves in the final two weeks, by room type | In the market, Oct 3 shows a sold-out property rate of 49.7% at 14 days out. If your own figure for that date is well below this and you are not near the equivalent of 89.1% estimated OCC, treat it as a date to clear | Absorb the inventory remaining in the last stretch without breaking the price band |
| T-14 | Check weekday selling resources against the day-of-week structure | The market runs flat at 83.7% to 84.3% Monday through Thursday. If your weekdays fall well below this range, there is room to shift a weekend-heavy allocation towards weekdays | Within a market structured around a single weekend peak, go after the room to lift the weekday floor |
Source: MetroEngines Research; compiled by the HotelBank Editorial Team
Summary — three yardsticks
First, the score at 45 days out is the grade of the date. In Gifu’s ryokan market, the 45-day-out order of October’s long-weekend opening day 92.1%, middle day 84.2%, ordinary weekend 79.1% and closing day 74.4% held through to the latest reading. A single number measured at 45 days out all but names the character of that date.
Second, the upside stays with the dates that start low. The ordinary weekend of 3 October added 10.0 points from 45 days out, while the long weekend’s opening day of 10 October managed just 3.5 points. That is the basis for an allocation that defends the strong dates and goes after the weak ones.
Third, break the holiday down day by day. The sold-out property rate for Monday 12 October (public holiday) barely moved, from 32.4% at 45 days out to 33.6% at the latest reading. Preparing a separate curve and a separate set of actions for the opening, middle and closing days — rather than treating the holiday as one block — is what determines the result in October, a month that enters one of the higher price bands of the year.
About the data
Definition of estimated OCC: OTA-listed-inventory-basis occupancy = 100 − 100 × rooms still listed on OTAs ÷ total rooms. The scope is a fixed cohort of properties that list 30% or more of their total rooms on OTAs (the same set of properties for each stay date; the property counts given in the text and tables refer to this). It is an estimate based on how listed inventory is being absorbed on OTAs and is defined differently from actual room occupancy (it runs high because rooms not listed are counted as absorbed).
Booking curve: based on observations from 45 days before the stay date through to the latest reading.
Definition of estimated settled ADR: the transaction price level (tax-excluded equivalent) estimated from OTA and other sales data (lowest-plan level × category coefficient, ensembled across multiple channels). Past months are confirmed figures; the current and future months are estimates based on current sales conditions. Median error against published operating results is 6.6%.
Breakdown of N: the booking curves use a fixed cohort in Gifu Prefecture’s ryokan category — 3 October 2026 = 145 properties / 3,545 rooms, 10 October = 145 / 3,542, 11 October = 143 / 3,526, 12 October = 143 / 3,524, 17 October = 147 / 3,612, 24 October = 143 / 3,568, 31 October = 147 / 3,606, 3 November = 146 / 3,596 (all based on listings on major booking sites, two guests per room). The day-of-week aggregation uses daily actuals for the same category for June to August 2026 (13 to 14 days per weekday). Estimated settled ADR covers Gifu Prefecture’s ryokan category — August 2025 = 230 properties, August 2026 = 234, October 2025 = 219, October 2026 = 219. The sold-out property rate is an estimate of the share of properties for which no listed inventory can be confirmed on OTAs and similar channels.
Data as of 20 September 2026. Sales conditions and inventory change daily, so the figures in this article are a snapshot at the time of retrieval.
References and sources
– Cabinet Office, “National Holidays (syukujitsu.csv)” https://www8.cao.go.jp/chosei/shukujitsu/syukujitsu.csv
– Gifu Prefecture official tourism site “Gifu Travel Guide”, Autumn Takayama Festival (Hachiman Festival) https://www.kankou-gifu.jp/event/detail_1074.html
– Takayama Yatai Preservation Society, “Autumn Takayama Festival” https://www.takayama-yatai.jp/about/autumn-festival.html