

When evaluating a site for a new build or a rebuild in a regional resort or an onsen town, developers always check land price, zoning, road frontage and water and sewer service. Yet “is there a city gas main here?” often surfaces only after the schematic design is fixed, when the MEP engineer raises it. A heat source is not a piece of equipment you can re-select later — it is a constraint that comes attached to the land. This article quantifies how the three heat-source options — city gas, LP gas and all-electric — affect both initial cost and per-room running cost, using published statistics and our own data.
Metric Definitions Used in This Article
- ADR (average daily rate) = an estimated settled rate (tax-excluded equivalent) derived by applying a segment-specific adjustment coefficient to the lowest published plan level each property lists on OTAs and similar channels (double occupancy, per-room rate, tax included). Cross-checked against per-property results disclosed by listed hotel REITs (91 properties, most recent three months), the median error is approximately 7%. These are estimates and differ from each property’s actual transaction prices and accounting figures. Area-level ADR is the median of the properties covered (the level of a typical property in that area).
- OCC (occupancy) = rooms sold as a share of total rooms in the area (an estimate based on OTA sales inventory; consistency checks against monthly REIT disclosures confirm accuracy to roughly a few percentage points). It is an estimate based on how inventory listed on OTAs is sold down, and differs from a property’s overall actual occupancy.
- Effective heat cost (¥/MJ) = the unit price of fuel or electricity divided back by the efficiency of the water-heating equipment (thermal efficiency for a gas boiler, coefficient of performance for a heat pump), converted into the cost per megajoule of heat actually delivered into the water. It is the metric that puts the heat sources on the same footing.
- Data sources: MetroEngines Research & Consulting (ADR and OCC). Energy unit prices and supply statistics are cited individually in the text.
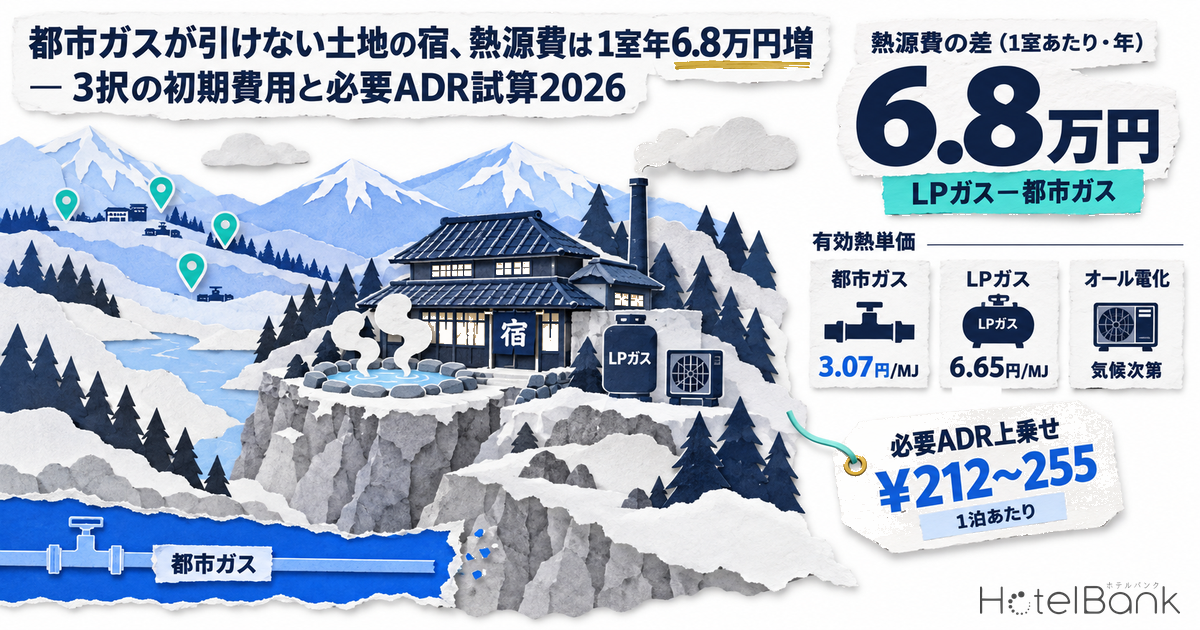
- — LP gas costs ¥6.65/MJ of effective heat, about 2.2x city gas (¥3.07/MJ). Heat-pump water heating in a temperate climate is the cheapest at ¥2.11/MJ (unit prices from the August 2026 survey and others; our model assumptions).
- — The LP-gas-minus-city-gas heat cost gap runs ¥16,500-68,100 per room per year. It is smallest for a business hotel with no large communal bath and largest for an 80-room onsen ryokan serving two meals with a large bath — the more bathing and kitchen load a format carries, the wider the gap.
- — Holding GOP constant requires an ADR uplift of ¥212-255 per night (18 prefectures, ryokan; estimated OCC as of July 2026). As a share of revenue the range runs from 1.22% in Shizuoka to 3.40% in Tokushima — a spread of about 2.8x.
- — On a five-year payback, a 100-room property with a large bath can justify roughly 1-2km of main extension, and an onsen ryokan roughly 1.4-2.7km (extension cost ¥10,000-20,000/m, simple payback).
- — The single biggest swing factor is the LP gas procurement price. At general retail levels the gap is ¥99,700 per room per year; at a 35% discount it is ¥44,400. Breaking the quote into the three-part tariff is where the comparison starts.
A heat source is not something you choose — it comes with the land
According to materials the Japan Gas Association submitted to a Ministry of Economy, Trade and Industry (METI) advisory council in October 2025, Japan has 189 city gas operators (3 major, 8 semi-major, 103 mid-sized and 75 small) and 31.67 million installed meters. The same document separates the population of municipalities where a city gas operator has a service area from the population of municipalities with no service area at all; the latter is 18.52 million. Against a total population of 126.14 million, roughly 15% of people live in municipalities that have no city gas operator in the first place. That 18.52 million has fallen 5.5% over the past five years, moving in the opposite direction from city gas areas (meter installations up 3.6% over the same period).
One caveat matters here: even in a municipality that has an operator, mains are not laid across the whole municipality. City gas is structured to supply only areas with sufficient demand density, so it is entirely ordinary for the central district of a city to have a main while the onsen town up the mountain or the highland villa district has none. The Agency for Natural Resources and Energy’s earlier compilation “The Current State of the Gas Business” puts general gas utility service areas at 17.5% of national land area excluding forest and wasteland (figure as of 2013). On an area basis, in other words, most of Japan’s land has no city gas.
Land considered for lodging development is heavily concentrated in exactly this territory — low demand density, but rich in tourism resources. That is why the heat source is not an equipment specification to settle late in design but a locational condition to verify at the site-selection stage. Water connection fees are another pre-opening infrastructure cost that varies widely between municipalities, with the gap between the most and least expensive reaching several million yen for a 100-room property.
Putting them on the same footing — city gas ¥3.07/MJ, LP gas ¥6.65/MJ
The first stumbling block in comparing heat sources is units. City gas is priced in ¥/m³ and so is LP gas, but the heat content per cubic metre differs by more than a factor of two, while electricity is priced in ¥/kWh. A heat pump, moreover, extracts several times more heat than the electricity put into it, so comparing fuel prices directly is meaningless. We therefore convert everything to the effective heat cost — the cost per megajoule (MJ) of heat actually delivered into the water.
| Heat source | Primary unit price | Heat content | Equipment efficiency | Effective heat cost |
|---|---|---|---|---|
| City gas 13A | ¥120/m³ (tax incl.) | 45MJ/m³ | Boiler 87% | ¥3.07/MJ |
| LP gas (commercial bulk assumed) | ¥572.6/m³ (tax incl.) | 99MJ/m³ | Boiler 87% | ¥6.65/MJ |
| LP gas (general retail level) | ¥715.8/m³ (tax incl.) | 99MJ/m³ | Boiler 87% | ¥8.31/MJ |
| Electricity + heat-pump water heating (temperate) | ¥22.78/kWh | 3.6MJ/kWh | COP 3.0 | ¥2.11/MJ |
| Electricity + heat-pump water heating (cold region, winter) | ¥22.78/kWh | 3.6MJ/kWh | COP 2.0 | ¥3.16/MJ |
Three structural points follow. First, the effective heat cost of LP gas is about 2.2x that of city gas. This stems from a difference in supply cost structure, not from commercial practice or negotiating position, so there is a limit to how much of it negotiation can close. Second, heat-pump water heating in a temperate climate is cheaper than city gas (¥2.11/MJ versus ¥3.07/MJ). Third, once winter COP in a cold region falls to 2.0, the heat pump lands roughly level with city gas (¥3.16/MJ). For projects in highland or heavy-snow locations, this temperature dependence is what decides whether all-electric pencils out.
Initial cost takes a different shape in each option — main contributions, free equipment loans, incoming capacity
On running cost alone LP gas looks unattractive, but the way initial cost falls out differs completely across the three options. Comparing without aligning this leads to the wrong decision.
City gas: distance to the main determines the cost
If the site is inside a service area and a main is already laid along the road frontage, the owner typically pays for on-site piping, the meter and equipment connections, while the gas operator bears the cost of the take-off from the main. The problem arises when there is no main and an extension is required. As a cost benchmark, private commentary sites put main extension at roughly ¥10,000-20,000 per metre. The amount the gas operator will bear is capped, and anything above that falls to the customer. A 300m extension works out at ¥3-6 million and a 1km extension at ¥10-20 million — and whether the operator will undertake the extension at all depends on its own judgement about volume and economics.
LP gas: a commercial practice that makes initial cost look like zero
With LP gas it has long been common practice for the distributor to install the supply equipment — bulk tank, vaporiser, supply piping — and recover the cost through the gas tariff. From the operator’s point of view initial cost is contained, but the volumetric rate stays high, and the structure brings contract-term lock-in and settlement of residual equipment value. “Zero initial cost”, in other words, has not disappeared; it has been shifted into running cost.
This practice was addressed by an April 2024 amendment to the enforcement regulations under the Liquefied Petroleum Gas Act. According to explanatory materials from the Fuel Distribution Policy Office, Resources and Fuel Department, Agency for Natural Resources and Energy, the amendment has three pillars: (1) restrictions on excessive sales practices and (3) disclosure of LP gas tariffs and related information took effect on 2 July 2024, while (2) full application of the three-part tariff system (separate presentation of equipment costs, with their inclusion in the gas tariff prohibited) took effect on 2 April 2025. The three-part tariff system means presenting the base charge, the volumetric charge and the equipment charge separately; charging equipment costs unrelated to LP gas consumption (electric air conditioners, Wi-Fi hardware and so on) to the gas tariff is now prohibited. For LP gas tariffs on rental housing, the cost of gas appliances and other consuming equipment may likewise no longer be charged.
All-electric: incoming capacity and storage space are what bite
A commercial heat-pump water heater draws heat from the ambient air and so delivers more than two to three times the heat of the electricity put in. It needs neither a gas main nor a bulk tank, and freedom from supply infrastructure constraints is its biggest advantage. Against that, beyond the heat pump itself the project needs space for hot water storage tanks and sufficient capacity in the incoming power equipment (the cubicle substation). Because the operating model is to heat overnight and store, storage capacity design drives economics at properties with a large communal bath, where peak demand concentrates. Kitchens also cannot be served by a heat pump, so a separate decision is needed between electric (induction) and gas cooking.
| Item | City gas | LP gas | All-electric |
|---|---|---|---|
| Main components of initial cost | Main extension, service line, on-site piping, equipment | Bulk tank, vaporiser, supply piping, equipment | Heat pump, storage tank, incoming capacity upgrade |
| Who bears initial cost | Owner (the portion above the operator’s cap) | Free loan from the distributor is widespread | Owner |
| Locational constraint | Strongly dependent on service area and main location | Bulk tank space and delivery access | Incoming capacity and outdoor unit space |
| Level of running cost | Low (¥3.07/MJ) | High (¥6.65/MJ) | Climate-dependent (¥2.11-3.16/MJ) |
| Contractual flexibility | Selectable under full retail liberalisation | Term lock-in can arise with equipment loans | Selectable under full retail liberalisation |
| Suitability for kitchens | High | High | Requires separate study of electric kitchens |
| What to check at site selection | Service area map and main location on the frontage road | Quote broken out under the three-part tariff | Prior consultation with the utility on incoming capacity |
Three models — the gap widens with the size of the bath
Where heat demand differs, the yen gap created by a unit price difference scales with it. Limiting the scope to hot water and kitchens, we set up three models and compared annual energy cost per room.
| Model | Heat demand | City gas | LP gas (bulk) | LP gas (general retail level) | All-electric | LP minus city gas |
|---|---|---|---|---|---|---|
| A. 100-room business hotel (no large bath) | 4.6GJ/room-yr | ¥14,100 | ¥30,600 | ¥38,200 | ¥9,700 | +¥16,500 |
| B. 100-room business hotel (with large bath) | 11.0GJ/room-yr | ¥33,700 | ¥73,100 | ¥91,400 | ¥23,200 | +¥39,400 |
| C. 80-room onsen ryokan (two meals, large bath) | 19.0GJ/room-yr | ¥58,200 | ¥126,300 | ¥157,900 | ¥60,100 | +¥68,100 |
The presence of a large communal bath widens the gap 2.4-fold. In Model A the city gas to LP gas difference is ¥16,500 per room-year; adding a large bath in Model B takes it to ¥39,400, and in Model C, the two-meal onsen ryokan, to ¥68,100. Across the whole property that is ¥3.94 million a year for Model B and ¥5.45 million for Model C. The more bathing and kitchen load a format carries, the more directly the site’s heat-source infrastructure feeds into the P&L — that structure is visible here. On the level of ryokan heat costs including winter heating, our separate analysis puts the figure at roughly ¥15,000 per room per month at the peak of winter.
One more point not to overlook: in Model C, all-electric (¥60,100) comes in slightly above city gas (¥58,200). That reflects the assumption of winter COP falling to 2.0 in a cold region; apply the temperate COP of 3.0 and the figure becomes ¥40,100, 30% below city gas. For highland and heavy-snow projects, the annual average COP needs to be verified under the manufacturer’s measured conditions and the calculation redone.
The share of revenue varies fourfold by area — it bites hardest where rates are low
From here we connect to our own data. The same ¥68,100 heat cost gap means different things depending on how much revenue the property generates per room. Using estimated settled ADR and estimated OCC to derive annual room revenue per room, we calculated what share of revenue the Model C (80-room onsen ryokan) heat cost gap represents across 18 prefectures.
| Prefecture | Ryokan ADR (estimated settled) | Properties covered | Estimated OCC | Annual room revenue per room | Heat gap as % of revenue | ADR uplift required |
|---|
The highest share is Tokushima at 3.40%, followed by Miyazaki at 3.08% and Iwate at 2.79%. At the other end are Shizuoka at 1.22%, Oita at 1.33% and Tochigi at 1.37%. The gap in yen is identical, yet between a prefecture where ryokan ADR sits in the ¥7,000s and one where it sits in the ¥19,000s, the impact of the heat-source choice on the P&L differs by roughly 2.8x. High-rate onsen destinations have room to absorb the difference in price; low-rate areas have little. This asymmetry is exactly why site selection has to look at “the ADR level this area can sustain” and “the heat-source infrastructure” together.
What is interesting is that the ADR uplift required to hold GOP constant lands within a band of ¥212-255 per night across all 18 prefectures. That is the heat cost gap divided by annual rooms sold (OCC x 365), so only the occupancy difference moves it. In other words, the question reduces to a simple one: at an LP gas site, can you build ¥250 a night into the price? In Shizuoka, with ADR in the ¥19,000s, that is a 1.2% increase; in areas with ADR in the ¥11,000s it means an increase of more than 2%.
The areas showing the highest uplift rates on the map are Osaki, Miyagi (Naruko Onsen district, 2.12%), Hakuba, Nagano (2.03%), Karuizawa, Nagano (1.77%) and Semboku, Akita (Tazawako highland, 1.74%). All sit in highland or heavy-snow locations, and so face the second constraint of degraded heat-pump COP at the same time (on how operating costs in snow country relate to winter revenue opportunity, see Snow as Cost or Asset: Winter RevPAR 53% vs Winter ADR 2.66x). At the other end, Minamioguni, Kumamoto (Kurokawa Onsen, 0.79%), Atami, Shizuoka (0.87%) and Hakone, Kanagawa (0.93%) command high rates and so have relatively more room to absorb the heat cost gap.
A decision rule — how much main extension a five-year payback allows
Where no main reaches the site, the question becomes whether to pay for an extension to bring city gas in. That reduces to a simple payback calculation between the annual heat cost gap and the extension cost. Dividing the annual city-gas-versus-LP-gas (bulk) difference by the unit cost of extension gives the allowable distance.
| Model | LP minus city gas, annual (whole property) | 5-yr payback, ¥10,000/m | 5-yr payback, ¥20,000/m | 10-yr payback, ¥10,000/m | 10-yr payback, ¥20,000/m |
|---|---|---|---|---|---|
| A. 100-room business hotel (no large bath) | ¥1.65mn | 824m | 412m | 1,648m | 824m |
| B. 100-room business hotel (with large bath) | ¥3.94mn | 1,970m | 985m | 3,940m | 1,970m |
| C. 80-room onsen ryokan (two meals, large bath) | ¥5.45mn | 2,722m | 1,361m | 5,445m | 2,722m |
Case 1 No large bath, small scale
Heat demand is small, so with the main even a few hundred metres away the connection investment will not pay back within five years. Planning around LP gas or all-electric, and redirecting the freed-up investment capacity into guest room specification, tends to be the rational choice.
Case 2 With large bath, 100-room class
With a ¥3.94 million annual difference, the connection investment pays back within five years out to roughly 1km. Verifying main location at the site-selection stage and adding it to the comparison across two or three candidate sites is clearly worth the effort.
Case 3 Onsen ryokan, two meals
A ¥5.45 million annual difference allows 1.4-2.7km of extension even on a five-year payback. In cold regions, however, the heat pump runs level with city gas, so a full three-way comparison including electrification is needed.
That said, this calculation assumes the gas operator will undertake the extension. In low demand density areas, a main extension may not happen even if the developer offers to bear the full cost. “Pay and you can connect” does not always hold — a point to settle in prior consultation before acquiring the land.
Sensitivity analysis — which assumptions move the conclusion
Because this calculation stacks several model assumptions, it is worth stating which of them drive the conclusion. Taking Model C (80-room onsen ryokan) as the base, the table below flexes the main parameters.
| Assumption flexed | Base case | Flexed case | LP minus city gas (per room-year) | ADR uplift required |
|---|---|---|---|---|
| — | Base case (heat demand 19.0GJ/room-yr, LP bulk at 20% discount, city gas ¥120/m³) | ¥68,100 | ¥212-255 | |
| Heat demand | 19.0GJ/room-yr | 13.3GJ/room-yr (-30%) | ¥47,700 | ¥148-179 |
| Heat demand | 19.0GJ/room-yr | 24.7GJ/room-yr (+30%) | ¥88,500 | ¥276-332 |
| LP gas unit price | Bulk, 20% discount | General retail level | ¥99,700 | ¥311-374 |
| LP gas unit price | Bulk, 20% discount | Bulk, 35% discount | ¥44,400 | ¥138-167 |
| City gas unit price | ¥120/m³ | ¥130.46/m³ (general tariff level) | ¥63,000 | ¥196-236 |
Two-way sensitivity — LP gas procurement price x heat demand (Model C, gap per room-year)
| Heat demand (GJ/room-yr) | General retail level (¥715.8/m³) | 10% discount | 20% discount (base) | 30% discount | 35% discount |
|---|---|---|---|---|---|
| 13.3 (-30%) | ¥69,800 | ¥58,700 | ¥47,700 | ¥36,600 | ¥31,100 |
| 16.2 (-15%) | ¥85,000 | ¥71,500 | ¥58,100 | ¥44,600 | ¥37,900 |
| 19.0 (base) | ¥99,700 | ¥83,900 | ¥68,100 | ¥52,300 | ¥44,400 |
| 21.9 (+15%) | ¥114,900 | ¥96,700 | ¥78,500 | ¥60,300 | ¥51,200 |
| 24.7 (+30%) | ¥129,600 | ¥109,000 | ¥88,500 | ¥68,000 | ¥57,700 |
Seen in two dimensions, a property with 30% less heat demand still lands at ¥69,800 per room-year if it contracts at general retail levels — essentially level with the base case (¥68,100). Conversely, a property with 30% more heat demand comes in at ¥57,700 if it can secure a 35% discount. Hot water design and procurement terms carry almost the same weight.
The single largest swing factor is the LP gas procurement price. Contract at general retail levels and the gap widens to ¥99,700 per room-year; secure a 35% discount and it narrows to ¥44,400. The full application of the three-part tariff system discussed earlier is precisely a regulatory change in the direction of greater transparency on this procurement price, which for operators means one more tool for comparing quotes. Next in importance is the absolute level of heat demand: move the design of bath water volume, water change frequency and circulation heating by ±30% and the gap moves proportionally. The city gas price assumption, by contrast, has relatively little influence on the conclusion.
Limitations of this calculation: this article is a model calculation limited to hot water and kitchens, and excludes HVAC and space heating. Adding cold-region heating load could make the effect of the heat-source choice larger still. The absolute level of heat demand, equipment efficiency and the bulk discount rate are our model assumptions and will vary with actual design conditions and vendor quotes. The purpose here is to show the structure of how unit price differences across the three heat-source options translate into a per-room figure; an investment decision on a specific project requires a detailed feasibility study.
Summary — add one line to the site checklist
The practical points that come out of comparing the three heat-source options are as follows.
| Item to verify | When to verify it | How it affects the decision |
|---|---|---|
| Inside or outside the city gas service area | When narrowing down sites | Outside the area, the options narrow to LP gas or electrification |
| Main location on the frontage road and extension distance | Before expressing intent to acquire | Extension distance x ¥10,000-20,000/m is the connection investment. With a large bath, roughly 1km is within five-year payback |
| Whether the gas operator will undertake the extension | Prior consultation before land acquisition | Willingness to bear the cost does not guarantee it will happen |
| Three-part tariff breakdown of the LP gas quote | When selecting the supplier | Procurement price is the biggest swing factor. Compare on base, volumetric and equipment charges separately |
| Annual average COP of the heat pump | At schematic design | In cold regions it runs level with city gas. Verify under the manufacturer’s measured conditions |
| Incoming capacity and hot water storage space | At schematic design | The constraint if electrification is chosen. Prior consultation with the utility is required |
Building a hotel or ryokan on land with no city gas is not in itself a problematic choice. Most of Japan’s land area lies outside city gas service areas, and attractive onsen and highland sites are if anything concentrated outside them. What matters is designing the heat source with that condition built in, and reflecting the required rate level in the business plan. ¥250 a night is a number that can comfortably be absorbed at the site-selection stage, but trying to recover it through a rate increase after opening is far harder. Adding a single line — “check the city gas service area map” — to the site checklist brings most of this decision forward.
Equally, even at an LP gas site, a configuration that electrifies only the hot water with a commercial heat-pump water heater while keeping LP gas for the kitchen is a viable option in a temperate climate. Under Model B temperate conditions, all-electric (¥23,200) is a third of LP gas (¥73,100) and 30% cheaper than city gas (¥33,700). Treating the heat source not as a binary pick among three options but as a design problem of combining them by end use widens the revenue opportunity.
Related reading
References and Sources
■ Data sources
Estimated settled ADR (ryokan category, 18 prefectures and 16 onsen municipalities, median over the 13 confirmed months from August 2025 to August 2026) and estimated OCC (July 2026, based on OTA listed inventory) are from MetroEngines Research & Consulting. Energy unit prices are from the Oil Information Center (LP gas, August 2026 survey), Tokyo Gas “General Gas Rate” and Shin-Denryoku Net (high voltage, May 2026). City gas supply conditions are from published materials of the Japan Gas Association (October 2025) and the Agency for Natural Resources and Energy.
■ Calculation assumptions
City gas ¥120/m³ at 45MJ/m³; LP gas (commercial bulk) ¥572.6/m³ (20% below general retail) at 99MJ/m³; gas boiler efficiency 87%; electricity ¥22.78/kWh with heat-pump COP 3.0 (temperate) / 2.0 (cold region). Hot water plus kitchen heat demand is 4.6GJ/room-year for Model A, 11.0 for B and 19.0 for C. Annual room revenue per room = ADR x OCC x 365; required ADR uplift = heat cost gap ÷ (OCC x 365). Allowable main extension distance is simple payback at an extension unit cost of ¥10,000-20,000/m (no interest or discount rate applied).
■ Limitations and caveats
HVAC and space heating are excluded from the calculation. Heat demand, equipment efficiency and the bulk discount rate are our model assumptions and vary with actual design conditions and vendor quotes. ADR and OCC are estimates based on publicly available OTA information and differ from each property’s actual results. Figure 4 does not indicate whether each area has a city gas service area; service area, main location, the operator’s cost-bearing cap and whether it will undertake an extension all require property-specific enquiry.
■ Market data
- MetroEngines Research & Consulting — estimated settled ADR (by prefecture and by municipality, ryokan category, 13 confirmed months from August 2025 to August 2026), estimated OCC (by prefecture, July 2026, based on OTA listed inventory)
■ City gas and LP gas supply statistics
- Japan Gas Association, “Current Status and Issues in the City Gas (Pipeline) Business” (23 October 2025, METI Next-Generation Gas Business Infrastructure Working Group, Document 3) — 189 city gas operators, 31.67 million installed meters, population of municipalities with a service area
- Agency for Natural Resources and Energy, “The Current State of the Gas Business” — service areas as 17.5% of national land area excluding forest and wasteland (as of 2013)
- Agency for Natural Resources and Energy, “Survey of Gas Business Production Dynamics”
- Japan LP Gas Association, “LP Gas Sales Volume by Prefecture” (April-June 2026)
■ Energy unit prices and regulation
- Institute of Energy Economics, Japan, Oil Information Center, “General Retail Price, LP (Propane) Gas” (survey as of 31 August 2026) — Kyushu and Okinawa regional average ¥35,790 (tax incl.) at 50m³ of use; national average ¥37,365 (tax incl.)
- Tokyo Gas, “General Gas Rate” — unit rate ¥130.46/m³ (Rate Table B, Tokyo district and others)
- Shin-Denryoku Net, “Trends in Average Unit Electricity Prices for Corporate and Household Users” (May 2026) — high voltage ¥22.78/kWh (excluding consumption tax and the renewable energy levy). Underlying data from the Electricity and Gas Market Surveillance Commission’s electricity transaction reports and similar sources
- TEPCO Energy Partner, “Electricity Rate Table (Extra-High and High Voltage)” (effective 1 April 2025)
- Fuel Distribution Policy Office, Resources and Fuel Department, Agency for Natural Resources and Energy, “Content of the Regulatory Reform for Fair LP Gas Transactions” (July 2024) — restrictions on excessive sales practices and disclosure of LP gas tariffs effective 2 July 2024; full application of the three-part tariff system effective 2 April 2025
■ Heat demand and energy efficiency baseline data
- Building Research Institute, “Energy Efficiency Standards: Calculation and Judgement Methods (Non-Residential Buildings), Chapter 4 Hot Water Supply Equipment” — shower use in hotel guest rooms, 79L per person (10.5 min/person x 10L/min x 0.75 simultaneity factor)
- Energy Conservation Center, Japan, “Energy Conservation Measures for Hotels” (commissioned by the Agency for Natural Resources and Energy under its programme to promote energy conservation in commercial buildings) — energy consumption intensity 2,772MJ/m² per year, breakdown by use (hot water 9.9% and others)
- Agency for Natural Resources and Energy, “Benchmark System (Hotel Industry)”