

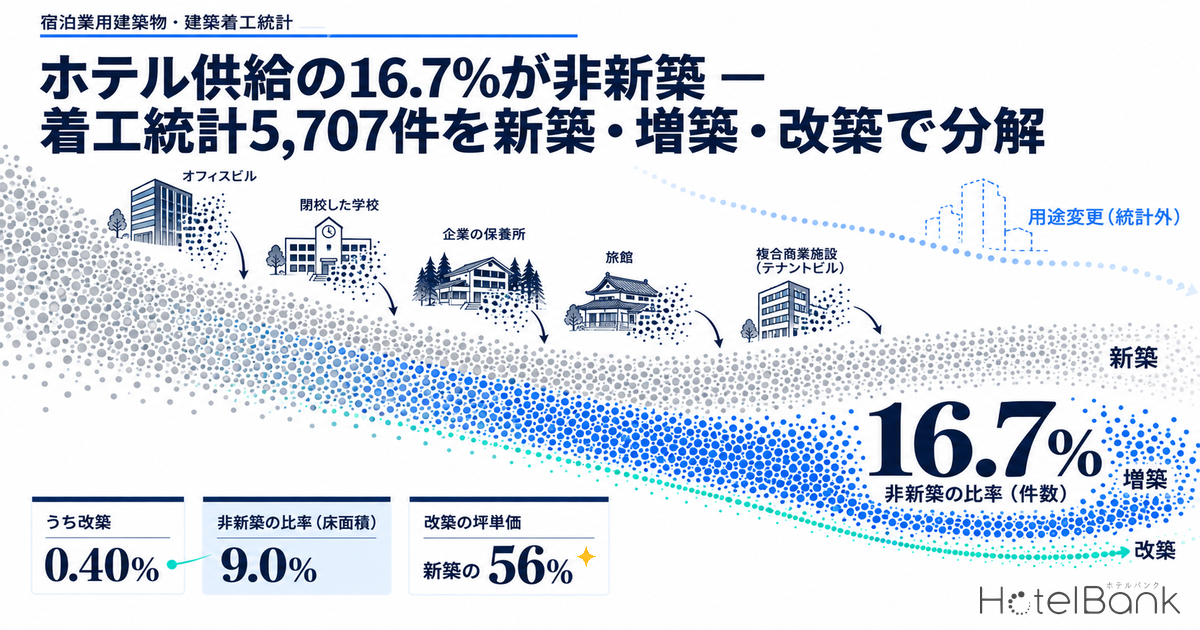
When we talk about new hotel supply, we almost unconsciously assume “new construction.” In practice, though, the structures of closed schools, corporate retreats, office buildings, multi-tenant buildings and ryokan are being turned into lodging. So what share of the total does that non-new-build route account for? This article takes the accommodation-use buildings in MLIT’s Statistics on Building Construction Starts, splits them by type of work (new construction, extension, rebuilding), and counts the non-new-build share over the five years 2020–2024. The conclusion up front: by number of starts, non-new-build work counted in the construction statistics is 16.7%, and rebuilding alone is just 0.40%. And this figure understates how much existing stock is really being reused — because the most important non-new-build route, change of use (conversion), does not appear in the construction statistics at all.
Type of work = the work category used in the Statistics on Building Construction Starts: new construction (erecting a new building), extension (adding floor area to an existing building) and rebuilding (reconstructing within a scope whose use, scale and structure do not differ markedly from the previous building). “Non-new-build” in this article means extension plus rebuilding.
Accommodation-use buildings = use category “52 Accommodation” in the construction starts statistics. It covers buildings used solely as hotels or ryokan; buildings combined with housing or with food service fall into other categories.
Cost per tsubo = planned construction cost ÷ (floor area ÷ 3.305785). One tsubo is 3.305785 m², the customary Japanese floor-area unit. This is the planned building construction cost and excludes land acquisition, design and supervision fees, FF&E and pre-opening costs.
Data sources = MLIT Statistics on Building Construction Starts (annual; 2024 is the latest), MLIT Real Estate Information Library (zoning), MetroEngines Research & Consulting (pipeline hotel data).
- — 16.7% — Of 5,707 accommodation-use construction starts in 2020–2024, 954 were non-new-build (extension + rebuilding). 97.6% of those were extensions; rebuilding was only 23 starts, or 0.40%
- — A floor, not a ceiling — A change of use under Article 87 of the Building Standards Act is not counted in the construction statistics unless it involves an extension or rebuilding, so actual reuse of existing stock exceeds this share
- — Rebuilding at ¥816k per tsubo — 56% of new build (¥1.454M) over the five years combined. Extensions cost ¥1.390M, almost the same as new build, so being non-new-build does not in itself mean a cost advantage
- — ¥1.453bn vs ¥545M for 100 rooms — Against new build (assuming a 2026 start), the change-of-use route (assuming ¥800k per tsubo) is 38%. Even the conservative ¥1M-per-tsubo case comes to ¥681M
- — Zoning comes first — Hotels are not permitted in exclusively low-rise or mid/high-rise residential zones. Among 15 major prefectures, the non-new-build share ranges from 34.6% in Miyagi to 5.0% in Tokyo
Pin down the definitions first — what the construction statistics count, and what they miss
Before discussing a share, we need to fix what is being counted. The Statistics on Building Construction Starts aggregate the construction notices filed under Article 15 of the Building Standards Act, and they have only three types of work: new construction, extension and rebuilding. The decisive point is that a “change of use,” which alters only the use of a building without adding to or rebuilding it, is not a construction start at all.
When an office building is turned into a hotel, Article 87 of the Building Standards Act requires a building confirmation application if the new use is a special building (hotels and ryokan fall under column (i) of Appended Table 1) and the floor area involved in the change of use exceeds 200 m². That, however, is a “change-of-use confirmation application,” not a construction notice for new construction, extension or rebuilding. So even a building whose interiors and services are completely replaced to reopen as a 100-room hotel is not counted even once in the construction statistics, unless it also involves an extension or rebuilding.
Non-new-build is 16.7% of starts and 9.0% of floor area — the 14-year trend
Over the five years 2020–2024, construction starts for accommodation-use buildings totalled 5,707: 4,753 new builds (83.3%), 931 extensions (16.3%) and 23 rebuilds (0.40%). Non-new-build comes to 954 starts, or 16.7%, but extensions account for 97.6% of that; there were only 23 rebuilds in five years.
Over time, the non-new-build share fell step by step from 35.0% in 2011 to the 13–14% range in 2018–2020, when new hotel construction surged on inbound demand. It then rebounded to 20.6% in 2021 and has settled at 15.4% in 2023 and 15.6% in 2024. The main driver of the decline is that the denominator — new-build starts — nearly tripled from 2016 onward; the absolute number of non-new-build starts (164–227 a year over the latest five years) has in fact been stable.
By floor area, non-new-build work is smaller still. In 2024, accommodation-use construction starts covered 1,756,286 m² in total, of which extensions were 156,019 m² and rebuilds 2,483 m², a non-new-build share of just 9.0%. That is because floor area per building is 183 m² for extensions and 155 m² for rebuilds against 812 m² for new builds — about one-fifth of the scale. Non-new-build work is “reasonably frequent, but small per project.”
Cross-checking against our pipeline data — published building plans are also heavily skewed to new build
We test whether the picture from the construction statistics matches reality using a separate dataset. Within the coverage of MetroEngines Research, there are 70 pipeline hotels scheduled for completion in 2025 or later. Of these, 47 state their type of work: 46 new builds (97.9%) and 1 rebuild.
| Data | Base | New build | Non-new-build | Non-new-build share |
|---|---|---|---|---|
| Construction starts statistics (accommodation use, 2020–2024 total) | 5,707 | 4,753 | 954 | 16.7% |
| Construction starts statistics (accommodation use, 2024) | 1,288 | 1,087 | 201 | 15.6% |
| Construction starts statistics (accommodation and food service use, 2024) | 3,448 | 3,036 | 412 | 11.9% |
| Our pipeline hotels (those stating type of work) | 47 | 46 | 1 | 2.1% |
Against 16.7% in the construction statistics, the pipeline data show 2.1% — the two do not agree. The reason is the difference in population. Pipeline hotels are tracked from “published building plans” — newspapers, municipal announcements, developer releases — so the larger the new-build project, the more likely it is to be captured. Projects that refit the interior of an existing building into lodging, by contrast, issue a press release at opening, not at the planning stage. The sound reading is that the non-new-build route rarely shows up in either the construction statistics or planning information, and is proceeding largely invisible to the statistics.
Five non-new-build routes and the legal constraints on each
We sort non-new-build conversions to lodging into five types by the building’s previous use. All of them start from the change-of-use procedure under Article 87 of the Building Standards Act, and a confirmation application is required where the floor area exceeds 200 m² (the 2019 amendment of the Building Standards Act relaxed this threshold from over 100 m² to over 200 m²). Under the Inns and Hotels Act, both “hotel/ryokan business” and “simple lodging business” fall under the “hotel or ryokan” use class of the Building Standards Act, so this point is common to all.
| Type | Main constraints | Legal basis |
|---|---|---|
| Office building conversion | Securing vertical pipe routes for new wet areas in each guest room: an office needs one system per floor, but a hotel needs water supply and drainage for every room. Compliance with two-direction egress and vertical shaft compartmentation. | Building Standards Act Art. 87 (change of use); Enforcement Order Art. 112 (fire compartments) and Art. 120 (walking distance) |
| Commercial / multi-tenant building conversion | Treatment of existing non-conformity. On a change of use, Art. 87(3) of the Act applies the current provisions on egress and fire-fighting (those related to Art. 35) mutatis mutandis, i.e. retroactively. | Building Standards Act Art. 3(2) and Art. 87(3); Art. 35 of the same Act |
| Corporate retreat / company housing conversion | The zoning wall. Some were built as dormitories in low-rise residential zones, and hotels and ryokan cannot be built in Category I/II exclusively low-rise residential zones or Category I/II exclusively mid/high-rise residential zones. In a Category I residential zone they are limited to 3,000 m² or less. | Building Standards Act Appended Table 2 (restrictions on buildings within zoning districts) |
| School (closed school) conversion | Ceiling and floor-to-floor height. Habitable rooms need a ceiling height of at least 2.1 m, so fitting in service space matters when a large classroom is divided into guest rooms. School buildings are often located in Urbanization Control Areas or residential zones. | Building Standards Act Enforcement Order Art. 21 (ceiling height of habitable rooms); City Planning Act Art. 29 and Art. 34 |
| Reuse of a ryokan structure | A change-of-use confirmation application may not be needed (hotel and ryokan business are similar uses). Fire-fighting equipment, however, must meet current standards because the building is a specified fire-prevention property, and this applies retroactively whether or not there is any extension or rebuilding. | Building Standards Act Art. 87(1) (similar uses); Fire Service Act Art. 17-2-5 |
The provision that bites across all five types is Article 17-2-5 of the Fire Service Act. Existing non-conformity under the Building Standards Act can in principle remain as is, but fire-fighting equipment in a specified fire-prevention property (which hotels and ryokan are) is subject to retroactive application whenever the rules are amended. Sprinklers, automatic fire alarms and exit lights should be budgeted as preconditions regardless of how the structure is reused. Some municipalities also offer the Article 3(1)(iii) route, which removes the building from the application of the Building Standards Act altogether by local ordinance; 31 municipalities had adopted such exemption ordinances at the time of our count.
Economics — rebuilding costs 56% of new build per tsubo, but extensions cost almost the same as new build
We calculate cost per tsubo by type of work from the construction statistics. Combining the five years 2020–2024 gives ¥1.454M per tsubo for new build, ¥1.390M for extensions and ¥816k for rebuilding. The point to note is that extensions cost almost the same per tsubo as new build. Adding floor area to an existing building is small in scale and complicated at the junctions, so the unit cost per area does not come down easily. Since 97.6% of statistical “non-new-build” work is extensions, the statistical non-new-build bucket as a whole cannot be treated as a cheap alternative route. Converted to room counts, those extensions have added the equivalent of roughly 19,000 rooms over five years.
Taking 2024 alone, new build was ¥1.918M per tsubo, extensions ¥2.344M and rebuilding ¥1.177M, with extensions above new build. The rise in new build from ¥1.442M per tsubo in 2022 to ¥1.918M in 2024 is +33.0% in two years, and the level of building construction costs itself is shifting upward.
■ Calculation Assumptions
We compare building construction cost for a 100-room hotel delivered by three routes. We assume 18 m² of private guest-room area and a 20% loss ratio for corridors and other common areas, giving 6.81 tsubo per room and 681 tsubo for 100 rooms. For new build, we took the 2024 actual of ¥1.918M per tsubo and applied construction cost inflation (Turner & Townsend forecast: +5.6% in 2025, +5.3% in 2026) to get ¥2.133M for a 2026 start. For rebuilding we use the 2020–2024 combined figure of ¥816k per tsubo. The change-of-use route does not appear in the construction statistics, so there is no statistical value; we assumed ¥800k per tsubo for interior and services work (¥600k / ¥1M in the sensitivity analysis). Land acquisition, building acquisition, design and supervision fees, FF&E, pre-opening costs and the opportunity cost during construction are excluded. By hotel type, construction cost per room spans roughly ¥8.7M to ¥71.4M across three tiers.
| Route | Cost per tsubo | Cost per 100 rooms | Per room | vs new build |
|---|---|---|---|---|
| New build (2026 start, est.) | ¥2.133M | ¥1.453bn | ¥14.52M | 100% |
| New build (2024 starts, actual) | ¥1.918M | ¥1.306bn | ¥13.06M | 90% |
| Extension (2020–2024 combined) | ¥1.390M | ¥947M | ¥9.47M | 65% |
| Rebuilding (2020–2024 combined) | ¥816k | ¥556M | ¥5.56M | 38% |
| Change of use (assumed ¥800k per tsubo) | ¥800k | ¥545M | ¥5.45M | 38% |
In the sensitivity analysis, the change-of-use route costs ¥409M at ¥600k per tsubo and ¥681M at ¥1M per tsubo. Even at the most conservative ¥1M per tsubo, that is ¥772M, or 53%, less than new build (2026 start, est.) at ¥1.453bn. Put the other way, the change-of-use route would only exceed new build if the work cost more than ¥2.13M per tsubo, which is hard to envisage as long as the structure and foundations are reused.
Of the assumptions, the two that move the result most are the scope of change-of-use work (cost per tsubo) and guest-room size. The table below shows construction cost per room with both varied at once, holding the loss ratio at 20%. The ratio to new build is set by the ratio of costs per tsubo regardless of room size, so even if interior and services work widens to ¥1.4M per tsubo, the cost stays within 66% of new build. On the other hand, enlarging rooms to 30 m² lifts the cost to ¥9.08M per room even at ¥800k per tsubo — over 60% of the ¥14.52M for an 18 m² new-build room (2026 start, est.). For conversions, where room size is dictated by the floor-to-floor height and riser positions of the existing structure, this area-side sensitivity should be built into the evaluation of the acquisition price.
| Cost per tsubo \ room area | 15 m² | 18 m² | 22 m² | 26 m² | 30 m² | vs new build |
|---|---|---|---|---|---|---|
| Change of use at ¥600k per tsubo | ¥3.40M | ¥4.08M | ¥4.99M | ¥5.90M | ¥6.81M | 28% |
| Change of use at ¥800k per tsubo | ¥4.54M | ¥5.45M | ¥6.66M | ¥7.87M | ¥9.08M | 38% |
| Change of use at ¥1.0M per tsubo | ¥5.67M | ¥6.81M | ¥8.32M | ¥9.83M | ¥11.34M | 47% |
| Change of use at ¥1.2M per tsubo | ¥6.81M | ¥8.17M | ¥9.98M | ¥11.80M | ¥13.61M | 56% |
| Change of use at ¥1.4M per tsubo | ¥7.94M | ¥9.53M | ¥11.65M | ¥13.76M | ¥15.88M | 66% |
| Reference: new build at ¥2.133M per tsubo | ¥12.10M | ¥14.52M | ¥17.74M | ¥20.97M | ¥24.20M | 100% |
Timing differs too. In our measurement of 67 pipeline projects (Hotel Build Times), hotels took an average of 2.80 years from construction start to completion (1.96 years for single-use buildings, 4.00 years for mixed-use). Non-new-build projects, by contrast, average 183 m² per building for extensions and 155 m² for rebuilds — about one-fifth of the 812 m² for new builds — so the works are smaller. A change of use alone centres on the confirmation application and interior and services work. Because we have no statistical measurements of construction periods for non-new-build routes, this article does not put a number on the time saved; we limit ourselves to the qualitative point that the smaller scale of works should bring a corresponding reduction.
Location — non-new-build share is 34.6% in Miyagi and 5.0% in Tokyo; zoning decides the options
Looking at 2020–2024 starts by prefecture, the non-new-build share varies widely. Among 15 major prefectures, Miyagi (34.6%), Nagano (19.2%), Aichi (18.4%) and Shizuoka (16.0%) rank highest, while Tokyo’s 5.0% is the lowest of all 47 prefectures. Tokyo had only 14 non-new-build starts against 264 new-build starts over five years, which pulls the share down. Central Tokyo is also likely where changes of use — invisible in the construction statistics — are most concentrated, so this 5.0% cannot be read as “Tokyo reuses little existing stock.”
The first locational condition to bite on the non-new-build route is zoning. Under Appended Table 2 of the Building Standards Act, hotels and ryokan cannot be built in Category I/II exclusively low-rise residential zones, Category I/II exclusively mid/high-rise residential zones, industrial zones or exclusively industrial zones. In a Category I residential zone they are limited to 3,000 m² of floor area or less. Even if an existing structure is available, a change of use simply cannot happen in a zone where a hotel may not be built.
The table below shows what we found when we actually checked zoning data in the Real Estate Information Library for typical non-new-build locations.
| Route and reference location | Zoning districts in the vicinity (floor area ratio) | Hotel use permitted? |
|---|---|---|
| Office conversion / around Nihonbashi and Suitengumae, Chuo-ku, Tokyo | Mostly commercial zone (500–700%), partly quasi-industrial zone (400%) | Yes. Ample floor area ratio makes it easy to stack up rooms |
| Older-building conversion / around Hatagaya, Shibuya-ku, Tokyo | A mix of Category I exclusively mid/high-rise residential (200%), Category I residential (300%), neighborhood commercial (300%) and quasi-industrial (300%) | Depends on the block. Not permitted in Category I exclusively mid/high-rise residential; up to 3,000 m² in Category I residential |
| Retreat conversion / around Miyanoshita, Hakone, Kanagawa | Category I exclusively low-rise residential (50%), Category II exclusively low-rise residential (80%), Category I residential (200%), neighborhood commercial (200%) | Not permitted in exclusively low-rise residential zones. Where a retreat stands as a dormitory, check the zoning before conversion |
| Reuse of a ryokan structure / around Ginza-cho, Atami, Shizuoka | Commercial (400%), neighborhood commercial (400%), Category II exclusively mid/high-rise residential (200%) | Permitted in commercial and neighborhood commercial zones. Existing ryokan cluster on the commercial side |
| Closed-school conversion / Chonan, Chiba | No zoning designated (including areas outside City Planning Areas) | No zoning restriction applies, but check separately whether a development permit is needed under the City Planning Act |
Conclusion — as construction costs step up, existing stock becomes a realistic way to hold down acquisition cost
To restate the numbers: non-new-build work counted in the Statistics on Building Construction Starts is 954 of the 5,707 accommodation-use starts in 2020–2024, or 16.7%. 97.6% of that is extensions; rebuilding is just 23 starts, or 0.40%. By floor area, it was 9.0% in 2024. In our pipeline data, too, 46 of the 47 projects that state their type of work are new builds. As far as the statistics can see, Japan’s hotel supply is built almost entirely from new construction.
But this 16.7% is a lower bound. A change of use under Article 87 of the Building Standards Act is not counted in the construction statistics at all unless it involves an extension or rebuilding. A project that turns an existing building into a 100-room hotel is treated as zero in the statistics. To gauge the real extent of existing-stock reuse, one has to cross-check the construction statistics against planning information and still assume that some territory remains beyond reach.
954 of 5,707 accommodation-use starts in 2020–2024: 931 extensions and 23 rebuilds. 9.0% by floor area (2024).
Rebuilding costs 56% of new build per tsubo. Extensions cost almost the same as new build, so being non-new-build does not in itself mean a cost advantage.
The starting point is whether Appended Table 2 allows a hotel in the zone. Egress rules apply on a change of use, and fire-fighting equipment applies retroactively because hotels are specified fire-prevention properties.
New-build cost per tsubo rose +33.0% in two years, from ¥1.442M in 2022 to ¥1.918M in 2024, and reaches ¥2.133M for a 2026 start. In this environment, existing stock whose structure and foundations can be reused gains weight as a way to hold down acquisition cost. For 100 rooms, new build at ¥1.453bn versus ¥556M for the rebuilding route and ¥545M for the change-of-use route (¥681M even in the conservative ¥1M-per-tsubo case) — that gap means room to secure more rooms, or a better location, with the same investment budget.
A non-new-build scheme has the characteristic that its legal compliance can be assessed before anything is built. Zoning, the extent of existing non-conformity, compliance with two-direction egress and vertical shaft compartmentation, whether riser routes can be secured — all of these can be surfaced in pre-acquisition due diligence. The longer construction costs stay high, the more the accuracy of that assessment weighs on investment returns.
(1) 2024 is the latest published year of the Statistics on Building Construction Starts; figures for 2025 onward are not included. (2) Rebuilding has a small base of 23 starts and 31 buildings over five years, so its cost per tsubo is affected by individual projects. Single-year figures vary widely (from ¥151k per tsubo in 2023 to ¥1.177M per tsubo in 2024), so this article uses the five-year combined value. (3) The ¥800k per tsubo for the change-of-use route is an assumption, not a statistic; please read it together with the sensitivity analysis (¥600k / ¥1M). (4) Our pipeline hotel data cover what is collected from OTA listings and published building plans and are not a complete census; by the nature of the population, capture is skewed toward large new-build projects. (5) The zoning check shows the distribution within the tiles surrounding each reference location and does not indicate the designation of any specific site. (6) Legal compliance is determined by the competent building official and fire department; the analysis here is intended for narrowing down candidates.
Related Articles
- Corporate Retreat Conversions: 8.27% GOP Yield Across 5 Onsen Areas
- Hotel Build Times: 2.80-Year Median, 1.96 Solo vs 4.00 Mixed-Use
- Department Store Sites: 6 of 14 Go Hotel, ADR Needs 1.4-3.1x Market
References and Sources
■ Data sources
MLIT Statistics on Building Construction Starts, by use and type of work (e-Stat table ID 0003114493; annual 2011–2024; nationwide and all 47 prefectures; use category “52 Accommodation”), aggregated by number of starts, number of buildings, floor area and planned construction cost. The comparison with accommodation and food service use uses the same table’s use category “M: Accommodation and food service buildings” (2024). Zoning from the MLIT Real Estate Information Library; pipeline hotels from the coverage of MetroEngines Research & Consulting (70 projects scheduled for completion in 2025 or later, 47 stating type of work). Estimation assumptions are set out under “Calculation Assumptions” in the body, and limitations under “Limitations and Caveats” at the end.
■ Government statistics and public data
- e-Stat, MLIT Statistics on Building Construction Starts, by use and type of work / number of starts, number of buildings, floor area, planned construction cost (table ID: 0003114493; annual, through 2024)
- e-Stat, MLIT Statistics on Building Construction Starts, by use and structure / number of buildings, floor area, planned construction cost (table ID: 0003114547)
- MLIT Real Estate Information Library — city planning decisions (zoning) (in Japanese)
■ Laws and municipal guidance
- Fukuoka City Housing, Urban and Greenery Bureau, Building Guidance Department, Building Review Section, “Handling of Changes of Use (Building Standards Act Article 87),” April 2025 (in Japanese)
- Shinjuku City, “4-2 On Changes of Use” (effective October 1, 2020) (in Japanese)
- Tokyo Metropolitan Government Bureau of Urban Development, “Overview of Building Use Restrictions by Zoning District” (in Japanese)
- Building Standards Act Art. 3(2), Art. 15, Art. 35, Art. 87, Appended Tables 1 and 2; Enforcement Order Art. 21, Art. 112 and Art. 120; Fire Service Act Art. 17-2-5; City Planning Act Art. 29 and Art. 34
■ Market data and construction costs
- MetroEngines Research & Consulting — pipeline hotel data (70 projects scheduled for completion in 2025 or later, 47 of them stating type of work)
- Turner & Townsend construction cost inflation forecasts (+5.6% in 2025, +5.3% in 2026)