

Inventory at a sold-out property does not necessarily stay sold out. Cancellations, released group blocks, additional allocation pushed out by the hotel — the reasons vary, but rooms on OTAs and similar channels come back again and again, right up to check-in. This article takes the completed 2026 Obon period (August 13-16) and the in-progress Silver Week dates (September 19, 21 and 22), tracks property-level inventory on a room basis across six areas and four property types, and quantifies how often re-released inventory occurs after a sell-out, in which lead-time bands, and in what room counts.
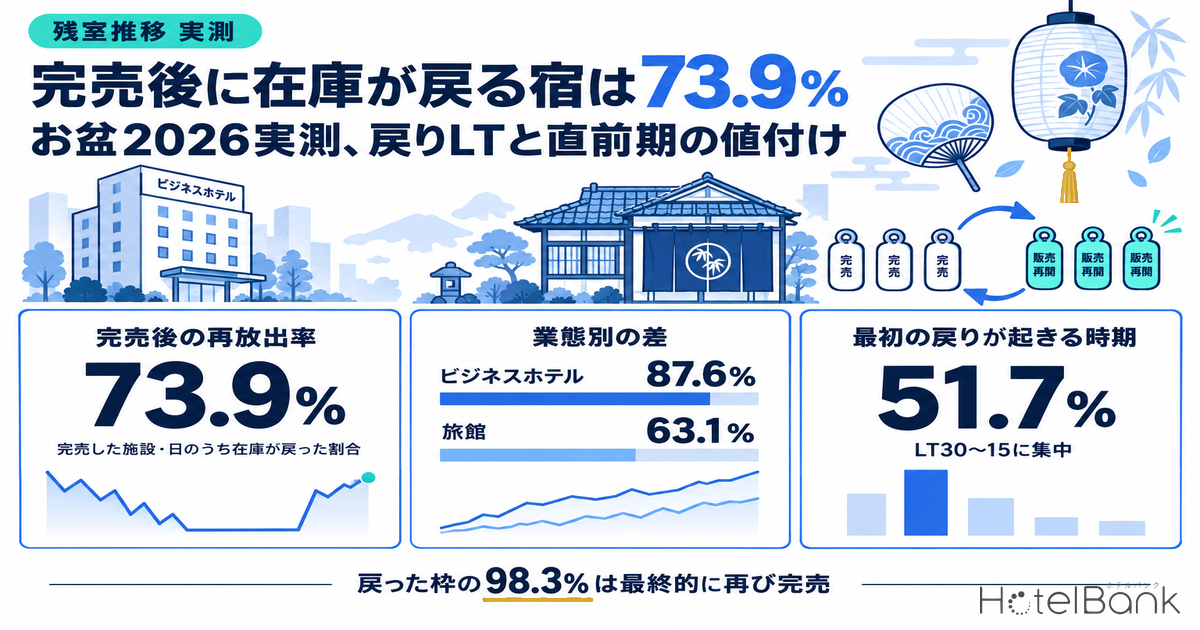
- Of the 652 property-dates (442 properties) that recorded a sell-out over Obon 2026 (August 13-16), 482, or 73.9%, saw rooms come back on sale afterwards. The 95% confidence interval is 70.5-77.3%.
- Those returning rooms did not sit unsold. 98.3% of the 482 property-dates with a restock were back at zero rooms available by the final observation.
- The sharpest divide was property type. Business hotels came in at 87.6% (N=241) against ryokan at 63.1% (N=263) — a gap of 24.5pt (95% confidence interval 17.3-31.7pt).
- First restocks cluster at 51.7% in LT30-15, yet across all 1,635 restock events the close-in window (LT14 and under) accounts for 60.1%.
- Restocks are small. The median first restock was 1 room and 75.1% were 1-2 rooms; the large-release pattern of “5 or more rooms sustained for 3 days or longer” accounted for only 14.7%.
- Pricing on returned rooms broke down as 33.0% priced up, 46.1% roughly unchanged and 21.0% priced down. In LT14-8 the share priced up rises to 40%, so operators are not defaulting to discounts as check-in approaches.
Metric Definitions Used in This Article
- LT (lead time): days remaining until the check-in date. LT0 = the day itself. All observations in this article fall in the LT45-LT0 range.
- Rooms available: the number of bookable rooms listed on OTAs and similar channels at each observation point, counted on a room basis — not a count of rate plans.
- Sell-out (as defined here): among property-dates that had at least one room available at or after LT45, those recording zero rooms available across two or more consecutive observation points, where that first occurrence did not happen later than LT15 (that is, at least two weeks of observation remain after the sell-out). A single isolated observation of zero rooms, which can reflect a temporary listing fluctuation, is not counted.
- Restock (re-release): after a sell-out as defined above, at least one occurrence of rooms available increasing from the previous observation at a shorter lead time.
- Population: only properties observed to list at least 30% of their total rooms on OTAs and similar channels. Properties that restrict what they allocate are excluded, because changes in their listed inventory do not represent supply and demand for the property as a whole.
- Listed rate: the lowest plan rate at each observation point (two guests in one room, per room, tax included). This is not the same as estimated settled ADR.
- Data source: MetroEngines Research
Inventory came back at 73.9% of sold-out property-dates
Start with Obon, where the outcome is settled. Across six areas — Tokyo, Osaka, Kyoto, Hokkaido, Okinawa and Fukuoka — and four property types — business hotels, city hotels, ryokan and resort hotels — we collected property-level inventory trajectories for the four stay dates of August 13-16. Of 8,295 property-date trajectories (2,463 properties), 652 (442 properties) recorded a sell-out under the definition used here. Of those, 482 (73.9%) saw rooms return after the sell-out. On a property basis, 366 of 442 properties are covered.
Restocks are not one-off events. Among the 482 property-dates with a restock, the median number of restocks was 2, the mean 3.39, and the busiest property-date recorded 16. A sell-out is not the end of the line: for many properties the cycle of sell-out, restock, re-absorption and sell-out again continues until close to arrival. Indeed, 98.3% of those 482 property-dates were back at zero rooms available at the final observation. Rooms that come back almost always sell.
Source: MetroEngines Research; compiled by the HotelBank Editorial Team
By area, Hokkaido led over Obon at 80.6% (N=227), followed by Osaka at 80.0% (N=30) and Fukuoka at 78.2% (N=101). Kyoto was lowest at 60.9% (N=128). Roughly 70% of Kyoto’s population is ryokan, so the property-type composition discussed below comes through directly. The ordering is broadly stable over the in-progress Silver Week dates as well, with Kyoto again sitting a step lower at 61.6% (N=276). For how Kyoto’s ryokan build inventory in the close-in window, Kyoto Obon 2026 Booking Curves: Ryokan Add the Most Close In follows the booking curves by property type in detail.
Business hotels 87.6%, ryokan 63.1% — a 24pt gap by property type
The clearest split was by property type. Over Obon the restock rate was 87.6% for business hotels (N=241) and 80.0% for city hotels (N=25), against 69.1% for resort hotels (N=123) and 63.1% for ryokan (N=263). Business hotels and ryokan are 24.5pt apart.
The gap reads as a difference in the character of the inventory. Business hotels hold many rooms of identical specification, single-room cancellations occur as a matter of routine, and putting a room back on sale takes little effort. Ryokan, by contrast, hold inventory split finely by room type and tied to food procurement and staffing, which makes it harder to simply resell a late cancellation. Resort hotels sitting between the two (69.1%) is consistent with that reading. Note also that occupancy metrics on their own are easy to misread here: a property that fills broadly and thinly and a property that sells out early can look similar in an occupancy series even though their inventory behaviour differs.
Source: MetroEngines Research; compiled by the HotelBank Editorial Team
Crossing area with property type sharpens the picture further. Over Obon, business hotels cleared 90% in Fukuoka (93.6%, N=47), Hokkaido (92.4%, N=66) and Okinawa (93.9%, N=33), while ryokan stayed near half in Kyoto (51.7%, N=87) and Fukuoka (51.6%, N=31). Even within Hokkaido, business hotels at 92.4% sit against ryokan at 77.2% (N=114) and resort hotels at 68.3% (N=41).
| Area | Business | City | Resort | Ryokan | Overall |
|---|---|---|---|---|---|
| Hokkaido | 92.4% (66) | — | 68.3% (41) | 77.2% (114) | 80.6% (227) |
| Osaka | 81.2% (16) | — | — | — | 80.0% (30) |
| Fukuoka | 93.6% (47) | — | — | 51.6% (31) | 78.2% (101) |
| Tokyo | 73.9% (46) | — | — | — | 71.9% (64) |
| Okinawa | 93.9% (33) | — | 65.1% (63) | — | 70.6% (102) |
| Kyoto | 84.8% (33) | — | — | 51.7% (87) | 60.9% (128) |
Restock rate over Obon 2026 (Aug 13-16). Figures in parentheses are the number of property-dates that recorded a sell-out. Cells with N<15 are shown as “—”. Source: MetroEngines Research; compiled by the HotelBank Editorial Team
Restocks cluster in LT30-15, and still occur at 6 in 10 properties inside LT7
Next, when restocks happen. For the 482 Obon property-dates, the LT band in which the first restock was observed was LT30-15 for 51.7% — a majority — with LT45-31 at 14.5%, LT14-8 at 23.4%, LT7-3 at 8.9% and LT2-0 at 1.5%. The first restock concentrates in the two weeks to one month before check-in, just as booking activity picks up in earnest.
Because restocks do not stop at one, however, the distribution shifts considerably later when measured across all restock events (1,635 in total over Obon): LT30-15 at 34.0%, LT14-8 at 31.4%, LT7-3 at 23.7% and LT2-0 at 5.0%. The close-in window (LT14 and under) alone accounts for 60% of the total. At the property level, of the 482 property-dates with a restock, 82.8% also had a restock inside LT14, 59.1% inside LT7 and 28.0% inside LT3. Measured against the full base of 652 sold-out property-dates, cases with inventory returning inside LT7 still reach 43.7%.
Source: MetroEngines Research; compiled by the HotelBank Editorial Team
Silver Week (September 19, 21 and 22; N=1,191) showed the same structure. First restocks fell in LT30-15 for 49.5%, and on an all-events basis LT14-8 accounted for 29.5% and LT7-3 for 26.9%. September 21 and 22 are still before check-in, so those figures are an in-progress snapshot rather than a settled result — but as far as observations go to date, the curve has the same shape as Obon.
Three quarters of restocks are 1-2 rooms — large releases are 15%
How large are the restocks? Over Obon the first restock was a median of 1 room and a mean of 4.0 rooms. 75.1% were 1-2 rooms, and restocks of 5 rooms or more accounted for 16.2%. Adding the condition “5 or more rooms sustained for 3 days or longer” — the shape that reads as a hotel deliberately adding allocation — brings the figure down to 14.7% (71 cases). At the other end, the one-off pattern of “1-2 rooms that disappear within 2 days” accounts for 32.6% (157 cases).
In other words, most observed restocks are small-lot churn originating in cancellations, and large movements such as additional allotment releases stay in the low teens as a share of the total. The two call for completely different readings on the operator’s side. Small-lot churn is inventory that appears on its own and has a good chance of selling close-in even if left alone. A large release is inventory created by the property’s own decision, and it will sit unsold unless price and the path to booking are designed together.
| Restock pattern | Criteria (first restock) | Obon | SW (in progress) |
|---|---|---|---|
| One-off, small lot (cancellation churn) | 1-2 rooms, gone within 2 days | 32.6% (157) | 48.6% (430) |
| Large, sustained (presumed added allocation) | 5+ rooms, sustained 3 days or longer | 14.7% (71) | 9.7% (86) |
| Other (intermediate) | Neither of the above | 52.7% (254) | 41.7% (369) |
| Property-dates with a restock (base) | 482 | 885 | |
Source: MetroEngines Research; compiled by the HotelBank Editorial Team
Pricing on returned rooms — 33% up, 21% down
When inventory came back, how did the listed rate move? For the 482 Obon property-dates we compared the lowest plan rate just before the sell-out with the lowest plan rate at the observation where the restock appeared. The result: 33.0% priced up (more than +2%), 46.1% roughly unchanged (within ±2%) and 21.0% priced down (more than −2%). The median was no change (a ratio of 1.000).
What stands out is the variation by LT band. Bands here are assigned by the band in which the first restock was observed, so the base breakdown matches the first-restock LT distribution from the previous section (LT45-31 at 14.5%, LT30-15 at 51.7%, LT14-8 at 23.4%, LT7-3 at 8.9%) across the same 482 property-dates. Restocks in LT45-31 were priced up 30% of the time and down 13%, whereas LT14-8 ran 40% up and 21% down, and LT7-3 ran 37% up and 21% down: the closer to check-in, the higher the share priced up. For inventory that comes back on a date that already sold out once, at least a little under 40% of operators choose to re-list without cutting the rate, even close in. And as noted above, 98.3% of returned rooms ultimately sold.
Case 1: 53 rooms returned at once, five days after sell-out, in Naha
A textbook large release is August 13 at Ryukyu Orion Hotel Naha Kokusai-dori (琉球オリオンホテル 那覇国際通り, 205 rooms). Inventory that stood at 74 rooms at LT45 was absorbed steadily — 6 rooms at LT30, down to 5 at LT21 — and the LT20 and LT18 observations both recorded zero rooms available. Then the LT15 observation shows inventory back up to 53 rooms. Absorption resumed from there: 29 rooms at LT9, 19 at LT7, 3 at LT5, and zero at the final observation (LT0).
The rate movement is readable too. The lowest plan rate of ¥18,100 just before the sell-out at LT21 ticked slightly higher to ¥18,600 at LT15 when the 53 rooms returned, then came down to ¥16,000 over LT9-LT7. The pattern suggests the rate was held immediately after a sizeable block was put back, then adjusted close in as absorption was observed. The date ultimately sold out. For how early Okinawa’s Obon demand builds, Okinawa Resort Obon 2026 Booking Pace traces sell-out cases as far back as LT70.
Source: MetroEngines Research; compiled by the HotelBank Editorial Team
Case 2: nine restocks around a seven-day sell-out at Kawayu Onsen
The second is August 15 at Kawayu Kanko Hotel (川湯観光ホテル, 67 rooms, Hokkaido), a representative cycling pattern. Inventory hit zero once at LT32, 17 rooms returned at LT31, and then seven consecutive days of zero rooms available ran from LT27 to LT21. Inventory then came back in stages — 3 rooms at LT20, 16 at LT17, 21 at LT16 — before oscillating again: 1 room at LT13, back to zero at LT12-11, and 17 rooms at LT10, repeating up to close in. Restocks numbered nine in all.
The rate, by contrast, stepped up. The lowest plan rate of ¥22,100 during the sell-out through LT21 became ¥23,100 at LT20 when inventory returned, and ¥24,300 from LT16 onward: the returned rooms were re-listed roughly 10% higher on the evidence of having sold out. The final observation (LT0) was zero rooms available, so the inventory was absorbed even at that rate. Guest review scores support the reading that demand was deep: reviews mentioning the bath scored 4.46/5.0 (2,923 bath-related reviews out of 3,611 guest reviews compiled by the HotelBank Editorial Team).
Source: MetroEngines Research; compiled by the HotelBank Editorial Team
How far can this number move — confidence intervals and criteria
The 73.9% restock rate is a proportion based on 652 observations, giving a 95% confidence interval of 70.5-77.3% (±3.4pt) as a sample proportion. On the in-progress Silver Week side (N=1,191), 74.3% carries a 95% confidence interval of 71.8-76.8%, and the two intervals overlap heavily. Landing at the same level across two demand peaks in different seasons is circumstantial evidence that the ratio is not an accident of particular dates. The property-type gap holds up as well: the 24.5pt difference between business hotels at 87.6% (N=241) and ryokan at 63.1% (N=263) has a 95% confidence interval of 17.3-31.7pt, which does not include zero. Area-level figures, by contrast, rest on small bases — Osaka’s 80.0% (N=30) has a 95% confidence interval spanning 65.7-94.3%. Area rankings should not be read as settled.
What moves the conclusion more than the ratio itself is how “sell-out” and “restock” are defined. The following sets out which way the restock rate would swing if the criteria were changed; these are directional, not re-tabulated figures.
- Relaxing the two-consecutive-observation requirement for zero rooms to a single observation pushes the ratio up. Temporary gaps in listings would enter the base as sell-outs, and those “return” at the next observation. Requiring two observation points is precisely how this article avoids that upward bias, and loosening in this direction can only flatter the number.
- Dropping the requirement that the first sell-out occur no later than LT15 pushes the ratio down. Property-dates that first sell out after LT15 have less than two weeks of remaining observation in which a restock could be seen. That short observation window gets recorded as “did not come back”, so the wider the base, the lower the ratio.
- Lowering the 30% listing-share condition on the population makes the ratio unstable. At properties that restrict allocation, changes in rooms available do not track supply and demand for the property as a whole, and a listing adjustment of a few rooms moves the ratio substantially. The direction depends on the area and property-type mix, and could go either way.
- Including observations before LT45 changes the definition of a sell-out itself. The “not yet on sale” state before listing inventory is loaded becomes indistinguishable from a sell-out, which is why this article excludes it from every tabulation.
The 73.9% here is therefore best read as a conservative estimate under deliberately strict criteria. More of the conditions push the number up when relaxed, and the conclusion — that inventory returning after a sell-out is not exceptional — barely depends on where the criteria are set.
Four readings operators can use
1. Do not treat a sell-out date as a finished date. In the Obon data, 73.9% of sold-out property-dates saw inventory return, and 98.3% of those sold out again in the end. A date that has sold out is the date where watching inventory and rate until close in has the most value. Business hotels apply at 87.6%, so simply pushing back the point at which the report is closed by one to two weeks leaves revenue to be picked up.
2. Discounting close in is not the default. 40% of the inventory that returned in LT14-8 was re-listed above the rate just before the sell-out, and only 21% was discounted. The one or two rooms left on a date that already sold out are more likely to meet guests who must stay that night than price-elastic demand. Rather than lowering the whole date, it is more coherent to list just the returned rooms on separate terms — non-refundable, excluded from last-minute discounts, and so on.
3. A waitlist path works in LT14-LT3. 60.1% of restock events occur inside LT14, and 59.1% of property-dates with a restock also had inventory return inside LT7. Putting a waitlist sign-up and notification path on the sold-out page of the official site keeps demand that met a sell-out on OTAs and similar channels within the property’s own channel. Given that most restocks are 1-2 rooms, notifying at the granularity of “first party only” is enough to make it work.
4. If you are releasing a large block, LT30-15 draws the best response. The fact that 51.7% of first restocks concentrate in that band is itself the flip side of the market looking for inventory at that point. Large releases inside LT7, conversely, meet thinner demand to absorb them, so recovering through stay conditions — lifting consecutive-night minimums, flexible check-in times — is more realistic than through price.
⚠ Note on in-progress dates: On the Silver Week side, September 21 and 22 are dates before check-in, and the figures here are an in-progress reading of what had been observed as of the research date (September 20, 2026). They will move with future bookings, cancellations and inventory adjustments, so settled conclusions are stated on the basis of the past dates — Obon (August 13-16) and September 19.
Methodology and scope
The scope is six areas — Tokyo, Osaka, Kyoto, Hokkaido, Okinawa and Fukuoka — and four property types: business hotels, city hotels, ryokan and resort hotels. Stay dates are August 13-16, 2026 (Obon, settled) and September 19, 21 and 22 (Silver Week). We collected 13,994 property-date inventory trajectories, of which the 13,960 with 10 or more observation points were analysed. The unique property count is 2,730.
All properties in scope were observed to list at least 30% of their total rooms on OTAs and similar channels. Where the published allocation is small, several explanations are possible — operations centred on channels other than OTAs, releasing inventory in small batches, or a small contractual allotment — and supply and demand cannot be read from changes in rooms available.
Sell-out determination uses only rooms available (room basis); no ratio based on a count of rate plans is used. Cases where zero rooms appear at a single observation point with ample inventory on either side are not counted as sell-outs, since they may be temporary listing fluctuations. Observations before LT45 are excluded from every tabulation, as they can include the state before listing inventory is loaded and may not represent booking progress.
Frequently asked questions
How is a “sell-out” determined in this article?
Only a state of zero rooms available on OTAs and similar channels recorded across two or more consecutive observation points counts as a sell-out. A single observation of zero rooms with inventory on either side is not counted, since it may be a temporary listing fluctuation. We further restrict the base to cases where the first sell-out occurred no later than LT15, so that at least two weeks of observation remain afterwards. The determination uses rooms available (room basis) only, not a count of rate plans.
How reliable is the 73.9% restock rate?
It is a sample proportion based on 652 observations, with a 95% confidence interval of 70.5-77.3% (±3.4pt). The in-progress Silver Week dates (N=1,191) land at a comparable 74.3% (95% confidence interval 71.8-76.8%), and the two intervals overlap substantially. Area-level figures, however, rest on small bases — Osaka’s 80.0% comes from N=30 with an interval spanning 65.7-94.3% — so avoid reading the ranking between areas as settled.
Why is the gap between property types this wide?
It reads as a difference in the character of the inventory. Business hotels hold many rooms of identical specification, single-room cancellations occur routinely, and putting a room back on sale takes little effort. Ryokan hold inventory split finely by room type and tied to food procurement and staffing, which makes it harder to resell a late cancellation as is. Resort hotels sitting between the two at 69.1% is consistent with that view. That said, this article describes an observed difference; it does not test causation.
Would different criteria change the conclusion?
The level moves, but the direction does not. Treating a single observation of zero rooms as a sell-out lets temporary listing gaps into the base and biases the ratio upward; dropping the requirement that the first sell-out fall no later than LT15 lets properties with too short an observation window into the base and biases it downward. More of the conditions push the number up when relaxed, so 73.9% can be regarded as a conservative estimate under strict criteria. The conclusion itself — that inventory returning after a sell-out is not exceptional — is almost independent of where the criteria are set.
Can the Silver Week figures be used as they stand?
September 19 is past its stay date, but September 21 and 22 were still before check-in as of the research date for this article (September 20, 2026), so those figures are an in-progress reading. They will move with future bookings, cancellations and inventory adjustments. Settled conclusions are stated on the basis of the past dates — Obon (August 13-16) and September 19 — with the Silver Week side used to confirm the pattern.
Should returned inventory be re-listed at a discount?
In the observed data, discounting is not the default. Across the 482 Obon property-dates, 33.0% were priced up (more than +2%), 46.1% roughly unchanged (within ±2%) and 21.0% priced down (more than −2%), with a median of no change. Restricting to inventory that returned in LT14-8, the share priced up rises to 40%. And 98.3% of returned rooms ultimately sold. The one or two rooms left on a date that already sold out are unlikely to meet price-elastic demand, so listing just the returned rooms on separate terms is more coherent than lowering the whole date. This is the observed distribution of operator practice, however; it does not show that raising rates increases revenue.
Related reading
- Kyoto Obon 2026 Booking Curves: Ryokan Add the Most Close In, +11.4pt
- Okinawa Resort Obon 2026 Booking Pace — 67-Room Property Hits LT70 Sellout
- Tokyo Early Sep: Booking Curves at T-45/T-30/T-14, OCC 76.0-81.5%
- Osaka Obon 2026 Booking Curve: Aug 14 at 74.9%, Aug 16 Stuck at 64.1%
References and sources
■ Data source
Covering six areas — Tokyo, Osaka, Kyoto, Hokkaido, Okinawa and Fukuoka — and four property types (business hotels, city hotels, ryokan, resort hotels), we collected 13,994 property-date inventory trajectories (2,730 unique properties; observation period June to September 20, 2026). The 13,960 with 10 or more observation points were analysed, and the population is limited to properties observed to list at least 30% of their total rooms on OTAs and similar channels. Stay dates are August 13-16, 2026 (Obon, settled) and September 19, 21 and 22 (Silver Week). Rooms available and listed rates are both based on information published on OTAs and similar channels at each observation point. Property names and room counts were cross-checked against each property’s published information and the tourism information of the municipality in which it is located.
■ Calculation assumptions
Sell-out = among property-dates with at least one room available at or after LT45, those recording zero rooms available across two or more consecutive observation points where that first occurrence was no later than LT15. Restock = after such a sell-out, at least one occurrence of rooms available increasing from the previous observation at a shorter lead time. Restock rate = property-dates with a restock ÷ property-dates that recorded a sell-out, in units of property × stay date. The listed rate is the lowest plan rate at each observation point (two guests in one room, per room, tax included), which is not the same as estimated settled ADR. Pricing categories use the ratio of the lowest plan rate just before the sell-out to the rate at the restock observation, with ±2% treated as “roughly unchanged”. Confidence intervals are 95% intervals from the normal approximation to a sample proportion. Cells with N<15 are not shown.
■ Limitations
What is observable is inventory published on OTAs and similar channels; it does not include a property’s overall vacancy or inventory held for its own site and telephone bookings. It therefore cannot be determined directly whether a “restock” originated in a cancellation or in additional release by the property, and the pattern classification used here (small-lot churn / large release) is inferred from size and persistence. Because observation is discrete, movements shorter than the observation interval are not captured, so restock counts are a lower bound. Among the Silver Week dates, September 21 and 22 are in-progress readings before check-in rather than settled values. Area-level and property-type cells include small bases, and interpreting the ranking requires taking the width of the confidence intervals into account. This article describes an observed distribution; it does not test the effect of pricing or booking-path measures on revenue.
■ Market data
- MetroEngines Research — property-level inventory trajectories (6 areas × 4 property types, 13,994 property-dates, 2,730 properties, observation period June to September 20, 2026)
- HotelBank Editorial Team research — guest review aggregation (Kawayu Kanko Hotel, N=3,611)
- Ken Hotel & Resort, “Ryukyu Orion Hotel Naha Kokusai-dori” property overview (205 rooms)
- Teshikaga Navi (Teshikaga Town Tourism Association), “Kawayu Kanko Hotel” property information (67 rooms)
- Japan Tourism Agency, “Overnight Travel Statistics Survey” (reference for the official definition of occupancy)
- Japan National Tourism Organization (JNTO), “Foreign Visitors to Japan Statistics”