

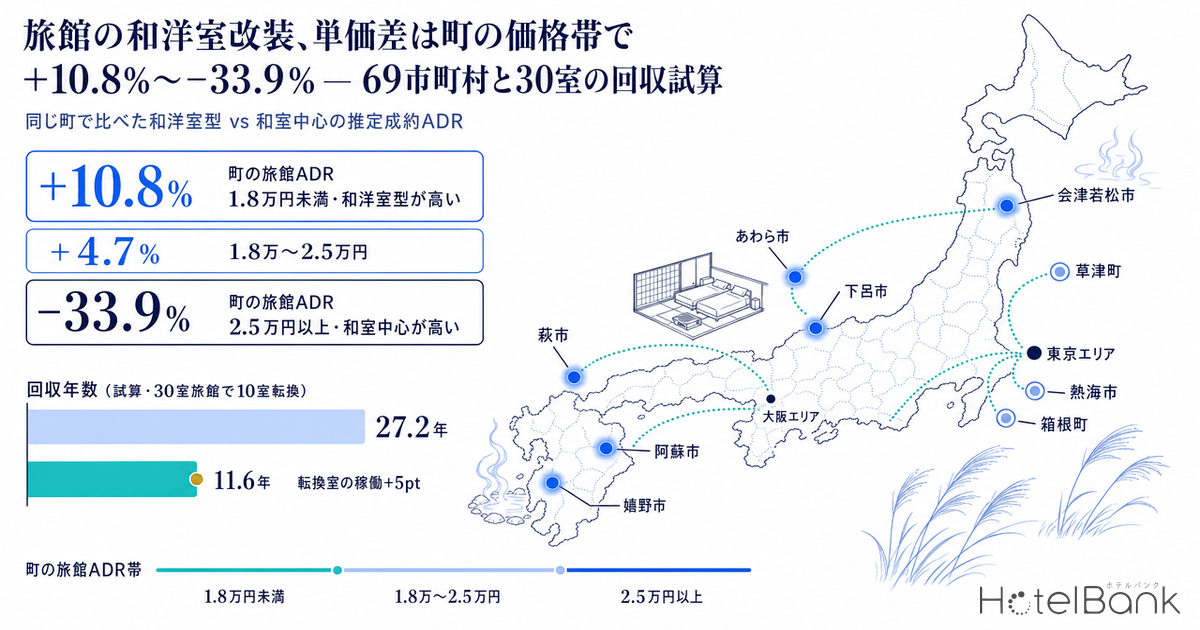
How far does converting a ryokan guest room from a pure tatami room to a wayoshitsu — a Japanese-Western room, where beds sit on the tatami floor — actually move the room rate? For this analysis we used semantic analysis of guest reviews to identify ryokan and resorts where “Japanese-Western room” and “Japanese-style room” are talked about, grouped them by municipality, and then compared the estimated settled ADR (trailing 12 months) of properties whose reviews centre on Japanese-Western rooms against those whose reviews centre on tatami rooms — strictly within the same municipality. The sample is 68 municipalities: 114 Japanese-Western-led properties and 299 tatami-led properties. The headline finding first: the direction of the rate gap flips with the town’s price band. In municipalities where the town’s ryokan ADR is below ¥18,000, Japanese-Western-led properties run +10.8% higher; in municipalities at ¥25,000 and above, Japanese-Western-led properties sit 33.9% below tatami-led ones, because there the tatami room is itself the premium product. On top of that, we model the payback period for a 30-room onsen ryokan converting 10 rooms.
How this differs from our earlier work: our earlier piece on where inbound guests who want a tatami room actually go dealt with demand for tatami rooms themselves. This article is about the investment case for converting tatami rooms into Japanese-Western rooms, and it is not an argument against tatami — we also show the segment that commands high rates while staying purely tatami. It also differs from our earlier work on the measured ROI of brand conversions, and from our work on the real capex of a hotel renovation, in that it narrows the renovation to one single move: changing the room type. The method for counting revenue lost while rooms are out of service is taken unchanged from the latter.
Metric Definitions Used in This Article
- ADR (average daily rate): an estimated settled rate (tax-excluded equivalent), derived by applying a property-type correction factor to the lowest published plan level each property lists on OTAs (two guests per room, per-room price, tax included). Cross-checked against property-level actuals disclosed by listed hotel REITs (91 properties, trailing three months), the median error is about 7%. These are estimates and differ from any individual property’s actual transacted rates or accounting figures. Property ADR in this article is the median of the 12 confirmed months from September 2025 to August 2026; the town’s ryokan ADR is the median across ryokan within that municipality (the standard level for a property in that area).
- Room occupancy rate: the occupancy used in this article’s modelling is the room occupancy rate by accommodation type from the Japan Tourism Agency “Accommodation Travel Statistics Survey”, 2025 annual figures (final), i.e. published official actuals. Note that the OCC we calculate separately — the share of sold rooms against total rooms in an area, estimated from OTA sales inventory — is not used in this modelling.
- Japanese-Western-led / tatami-led: classified by semantic analysis of the trailing 24 months of guest reviews, counting mentions of “Japanese-Western room” and “Japanese-style room” in a positive context. Japanese-Western-led = at least 5 Japanese-Western mentions and at least as many as tatami mentions. Tatami-led = at least 5 tatami mentions and Japanese-Western mentions no more than one third of tatami mentions. Properties matching neither are classed as “mixed”. Mention counts are not quality scores.
- Rate gap: within a single municipality, the difference between the median property ADR of Japanese-Western-led properties and that of tatami-led properties. This is a cross-sectional comparison, not the rate lift produced by a renovation.
- Data sources: MetroEngines Research & Consulting (estimated settled ADR) / HotelBank Editorial Team research (NLP analysis of guest reviews) / Japan Tourism Agency “Accommodation Travel Statistics Survey”
Towns with room to lift the rate
Across the 42 municipalities where the town’s ryokan ADR is below ¥18,000, Japanese-Western-led properties run +10.8% above tatami-led ones (median, roughly ¥1,800). Converting part of the room stock is the likeliest investment opportunity here.
Towns to judge on occupancy gains
In the 20 municipalities between ¥18,000 and ¥25,000 the gap narrows to +4.7%. The rate gap alone gives a long payback horizon, so the deciding factor becomes the occupancy gain from capturing elderly family guests and three-generation trips who want beds.
Towns where polishing the tatami room works
In the 6 municipalities at ¥25,000 and above (Hakone, Atami and others), tatami-led properties out-earn Japanese-Western-led ones on ADR. In this price band the tatami room is itself the premium product, and renovations that raise tatami quality hold the potential.
- — +10.8% Across the 42 municipalities with a town ryokan ADR below ¥18,000, Japanese-Western-led properties post a higher estimated settled ADR than tatami-led ones (municipal median, September 2025 to August 2026).
- — −33.9% In the 6 municipalities at ¥25,000 and above (Hakone, Atami and others), tatami-led properties command the premium in every single town. The investment opportunity lies in raising tatami quality.
- — 98.3% Mentions of Japanese-Western rooms are overwhelmingly in Japanese (245 properties, 2,593 mentions). Inbound guests do not use the term at all; they describe the room as a tatami room with a bed.
- — 27.2 years Payback from the rate gap alone for Case A — a 30-room ryokan converting 10 rooms at ¥750,000 per tsubo. Across a construction cost range of ¥500,000 to ¥1,000,000 per tsubo, payback runs 18.5 to 35.9 years.
- — 11.6 years Payback if the converted rooms gain +5pt of occupancy. What moves the investment case is the size of the rate gap plus the occupancy lift from guests who specifically ask for a Japanese-Western room.
245 ryokan and resorts nationwide are talked about for Japanese-Western rooms — concentrated in Nagano, Kumamoto and Fukushima
Start with the universe. For each prefecture we extracted the properties with a high volume of Japanese-Western room mentions (a baseline of 5 or more mentions, raised in regions with large property counts). Narrowed to ryokan and resorts, that is 245 properties and 24,295 guest rooms, with 3,045 mentions. Nagano leads with 28 properties, followed by Kumamoto (19, concentrated in the Aso area) and Fukushima (17). All three hold large numbers of highland and mountain-valley onsen destinations, and see heavy family and three-generation stays.
| Prefecture | Properties | Guest rooms | Japanese-Western mentions | Ryokan room occupancy (2025) |
|---|---|---|---|---|
| Nagano | 28 | 2,638 | 242 | 27.2% |
| Kumamoto | 19 | 1,107 | 181 | 41.9% |
| Fukushima | 17 | 1,904 | 196 | 37.1% |
| Nagasaki | 12 | 1,067 | 123 | 39.8% |
| Gifu | 10 | 942 | 133 | 41.5% |
| Okinawa | 10 | 2,132 | 87 | 43.6% |
| Niigata | 10 | 1,184 | 87 | 28.4% |
| Tottori | 9 | 740 | 100 | 45.3% |
The map plots the 68 municipalities whose rates we compare in the next section. Circle colour shows the direction of the rate gap (dark blue = Japanese-Western-led higher, grey = tatami-led higher); circle size is the number of properties used in the comparison. Towns where Japanese-Western-led properties run higher cluster in the mid-priced onsen destinations of Tohoku, Hokuriku and Kyushu, while towns where tatami-led properties run higher gather in the high-priced onsen destinations near the Tokyo metropolitan area.
Compared within the same town, the rate gap changes direction with the town’s price band
To strip out differences in location, every comparison is made strictly inside a single municipality. Across the 68 municipalities that contain both Japanese-Western-led and tatami-led properties, we subtracted the median property ADR of tatami-led properties from that of Japanese-Western-led ones. Overall the dispersion is wide. We therefore split the municipalities into three price bands using the median ADR across all ryokan in each town (aggregated separately from the two comparison groups, as the town’s standard level).
The result is clear-cut. In the 42 municipalities where the town’s ryokan ADR is below ¥18,000, Japanese-Western-led properties run +10.8% higher, and they come out on top in 57.1% of those towns. In the 20 municipalities between ¥18,000 and ¥25,000 the gap narrows to +4.7%. By contrast, in the 6 municipalities at ¥25,000 and above, tatami-led properties post the higher ADR in every single town, with a median gap of −33.9%. Narrowing to the 25 municipalities that hold at least two properties in each group leaves the same ordering.
| Town ryokan ADR band | Municipalities | Japanese-Western-led | Tatami-led | Japanese-Western ADR | Tatami-led ADR | Rate gap (median) | Towns where Japanese-Western leads |
|---|---|---|---|---|---|---|---|
| Under ¥18,000 | 42 | 58 | 144 | ¥17,900 | ¥17,100 | +10.8% | 57.1% |
| ¥18,000–¥25,000 | 20 | 38 | 110 | ¥21,200 | ¥20,100 | +4.7% | 60.0% |
| ¥25,000 and above | 6 | 18 | 45 | ¥17,900 | ¥29,100 | −33.9% | 0.0% |
We also ranked the gap municipality by municipality, across the 25 towns holding at least two properties in each group. At the top are Awara in Fukui (+128.5%), Ureshino in Saga (+84.4%), Hagi in Yamaguchi (+77.6%) and Aso in Kumamoto (+72.8%), with Aizuwakamatsu and Gero also landing on the Japanese-Western-led side. At the bottom sit Onna in Okinawa (−61.4%), Komono in Mie (−58.7%), Hakone in Kanagawa (−33.9%) and Atami in Shizuoka (−33.8%). Bear in mind that the fewer properties a municipality contributes, the wider the swing in its gap.
Looking at the major onsen destinations individually, in Gero the median ADR of Japanese-Western-led properties runs above that of tatami-led ones. In Hakone, Atami and Kusatsu the reverse holds and tatami-led properties carry the higher ADR. Yufu, home to Yufuin, and Ito show only a small gap. Beppu and Nikko, home to Kinugawa, are onsen destinations characterised by the depth of their Japanese-Western-led stock.
| Onsen destination (municipality) | Town ryokan ADR | Japanese-Western-led | Tatami-led | Rate gap |
|---|---|---|---|---|
| Kusatsu, Gunma | ¥16,600 | 1 property, ¥18,300 | 5 properties, ¥32,000 | −42.7% |
| Hakone, Kanagawa | ¥25,500 | 3 properties, ¥19,800 | 15 properties, ¥30,000 | −33.9% |
| Atami, Shizuoka | ¥25,700 | 8 properties, ¥16,000 | 11 properties, ¥24,200 | −33.8% |
| Yufu, Oita | ¥23,700 | 3 properties, ¥23,500 | 3 properties, ¥25,200 | −6.8% |
| Ito, Shizuoka | ¥23,500 | 5 properties, ¥17,100 | 21 properties, ¥17,700 | −3.7% |
| Noboribetsu, Hokkaido | ¥18,700 | 2 properties, ¥18,400 | 8 properties, ¥21,500 | −14.3% |
| Gero, Gifu | ¥17,800 | 4 properties, ¥23,100 | 12 properties, ¥20,800 | +11.2% |
The segment holding its rate as pure tatami — in high-priced onsen towns the tatami room is the flagship product
A tatami room is not a room that ought to be converted. Across the municipalities in our comparison, a substantial share of tatami-led properties command an ADR at or above the median rate of the Japanese-Western-led properties in the same town. In onsen destinations at ¥25,000 and above in particular, tatami rooms combined with a view, a hiroen sitting alcove or a private open-air bath are what hold the rate up.
Guest reviews show the same picture. Hotel Kajikaso (ホテル河鹿荘) in Hakone draws comments such as “a spacious 12.5-mat tatami room with a hiroen alcove”, and Kusatsu Onsen Hotel Ichii (草津温泉 ホテル一井) in Kusatsu draws “very happy with a tatami room looking down on the Yubatake” (HotelBank Editorial Team research, trailing 24 months of guest reviews, 36 combined tatami mentions across the two properties). Our modelling assumes a 12.5-mat tatami room precisely because that size is the standard ryokan tatami room, and remains the flagship even at properties holding a high rate without converting.
98.3% of Japanese-Western mentions are in Japanese — inbound guests talk about “a tatami room with a bed”
Is converting to Japanese-Western rooms an investment aimed at inbound guests or at domestic ones? Taking the reviews that mention Japanese-Western rooms across the 245 ryokan and resorts (up to 20 per property per written language, 2,593 in total) and splitting them by the language they are written in: Japanese accounts for 98.3%, Chinese (traditional and simplified) and Korean together for 0.7%, and English did not appear at all (1.1% are mentions too short to identify a language, such as fragments containing no kana). Written language does not equal nationality, but the guests evaluating a room through the word “Japanese-Western room” are overwhelmingly domestic.
That does not mean inbound guests do not want a tatami room with a bed. Running the same extraction across seven ryokan in Hakone, a town with heavy inbound traffic, English-language reviews carried 53 mentions of “tatami room” and 56 of “bed”, while “Japanese-Western room” appeared zero times. English simply has no word for that room category, so guests describe it as a tatami room with a bed. Inbound demand here is best read through the combination of “tatami room” and “bed”.
On the domestic side, mentions of travelling with elderly family stand out. Of the reviews mentioning a Japanese-Western room, 42 (across 37 properties) also referred to elderly parents or grandparents, consideration for weak legs and backs, or wheelchairs. Gero Royal Hotel Miyabitei (下呂ロイヤルホテル雅亭) in Gero draws comments such as “we changed to a Japanese-Western room because we had an elderly guest with us” and “the Japanese-Western room was very spacious and open”. Guests who want to avoid laying out and putting away futons, or getting up off the floor, are choosing these rooms by name.
“Recently renovated” is mentioned slightly more at Japanese-Western-led properties, and more of it is recent
Next we look at how evaluations shift right after a renovation, by group. For each property we extracted up to 20 reviews each from the trailing 24 months mentioning “renovated” or “dated”, and averaged by group. In both groups more than 90% of properties carry both kinds of mention — room newness is an easy topic at ryokan generally. On top of that, Japanese-Western-led properties average 13.8 “renovated” mentions per property against 12.1 for tatami-led ones, and 52.4% of those were posted in the trailing 12 months (49.6% for tatami-led). Conversion to Japanese-Western rooms is often carried out at the same time as a full refresh of the room, so the effect of the renovation shows up readily in reviews.
| Group | Properties | Guest rooms | “Renovated” mentions (avg.) | Of which trailing 12 months | “Bed” mentions (avg.) |
|---|---|---|---|---|---|
| Japanese-Western-led | 187 | 17,290 | 13.8 | 52.4% | 12.6 |
| Tatami-led | 419 | 25,804 | 12.1 | 49.6% | 11.2 |
| Mixed | 99 | 9,354 | 16.8 | 50.5% | 14.8 |
As positive cases, Kutsurogi no Yado Shintaki (くつろぎ宿 新滝) in Aizuwakamatsu draws “the room renovated in 2024 is comfortable” and “the large Japanese-Western room is extremely comfortable”, while Gero Onsen Suimeikan (下呂温泉 水明館) in Gero draws “the renovated Japanese-Western room is beautiful” (HotelBank Editorial Team research, trailing 24 months of guest reviews, 76 combined Japanese-Western mentions across the two properties). Both are properties in towns where Japanese-Western-led rates run higher, and in both the renovation and the Japanese-Western room are praised as one and the same thing.
Modelling — a 30-room onsen ryokan converting 10 rooms to Japanese-Western
From here on this is modelling. Take a 30-room onsen ryokan converting ten 12.5-mat tatami rooms into Japanese-Western rooms. For construction cost we use an industry benchmark of “roughly ¥500,000 to ¥1,000,000 per tsubo when renovating guest rooms only” (Misawa Reform Kanto, March 2026) as the lower and upper bounds, with ¥750,000 per tsubo as the midpoint. Since one tsubo is roughly two tatami mats, 12.5 mats is about 6.25 tsubo, putting construction cost per room at ¥3.12M to ¥6.25M, or ¥4.69M at the midpoint.
Incremental revenue is set as “rate gap x occupancy x number of rooms”. For the rate gap we use the municipal medians by price band from the previous section: Case A is a town under ¥18,000 (tatami-led ADR ¥17,100, rate gap +10.8%), Case B a town between ¥18,000 and ¥25,000 (¥20,100, +4.7%). Room occupancy is the 38.2% national ryokan figure from the Japan Tourism Agency “Accommodation Travel Statistics Survey”, 2025 annual figures (final), and 70% of the incremental revenue is assumed to fall through to profit. Revenue lost while rooms are out of service is counted as “room-days x (ADR x room occupancy)” — the same method as our work on the real capex of a hotel renovation — and added back at a 70% contribution margin. The assumption is 45 days out of service per room across the 10 rooms (450 room-days).
| Modelling assumption | Case A (town ADR under ¥18,000) | Case B (¥18,000–¥25,000) |
|---|---|---|
| Pre-renovation ADR (median of tatami-led properties) | ¥17,100 | ¥20,100 |
| Rate gap (Japanese-Western-led, municipal median) | +10.8% | +4.7% |
| Room occupancy (ryokan, 2025 final) | 38.2% | 38.2% |
| Annual incremental revenue per room (profit basis) | ¥179,900 | ¥92,000 |
| Revenue lost during works (per room, 45 days, profit basis) | ¥205,300 | ¥241,400 |
| Payback period (¥500,000 per tsubo) | 18.5 years | 36.6 years |
| Payback period (¥750,000 per tsubo) | 27.2 years | 53.6 years |
| Payback period (¥1,000,000 per tsubo) | 35.9 years | 70.5 years |
Funding the payback from the rate gap alone gives a long horizon — 18.5 to 35.9 years even in Case A. Because ryokan room occupancy sits just under 40%, annual incremental revenue lands at ¥179,900 per room. Two variables move the investment case: the size of the rate gap, and the occupancy of the converted rooms.
The table below holds the Case A pre-renovation ADR (¥17,100) fixed and lays out payback across combinations of construction cost band and rate gap. In a town with a +20% gap, payback comes in at 10.0 years at ¥500,000 per tsubo; and a design that adds a view or an in-room open-air bath alongside the conversion to target +30% lands at 9.8 years even at ¥750,000 per tsubo.
| Construction cost \ rate gap | +4.7% | +10.8% | +20.0% | +30.0% |
|---|---|---|---|---|
| ¥500,000/tsubo (¥3.12M per room) | 42.5 yrs | 18.5 yrs | 10.0 yrs | 6.7 yrs |
| ¥750,000/tsubo (¥4.69M per room) | 62.5 yrs | 27.2 yrs | 14.7 yrs | 9.8 yrs |
| ¥1,000,000/tsubo (¥6.25M per room) | 82.5 yrs | 35.9 yrs | 19.4 yrs | 12.9 yrs |
The occupancy lift matters just as much. If capturing elderly family guests and three-generation trips who ask for a Japanese-Western room moves occupancy on the 10 converted rooms by +3pt, Case A payback at ¥750,000 per tsubo shortens from 27.2 years to 15.1; at +5pt it falls to 11.6. The decision to convert turns less on rate than on how many guests who specifically want that room type are already coming to the town.
All rooms or some — what changes with the size of the conversion
Varying the number of converted rooms across 5, 10, 20 and 30 barely changes payback on a per-room basis (27.2 years). Only the full 30-room conversion differs: because rooms are out of service for longer, we assume a full closure of 90 days, and payback comes to 28.3 years. Converting every room, however, removes the offer for guests who choose tatami — including the segment that holds a high rate on tatami alone. As the earlier section showed, in some price bands the tatami room is the flagship product, so the investment opportunity lies in a staged approach: test the rate and occupancy of Japanese-Western rooms on part of the stock first, and add conversions based on the result.
| Rooms converted | Tatami rooms remaining | Construction cost | Revenue lost during works | Annual incremental revenue (profit basis) | Payback period |
|---|---|---|---|---|---|
| 5 rooms | 25 | ¥23.44M | ¥1.03M | ¥0.90M | 27.2 years |
| 10 rooms | 20 | ¥46.88M | ¥2.05M | ¥1.80M | 27.2 years |
| 20 rooms | 10 | ¥93.75M | ¥4.11M | ¥3.60M | 27.2 years |
| 30 rooms | 0 | ¥140.62M | ¥12.32M | ¥5.40M | 28.3 years |
Combining with a subsidy — one half, limited to the barrier-free portion
Where the conversion is paired with removing floor-level changes, fitting handrails or making the bathroom and toilet barrier-free, it may be possible to draw on the Japan Tourism Agency’s “Universal Tourism Promotion Project in Tourist Destinations and the Tourism Industry”. Under the FY2025 supplementary-budget version of that programme, the subsidy rate for facility works and equipment at accommodation and similar businesses is one half, capped at ¥15M, with a raised cap for operators holding a disaster-response agreement with their local authority (Japan Tourism Agency, “Application Guidelines for Subsidy Administering Bodies”, 14 January 2026). The application window for accommodation operators ran from 31 March to 15 May 2026. Eligibility covers the works required for barrier-free access; it does not extend to the whole cost of converting to Japanese-Western rooms. For how step-free rooms come across in guest reviews, see our detailed analysis in Where Are the Step-Free Inns? 25 Properties Nationwide Where Barrier-Free Access Shows Up in Reviews.
If we assume 30% of the ¥46.88M cost for 10 rooms (¥14.06M) qualifies as barrier-free works, the subsidy comes to ¥7.03M and Case A payback at ¥750,000 per tsubo shortens from 27.2 years to 23.3 (modelled). The scope of eligible expenditure, and whether a further application round will open, must be confirmed against primary sources before applying.
| Item (10 rooms, ¥750,000/tsubo, Case A) | Without subsidy | With subsidy (modelled) |
|---|---|---|
| Construction cost | ¥46.88M | ¥46.88M |
| Subsidy (30% barrier-free works x one half rate, ¥15M cap) | — | ¥7.03M |
| Payback period | 27.2 years | 23.3 years |
In closing — the town’s price band splits the investment move
Converting tatami rooms to Japanese-Western rooms does not lift the rate the same way in every onsen destination. In municipalities where the town’s ryokan ADR is below ¥18,000, Japanese-Western-led properties run +10.8% higher and there is room to grow by converting part of the stock. In towns between ¥18,000 and ¥25,000 the rate gap is small, so the investment case has to rest on the occupancy lift from elderly family guests and three-generation trips. In onsen destinations at ¥25,000 and above, tatami-led properties are the ones holding the premium, and the potential lies in renovations that raise tatami quality.
For funds and corporates weighing an acquisition or a turnaround, which price band the target’s town sits in is the starting point for the renovation strategy. For regional banks lending against renovation capex, the things to confirm as payback assumptions are the occupancy outlook for the converted rooms and the revenue lost while they are out of service, alongside the rate gap. For an owner considering a renovation at an inherited property, testing rate and occupancy on a handful of rooms before adding more is the realistic option, rather than converting everything at once.
Notes on the modelling and aggregation: the figures in this article are modelled on public data available as of the research date (September 2026). The rate gap is a cross-sectional comparison within a single municipality and does not guarantee the rate lift any individual property would see from a renovation. The written language of a review does not equal the reviewer’s nationality. Construction costs are assumptions set within an industry benchmark range and vary widely with building structure and whether equipment is replaced. Subsidy rates, caps and application periods change from year to year, so confirm the Japan Tourism Agency’s primary sources before applying.
Related Articles
- Reverse-Engineering the Buyout Ceiling for Onsen Ryokan — Yugawara, Izunagaoka, Minakami and Kusatsu at a 12% Yield
- 64.5% of Japan’s Hotel Rooms Opened Before 2006 — Asbestos Pre-Surveys Add Up to 25.8% to Renovation Costs
- Where Are the Step-Free Inns? 25 Properties Nationwide Where Barrier-Free Access Shows Up in Reviews
- Ten Years After Opening — Timing the Renovation, Measured on the 2016 Cohort
References and Sources
■ Data sources
Estimated settled ADR (MetroEngines Research & Consulting, median of the 12 confirmed months September 2025 to August 2026; 705 ryokan and resorts across 136 municipalities, with the rate comparison run on the 68 municipalities holding both groups, 413 properties), semantic analysis of guest reviews (HotelBank Editorial Team research, trailing 24 months = September 2024 to August 2026), room occupancy from the Japan Tourism Agency “Accommodation Travel Statistics Survey”, 2025 annual figures (final), construction costs from published benchmarks of two renovation contractors, and subsidy terms from the Japan Tourism Agency application guidelines.
■ Modelling assumptions
A 30-room onsen ryokan converting 12.5-mat (about 6.25 tsubo) tatami rooms to Japanese-Western rooms. Construction cost at ¥500,000, ¥750,000 and ¥1,000,000 per tsubo (¥3.12M to ¥6.25M per room). Pre-renovation ADR is the median of tatami-led properties (Case A ¥17,100 / Case B ¥20,100), and the rate gap is the municipal median for the price band (+10.8% / +4.7%). Room occupancy 38.2% (full-year 2025, ryokan, national), with 70% of incremental revenue falling through to profit. Rooms are out of service for 45 days each during works (90-day full closure for the 30-room conversion), and the lost revenue is added into payback on a profit basis. The subsidy case assumes 30% of construction cost is barrier-free works at a one-half subsidy rate.
■ Limitations and caveats
The rate gap is a cross-sectional comparison within a single municipality, not a causal estimate of the rate lift from a renovation. Estimated settled ADR is an estimate on a tax-excluded equivalent basis and differs from any property’s actual transacted rates. The Japanese-Western-led / tatami-led classification rests on review mention counts, and written language does not equal nationality. Groups of one or two properties are swayed by individual properties. Payback is a simple payback period that ignores discount rates, tax, depreciation and financing costs, and excludes variation in construction cost from structure or equipment replacement.
■ Market data
- MetroEngines Research & Consulting — estimated settled ADR (September 2025 to August 2026, 705 ryokan and resorts across 136 municipalities)
- HotelBank Editorial Team research — NLP analysis of guest reviews (trailing 24 months, 3,045 Japanese-Western room mentions and others)
■ Government statistics and official data
- Japan Tourism Agency, “Accommodation Travel Statistics Survey”, 2025 annual figures (final)
- Japan Tourism Agency, “Application Guidelines for Subsidy Administering Bodies for the FY2025 Supplementary Budget ‘Universal Tourism Promotion Project in Tourist Destinations and the Tourism Industry'” (14 January 2026)
- Japan Tourism Agency, notice of the opening of operator applications for the FY2025 supplementary budget “Universal Tourism Promotion Project in Tourist Destinations and the Tourism Industry”
- Japan Tourism Agency, “FY2025 Japan Tourism Agency Supplementary Budget” (November 2025)
■ Construction cost benchmarks