

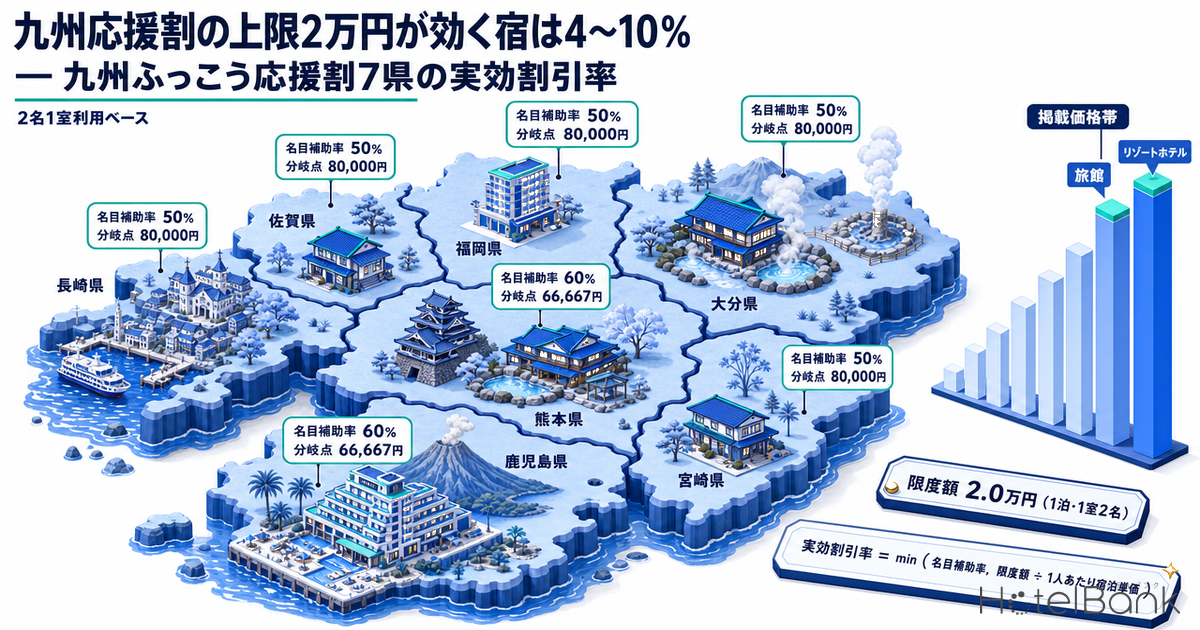
The policy parameters of the Kyushu Recovery Support Discount (九州ふっこう応援割, also called the Kyushu Support Discount) are now largely settled. The discount rate is 60% in Kumamoto and Kagoshima and 50% in the other five prefectures. The other parameter — the cap on the subsidy — has been announced at ¥20,000 for a lodging-only product or a one-night transport-inclusive travel product. With both figures in hand, there is one more thing a hotel can now calculate for itself: up to what price band does the nominal 60% or 50% apply in full, and from where does the effective discount rate start to fall below the nominal one?
This article uses the listed-price distribution of 4,165 properties across the seven Kyushu prefectures to identify that breakpoint, both as a formula and as a measurement. The conclusion up front: on a two-guests-per-room basis, the cap actually binds for 4.0-10.0% of properties — in practice, only the upper price band of ryokan and resort hotels. The purpose is to be ready to work out your own effective discount rate the moment each prefecture publishes its implementation rules.
Metric Definitions Used in This Article
- Listed price: the all-plan average of the rates each property publishes on booking sites (room-only through meals-included). Per-room rate for two guests per room, tax included. It differs from the price actually transacted. All price-band analysis in this article is on this listed-price basis.
- ADR (estimated settled ADR): an estimated transacted rate (tax-excluded equivalent) derived by applying a category-specific adjustment factor to the cheapest plan each property publishes. Cross-checked against property-level results disclosed by listed hotel REITs (91 properties, most recent three months), the median error is about 7%. It is an estimate and differs from each property’s actual transacted prices and accounting figures. Area-level ADR is the median of the properties covered (the level of a typical property in the area). In this article it is used only as a reference point for the prevailing market level.
- Effective discount rate: an original estimated metric of this article. It refers to the real discount rate, determined by whichever of the nominal subsidy rate or the cap binds first, and is calculated as min (nominal subsidy rate, cap ÷ per-person room rate).
- Per-person room rate: this article assumes two guests per room and uses the per-room listed price divided by two.
- Data sources: MetroEngines Research (prices), Japan Tourism Agency (policy)
- — The ¥20,000 cap starts to bind from the point where it is divided by the nominal rate. The breakpoint is ¥33,300 per person in Kumamoto and Kagoshima (nominal 60%) and ¥40,000 per person in the five prefectures at nominal 50%.
- — Of the 4,165 properties across the seven Kyushu prefectures, 290 properties, or 7.0% of the total, reach the cap on a two-guests-per-room basis. By prefecture the range runs from 4.0% in Miyazaki to 10.0% in Kumamoto.
- — By category, the share reaching the cap is 9.1-20.6% for ryokan and 7.1-30.8% for resort hotels, against 0.0-0.8% for business hotels. The cap acts only on the very top band in each prefecture.
- — The higher the subsidy rate, the lower the breakpoint. The 60% prefectures hit it at ¥66,700 per room, ¥13,300 earlier than the 50% prefectures, and above ¥80,000 per room the two effective rates converge.
- — Because the cap applies per person per night, four guests in one room keep the nominal rate up to ¥160,000 per room. That is why the cap barely comes into play in the vacation-rental and cottage band.
Two Things Are Now Fixed — a 50% Subsidy Rate (per night, per person) and a ¥20,000 Cap
On 28 August 2026, Land, Infrastructure, Transport and Tourism Minister Yasushi Kaneko announced at a press conference that the Kyushu Recovery Support Discount would start in October. The key point in the programme outline published by the Japan Tourism Agency is that the subsidy rate and the cap are set separately.
The subsidy rate is “50% of travel and lodging charges (per night, per person)”, rising to 60% in Kumamoto and Kagoshima, where cancellations have hit tourism hardest. On top of that, the cap is set in three tiers by product type.
| Product type | Cap | Relation to what the hotel sells itself |
|---|---|---|
| Lodging-only product / transport-inclusive travel product, one night | ¥20,000 | Applies to stays sold only through the hotel’s own direct bookings or online booking sites. Kumamoto’s implementation rules state “¥20,000 per night” explicitly |
| Transport-inclusive travel product (two nights or more) | ¥30,000 | The tier that applies when the hotel is bundled into a travel agency’s transport-inclusive package |
| Multi-destination travel product (stays in two or more prefectures) | ¥35,000 | Products spanning two or more prefectures. The tier for wide-area, cross-border traffic |
Source: compiled by the HotelBank Editorial Team from the Japan Tourism Agency “Kyushu Recovery Support Discount” programme outline and Kumamoto Prefecture’s implementation rules
The funding is ¥15.5bn from the MLIT contingency reserve. This is the tourism portion of the support package for the 2026 Kumamoto earthquake approved by the Cabinet on 28 August 2026 (¥147.8bn of contingency reserve in total). Under the scheme, the Japan Tourism Agency grants subsidies to each Kyushu prefecture, and each prefecture covers the gap to the discounted price through travel agents, lodging operators and booking sites. The eligible stay period begins with stays from Thursday 1 October 2026, with the start date and duration set by each prefecture.
The position of each prefecture as of 15 September is as follows. Kumamoto opened at 10:00 on 15 September and Nagasaki led on the same day via booking sites; Saga and Miyazaki are set for late September, Oita has signalled late September as well, and Fukuoka and Kagoshima have not announced. The spread in booking-opening dates matters because each prefecture’s opening date decides when its October inventory becomes eligible at all.
| Prefecture | Nominal subsidy rate | Booking opens | Eligible stay period | Breakpoint (2 guests/room) |
|---|---|---|---|---|
| Kumamoto | 60% | 9/15 (10:00) | 10/1-12/25 | ¥66,667 |
| Kagoshima | 60% | Not announced | Not announced | ¥66,667 |
| Fukuoka | 50% | Not announced | Not announced | ¥80,000 |
| Saga | 50% | Online 9/24, travel agents 10/2 | 10/1-12/25 | ¥80,000 |
| Nagasaki | 50% | Booking sites 9/15, direct bookings 9/28, other 9/30 | 10/1-12/25 (December sold at a later date) | ¥80,000 |
| Oita | 50% | Late September | 10/1-12/25 | ¥80,000 |
| Miyazaki | 50% | Online 9/25, direct bookings 9/28, travel agents 9/28 | 10/1-12/25 | ¥80,000 |
Source: compiled by the HotelBank Editorial Team from the Japan Tourism Agency “Kyushu Recovery Support Discount” prefecture-by-prefecture information (as of 15 September 2026). The breakpoint is a HotelBank estimate assuming the ¥20,000 cap and two guests per room
The Effective Discount Rate Formula — the Breakpoint Is Uniquely Set by “Cap ÷ Nominal Rate”
Where a subsidy rate and a cap coexist, the discount rate actually applied is determined by the following formula.
Effective discount rate = min (nominal subsidy rate, cap ÷ per-person room rate)
Per-person rate at which nominal and effective start to diverge = cap ÷ nominal subsidy rate
Applying the ¥20,000 cap, the breakpoint is ¥33,300 per person in Kumamoto and Kagoshima at a nominal 60%, and ¥40,000 per person in the other five prefectures at a nominal 50%. Converted to two guests per room, that is about ¥66,700 per room (60% prefectures) and ¥80,000 (50% prefectures).
One counter-intuitive relationship emerges here. The breakpoint is lower in prefectures with the higher subsidy rate. The 60% prefectures reach it ¥13,300 per room earlier than the 50% prefectures. The ceiling is shared, and the speed of reaching it is proportional to the subsidy rate. The extra 10 points applies in full only up to a price band of ¥66,700 per room. How a 10-point difference in the nominal rate shows up in net rates across a prefectural border is measured in The Net-Rate Gap Between Kurokawa Onsen and Yufuin Narrows to ¥665 — a 10pt Policy Gap Across 31km of Prefectural Border.
Furthermore, above ¥40,000 per person (¥80,000 for two guests in a room), the effective discount rates in the 60% and 50% prefectures coincide exactly. Both converge on “¥20,000 ÷ per-person rate”, and the difference in nominal rates disappears. At ¥120,000 per room both come to an effective 33.3%; at ¥200,000 per room both come to an effective 20.0%.
Source: compiled by MetroEngines Research and the HotelBank Editorial Team. Note: the discount rates and caps are based on Japan Tourism Agency material published on 28 August 2026. The effective discount rate is a HotelBank estimate using listed prices compiled in-house and does not represent the subsidy amount actually granted under the programme. Actual application depends on each prefecture’s implementation rules and the terms of each product.
| Listed room rate (2 guests) | Per-person rate | Effective rate (60% pref.) | Effective rate (50% pref.) | Subsidy per room |
|---|---|---|---|---|
| ¥30,000 | ¥15,000 | 60.0% | 50.0% | ¥18,000 |
| ¥40,000 | ¥20,000 | 60.0% | 50.0% | ¥24,000 |
| ¥50,000 | ¥25,000 | 60.0% | 50.0% | ¥30,000 |
| ¥60,000 | ¥30,000 | 60.0% | 50.0% | ¥36,000 |
| ¥66,667 (breakpoint, 60% pref.) | ¥33,334 | 60.0% | 50.0% | ¥40,000 |
| ¥80,000 (breakpoint, 50% pref.; equal beyond) | ¥40,000 | 50.0% | 50.0% | ¥40,000 |
| ¥100,000 | ¥50,000 | 40.0% | 40.0% | ¥40,000 |
| ¥120,000 | ¥60,000 | 33.3% | 33.3% | ¥40,000 |
| ¥150,000 | ¥75,000 | 26.7% | 26.7% | ¥40,000 |
| ¥200,000 | ¥100,000 | 20.0% | 20.0% | ¥40,000 |
Source: compiled by MetroEngines Research and the HotelBank Editorial Team. Note: the discount rates and caps are based on Japan Tourism Agency material published on 28 August 2026. The effective discount rate is a HotelBank estimate using listed prices compiled in-house and does not represent the subsidy amount actually granted under the programme. Actual application depends on each prefecture’s implementation rules and the terms of each product.
The subsidy per room is itself capped. Because the cap works per person, two guests in one room means at most ¥40,000 per room per night. Whatever part of a room’s listed price sits above ¥66,700 (60% prefectures) accumulates outside the subsidy, however high the nominal rate.
The Breakpoint Moves With Guests Per Room — Four Guests Keep the Nominal Rate Up to ¥160,000
Because the cap is per person, the breakpoint shifts with the number of guests even at the same room price. Seen per room, the breakpoint is directly proportional to the number of guests.
| Guests per room | Breakpoint room rate (60% pref.) | Breakpoint room rate (50% pref.) | Maximum subsidy per room |
|---|---|---|---|
| 1 | ¥33,333 | ¥40,000 | ¥20,000 |
| 2 | ¥66,667 | ¥80,000 | ¥40,000 |
| 3 | ¥100,000 | ¥120,000 | ¥60,000 |
| 4 | ¥133,333 | ¥160,000 | ¥80,000 |
| 5 | ¥166,667 | ¥200,000 | ¥100,000 |
Source: compiled by MetroEngines Research and the HotelBank Editorial Team. Note: the discount rates and caps are based on Japan Tourism Agency material published on 28 August 2026. The effective discount rate is a HotelBank estimate using listed prices compiled in-house and does not represent the subsidy amount actually granted under the programme. Actual application depends on each prefecture’s implementation rules and the terms of each product.
Price and party size bind at the same time, so crossing the two puts the region where the cap acts on a single sheet. The table below takes the listed room rate vertically and guests per room horizontally, with the effective discount rate in each cell. The shaded cells are the region where the discount rate is set by the cap rather than by the nominal rate.
| Listed room rate | 1 guest | 2 guests | 3 guests | 4 guests |
|---|---|---|---|---|
| ¥30,000 | 60.0% / 50.0% | 60.0% / 50.0% | 60.0% / 50.0% | 60.0% / 50.0% |
| ¥50,000 | 40.0% / 40.0% | 60.0% / 50.0% | 60.0% / 50.0% | 60.0% / 50.0% |
| ¥66,667 (breakpoint, 60% pref., 2 guests) | 30.0% / 30.0% | 60.0% / 50.0% | 60.0% / 50.0% | 60.0% / 50.0% |
| ¥80,000 (breakpoint, 50% pref., 2 guests) | 25.0% / 25.0% | 50.0% / 50.0% | 60.0% / 50.0% | 60.0% / 50.0% |
| ¥100,000 | 20.0% / 20.0% | 40.0% / 40.0% | 60.0% / 50.0% | 60.0% / 50.0% |
| ¥133,333 | 15.0% / 15.0% | 30.0% / 30.0% | 45.0% / 45.0% | 60.0% / 50.0% |
| ¥160,000 (breakpoint, 50% pref., 4 guests) | 12.5% / 12.5% | 25.0% / 25.0% | 37.5% / 37.5% | 50.0% / 50.0% |
| ¥200,000 | 10.0% / 10.0% | 20.0% / 20.0% | 30.0% / 30.0% | 40.0% / 40.0% |
Each cell reads “effective discount rate in the 60% prefectures / in the 50% prefectures”. Shading marks cells where the effective rate falls below the nominal rate in at least one of the two groups — that is, the region where the cap binds first. Source: compiled by MetroEngines Research and the HotelBank Editorial Team. Note: the discount rates and caps are based on Japan Tourism Agency material published on 28 August 2026. The effective discount rate is a HotelBank estimate using min (nominal subsidy rate, ¥20,000 cap ÷ per-person room rate) and does not represent the subsidy amount actually granted under the programme. Actual application depends on each prefecture’s implementation rules and the terms of each product.
The reading is straightforward: the shading retreats towards the bottom right. At the same ¥100,000 per room, two guests drop to an effective 40.0%, while four guests keep the nominal 60% or 50% in full. Conversely, a single guest already has the cap binding at ¥50,000 per room. What decides whether you are inside or outside the cap is not the room price itself but the room price divided by the number of guests.
This structure works differently by category. The categories with the highest per-room listed prices across the seven Kyushu prefectures are vacation rentals, cottages and glamping, but these assume parties of four to six. Oita’s vacation rentals list at ¥39,900 per room (n=162), but at four guests that is ¥10,000 per person and the nominal 50% applies in full. The upper band of ryokan and resort hotels, where two guests per room is standard, has its room price judged as two people’s worth, so it reaches the breakpoint sooner at the same room-rate level.
Listed Prices by Category — the Effective Rate Equals the Nominal Rate in All 26 Cells Across 7 Prefectures
So where do the category averages of the seven Kyushu prefectures sit relative to this breakpoint? Listed prices as of August 2026 (per room, two guests, tax included) are set out below, limited to cells with at least 10 listed properties.
| Prefecture | Category | Properties | Listed room rate | Per person | Nominal subsidy/person | Effective discount rate | Headroom to breakpoint |
|---|---|---|---|---|---|---|---|
| Kumamoto Nominal 60% | Ryokan | 225 | ¥41,027 | ¥20,514 | ¥12,308 | 60% | ¥25,640 |
| Resort hotel | 23 | ¥42,791 | ¥21,396 | ¥12,837 | 60% | ¥23,876 | |
| City hotel | 19 | ¥26,464 | ¥13,232 | ¥7,939 | 60% | ¥40,203 | |
| Business hotel | 116 | ¥13,627 | ¥6,814 | ¥4,088 | 60% | ¥53,040 | |
| Kagoshima Nominal 60% | Resort hotel | 50 | ¥43,131 | ¥21,566 | ¥12,939 | 60% | ¥23,536 |
| Ryokan | 80 | ¥27,002 | ¥13,501 | ¥8,101 | 60% | ¥39,665 | |
| City hotel | 25 | ¥24,020 | ¥12,010 | ¥7,206 | 60% | ¥42,647 | |
| Business hotel | 151 | ¥12,653 | ¥6,326 | ¥3,796 | 60% | ¥54,014 | |
| Oita Nominal 50% | Resort hotel | 42 | ¥53,209 | ¥26,604 | ¥13,302 | 50% | ¥26,791 |
| Ryokan | 303 | ¥32,178 | ¥16,089 | ¥8,044 | 50% | ¥47,822 | |
| City hotel | 15 | ¥22,518 | ¥11,259 | ¥5,630 | 50% | ¥57,482 | |
| Business hotel | 86 | ¥14,795 | ¥7,398 | ¥3,699 | 50% | ¥65,205 | |
| Nagasaki Nominal 50% | Resort hotel | 37 | ¥61,700 | ¥30,850 | ¥15,425 | 50% | ¥18,300 |
| Ryokan | 70 | ¥39,526 | ¥19,763 | ¥9,882 | 50% | ¥40,474 | |
| City hotel | 24 | ¥27,172 | ¥13,586 | ¥6,793 | 50% | ¥52,828 | |
| Business hotel | 127 | ¥13,416 | ¥6,708 | ¥3,354 | 50% | ¥66,584 | |
| Fukuoka Nominal 50% | Resort hotel | 16 | ¥56,834 | ¥28,417 | ¥14,208 | 50% | ¥23,166 |
| Ryokan | 74 | ¥35,398 | ¥17,699 | ¥8,850 | 50% | ¥44,602 | |
| City hotel | 41 | ¥31,362 | ¥15,681 | ¥7,840 | 50% | ¥48,638 | |
| Business hotel | 347 | ¥14,103 | ¥7,052 | ¥3,526 | 50% | ¥65,897 | |
| Saga Nominal 50% | Ryokan | 91 | ¥41,729 | ¥20,864 | ¥10,432 | 50% | ¥38,271 |
| Business hotel | 48 | ¥13,804 | ¥6,902 | ¥3,451 | 50% | ¥66,196 | |
| Miyazaki Nominal 50% | Resort hotel | 14 | ¥38,291 | ¥19,146 | ¥9,573 | 50% | ¥41,709 |
| Ryokan | 44 | ¥23,575 | ¥11,788 | ¥5,894 | 50% | ¥56,425 | |
| City hotel | 19 | ¥19,064 | ¥9,532 | ¥4,766 | 50% | ¥60,936 | |
| Business hotel | 82 | ¥12,101 | ¥6,050 | ¥3,025 | 50% | ¥67,899 |
Source: MetroEngines Research (August 2026; listed price = per-room rate for two guests per room, tax included; cells with 10 or more listed properties only), compiled by the HotelBank Editorial Team. Note: the discount rates and caps are based on Japan Tourism Agency material published on 28 August 2026. The effective discount rate is a HotelBank estimate using listed prices compiled in-house and does not represent the subsidy amount actually granted under the programme. Actual application depends on each prefecture’s implementation rules and the terms of each product.
In all 26 cells the effective discount rate equals the nominal rate. The closest to the breakpoint is Nagasaki’s resort hotels at ¥61,700 per room (n=37), or ¥30,900 per person. The subsidy at 50% comes to ¥15,400, leaving ¥4,600 of headroom before the ¥20,000 cap. Progress towards the breakpoint was 77.1%.
In Kumamoto, at a nominal 60%, ryokan list at ¥41,000 per room (n=225), or ¥20,500 per person. The subsidy at 60% is ¥12,300, still ¥7,700 short of the cap, for 61.5% of the way. Even allowing for the earlier point that “the 60% prefectures have the lower breakpoint”, category averages do not reach the cap.
Business hotels fall within a band of ¥12,100-14,800 per room across all seven prefectures. At ¥6,100-7,400 per person, the nominal 60% and 50% apply in full. Progress towards the breakpoint reaches only 18.5% even in Oita, the highest — the cap is effectively irrelevant to this band.
Source: MetroEngines Research (check-in 1-7 October 2026, listed prices for two guests per room, N=4,165 properties), compiled by the HotelBank Editorial Team. Note: the discount rates and caps are based on Japan Tourism Agency material published on 28 August 2026. The effective discount rate is a HotelBank estimate using listed prices compiled in-house and does not represent the subsidy amount actually granted under the programme. Actual application depends on each prefecture’s implementation rules and the terms of each product.
Seen as a Distribution, 4.0-10.0% — the Cap Binds Only the Upper Band of Ryokan and Resorts
Category averages do not reach the cap, but there is naturally dispersion inside an average. Listed prices for check-in on 1-7 October 2026 were therefore aggregated at property level to find the share of properties above each prefecture’s breakpoint. The scope is 4,165 properties across the seven Kyushu prefectures.
| Prefecture | Properties | Breakpoint | Median | Top 25% | Top 10% | Top 5% | Reaching cap | Share reaching cap |
|---|---|---|---|---|---|---|---|---|
| Kumamoto (nominal 60%) | 683 | ¥66,667 | ¥26,483 | ¥45,080 | ¥66,450 | ¥79,186 | 68 | 10.0% |
| Kagoshima (nominal 60%) | 733 | ¥66,667 | ¥17,849 | ¥34,800 | ¥60,004 | ¥87,021 | 55 | 7.5% |
| Oita (nominal 50%) | 809 | ¥80,000 | ¥35,901 | ¥54,844 | ¥77,229 | ¥99,504 | 69 | 8.5% |
| Nagasaki (nominal 50%) | 523 | ¥80,000 | ¥20,629 | ¥36,218 | ¥56,195 | ¥74,201 | 24 | 4.6% |
| Fukuoka (nominal 50%) | 893 | ¥80,000 | ¥26,591 | ¥41,829 | ¥58,773 | ¥79,902 | 44 | 4.9% |
| Saga (nominal 50%) | 221 | ¥80,000 | ¥30,937 | ¥53,136 | ¥71,587 | ¥96,643 | 18 | 8.1% |
| Miyazaki (nominal 50%) | 303 | ¥80,000 | ¥16,935 | ¥27,300 | ¥49,344 | ¥70,168 | 12 | 4.0% |
Source: MetroEngines Research (check-in 1-7 October 2026, average listed price for two guests per room, properties with three or more observation days, N=4,165), compiled by the HotelBank Editorial Team. Note: the discount rates and caps are based on Japan Tourism Agency material published on 28 August 2026. The effective discount rate is a HotelBank estimate using listed prices compiled in-house and does not represent the subsidy amount actually granted under the programme. Actual application depends on each prefecture’s implementation rules and the terms of each product.
Across the seven prefectures, 290 properties — 7.0% of the total — have the cap binding. By prefecture the range runs from 4.0% in Miyazaki to 10.0% in Kumamoto. Kumamoto is highest not only because of its price level: its breakpoint of ¥66,700 sits ¥13,300 below that of the 50% prefectures, which pushes the share up. Its top-10% level (¥66,450) lands almost exactly on the breakpoint.
Normalising each prefecture’s price distribution by its breakpoint makes the picture clear. The median sits at just 21-45% of the breakpoint in all seven prefectures, and even the top 25% reaches only 34-69%. The cap is touched somewhere between the top 10% and the top 5% — that is, only once you are in each prefecture’s very highest band.
Source: MetroEngines Research (check-in 1-7 October 2026, listed prices for two guests per room, N=4,165 properties), compiled by the HotelBank Editorial Team. Note: the discount rates and caps are based on Japan Tourism Agency material published on 28 August 2026. The effective discount rate is a HotelBank estimate using listed prices compiled in-house and does not represent the subsidy amount actually granted under the programme. Actual application depends on each prefecture’s implementation rules and the terms of each product.
By category the gap in the share reaching the cap is sharper still. Ryokan run 9.1-20.6% and resort hotels 7.1-30.8%, against 0.0-0.8% for business hotels. The highest is Kagoshima’s resort hotels, where 16 of 52 properties (30.8%) were above the breakpoint.
| Prefecture | Category | Properties | Median room rate | Reaching cap | Share reaching cap |
|---|---|---|---|---|---|
| Kumamoto | Ryokan | 238 | ¥44,962 | 49 | 20.6% |
| Resort hotel | 25 | ¥49,450 | 4 | 16.0% | |
| City hotel | 18 | ¥24,920 | 0 | 0.0% | |
| Business hotel | 119 | ¥15,500 | 1 | 0.8% | |
| Kagoshima | Resort hotel | 52 | ¥49,071 | 16 | 30.8% |
| Ryokan | 81 | ¥35,646 | 15 | 18.5% | |
| City hotel | 25 | ¥19,288 | 1 | 4.0% | |
| Business hotel | 150 | ¥13,320 | 0 | 0.0% | |
| Oita | Resort hotel | 45 | ¥43,520 | 9 | 20.0% |
| Ryokan | 321 | ¥42,877 | 43 | 13.4% | |
| City hotel | 15 | ¥21,715 | 0 | 0.0% | |
| Business hotel | 85 | ¥13,571 | 0 | 0.0% | |
| Nagasaki | Resort hotel | 37 | ¥44,760 | 9 | 24.3% |
| Ryokan | 70 | ¥33,764 | 7 | 10.0% | |
| City hotel | 25 | ¥30,843 | 0 | 0.0% | |
| Business hotel | 123 | ¥14,487 | 0 | 0.0% | |
| Fukuoka | Resort hotel | 15 | ¥46,754 | 4 | 26.7% |
| City hotel | 42 | ¥37,896 | 6 | 14.3% | |
| Ryokan | 74 | ¥36,016 | 9 | 12.2% | |
| Business hotel | 346 | ¥19,972 | 1 | 0.3% | |
| Saga | Ryokan | 92 | ¥52,596 | 11 | 12.0% |
| Business hotel | 48 | ¥13,988 | 0 | 0.0% | |
| Miyazaki | Ryokan | 44 | ¥26,240 | 4 | 9.1% |
| Resort hotel | 14 | ¥32,128 | 1 | 7.1% | |
| City hotel | 18 | ¥16,756 | 0 | 0.0% | |
| Business hotel | 85 | ¥12,631 | 0 | 0.0% |
Source: MetroEngines Research (check-in 1-7 October 2026, average listed price for two guests per room, categories with 10 or more listed properties only), compiled by the HotelBank Editorial Team. Note: the discount rates and caps are based on Japan Tourism Agency material published on 28 August 2026. The effective discount rate is a HotelBank estimate using listed prices compiled in-house and does not represent the subsidy amount actually granted under the programme. Actual application depends on each prefecture’s implementation rules and the terms of each product.
Measured Against Prevailing Transacted Levels, the Cap Is Further Still
The discussion so far has been on a listed-price basis. Listed prices are an all-plan average, and because higher-priced plans tend to remain unsold they run above the level actually transacted. Setting the estimated settled ADR alongside as a reference point, the October levels are as follows.
| Prefecture | Estimated settled ADR (Oct 2026) | Properties covered | Per-person equivalent | Nominal subsidy/person | Headroom to cap |
|---|---|---|---|---|---|
| Kumamoto | ¥14,004 | 391 | ¥7,002 | ¥4,201 | ¥15,799 |
| Kagoshima | ¥10,043 | 307 | ¥5,022 | ¥3,013 | ¥16,987 |
| Oita | ¥15,690 | 453 | ¥7,845 | ¥3,922 | ¥16,078 |
| Nagasaki | ¥11,697 | 249 | ¥5,848 | ¥2,924 | ¥17,076 |
| Fukuoka | ¥14,302 | 466 | ¥7,151 | ¥3,576 | ¥16,424 |
| Saga | ¥14,941 | 151 | ¥7,470 | ¥3,735 | ¥16,265 |
| Miyazaki | ¥9,791 | 160 | ¥4,896 | ¥2,448 | ¥17,552 |
Source: MetroEngines Research (October 2026; estimated settled ADR = per room, tax-excluded equivalent, estimated from listed levels at the time of the survey), compiled by the HotelBank Editorial Team
Estimated settled ADR sits in a band of ¥9,800-15,700, and divided by two guests per room the per-person figure is ¥4,900-7,800. Applying the nominal rate gives a subsidy of ¥2,400-4,200 per person, leaving more than ¥15,000 of headroom before the ¥20,000 cap. For a typical property in these areas, the cap is a parameter that never comes into view.
Put differently, the ¥20,000 cap is designed to act only on the very top price band in each prefecture. In practical terms, a hotel should first judge whether it is inside or outside the cap; if inside, it can build its sales plan on the nominal rate as it stands. The test takes one line: does listed price per room ÷ assumed guests per room x nominal rate exceed ¥20,000?
Outside the Cap, There Are Tiers Beyond the Lodging Subsidy to Use
Above the breakpoint — the top 5-10% in each prefecture — the incremental room rate carries no subsidy. This is where the design space opens up for what to sell outside the programme. Indeed, the fact that the cap itself comes in three tiers points to where that space lies.
First, the cap for a transport-inclusive travel product of two nights or more is ¥30,000, and for a multi-destination product covering stays in two or more prefectures it is ¥35,000 — both above the ¥20,000 for lodging alone. Properties in the price band that touches the cap on standalone sales have room to use a higher tier by being bundled into a travel agency’s transport-inclusive product or a cross-border multi-destination product. Travel distances between neighbouring prefectures in Kyushu are short, which suits two-prefecture itineraries.
Second, outside the cap is a band where the contest is on added value rather than price elasticity. Once the subsidy is pinned at a flat amount, raising the room rate leaves the subsidy unchanged and only increases the guest’s net outlay. Conversely, elements other than the room rate — meal grade, experiences, length of stay — never enter the subsidy formula in the first place, so revenue per guest can be built on them without the cap biting. The higher the band, the larger this upside.
Third, consecutive nights. The cap is assessed per night (for lodging-only products). If ¥20,000 is the limit for one night, two nights carry support of up to ¥40,000 per person. For a property in the upper band, pushing towards longer stays uses up more of the programme’s tier than raising the nightly room rate does. Note, however, that the eligible stay period is cut off at 25 December for the time being, so a multi-night design has to fit inside that window.
Aggregating the plan names Kumamoto properties publish, only 13% (N=278) promote a consecutive-night discount. For properties in the price band where the cap binds, that suggests design room for longer stays remains.
For hotels: plan-name cues that work on this theme
Frequent appeal elements in published plan names for Kumamoto x the support discount (N=278) —
Discount 81%Early-bird 54%Breakfast included 41%Room only 29%Two meals included 16%Consecutive-night discount 13%
Examples of actual names (anonymised):
- [30-day advance discount] Better value on 2 or more consecutive nights – Eco Stay – Free breakfast buffet – Children up to elementary school age sleep free with parents
- [21-day advance discount] Better value on 2 or more consecutive nights – Earth-friendly Eco Stay – Free breakfast buffet
- [21-day advance discount] Better value on 4 or more consecutive nights – Earth-friendly Eco Stay – Free breakfast buffet
Note: this is a tendency based on an aggregation of published plan names and does not demonstrate that naming causes sales. For a deeper look at market x naming, see our naming benchmark and event articles.
Summary — Your Own Effective Discount Rate Comes Out in One Line
With both parameters of the Kyushu Recovery Support Discount now set, what a hotel needs to check can be organised into the following five points.
| Checkpoint | Calculation and test |
|---|---|
| 1. Your own breakpoint | ¥20,000 cap ÷ nominal rate x assumed guests per room. ¥33,300 per person in the 60% prefectures, ¥40,000 per person in the 50% prefectures |
| 2. Inside or outside the cap | Whether room price of the main plans ÷ assumed guests per room x nominal rate exceeds ¥20,000 |
| 3. If inside | The nominal 60% or 50% is the effective rate as it stands. The sales plan can be built on the nominal rate |
| 4. If outside | The effective rate is “¥20,000 ÷ per-person rate”. The gap between the 60% and 50% prefectures disappears above ¥40,000 per person |
| 5. Using up the tier | Stack the per-night tier through consecutive nights; use the product tiers for transport-inclusive two nights or more (¥30,000) and two-prefecture itineraries (¥35,000) |
Source: compiled by the HotelBank Editorial Team from Japan Tourism Agency published material and MetroEngines Research
On the measured data for the seven Kyushu prefectures, the cap actually binds for 7.0% of properties overall, and 4.0-10.0% by prefecture. It is confined to the upper band of ryokan and resort hotels and barely touches the business-hotel band. For the great majority of properties in Kyushu, the headline 60% and 50% are the effective rate as they stand.
At the same time, the breakpoint sits lower in prefectures with the higher nominal rate. In the upper band in Kumamoto and Kagoshima, nominal and effective begin to diverge above ¥66,700 per room, and above ¥80,000 per room the gap against the 50% prefectures disappears. As each prefecture’s implementation rules come out in turn, reading not just the discount rate but this breakpoint against your own price band will sharpen the accuracy of sales planning from October onwards.
⚠ Note on prices for future dates: the listed prices and estimated settled ADR for October 2026 in this article are estimates based on the rates published on booking sites at the time of the survey, and they shift as the check-in date approaches. Listed prices themselves may also be changed once the support discount takes effect. The programme’s discount rates, caps and eligible periods are based on material published by the Japan Tourism Agency and the individual prefectures; actual eligibility depends on each prefecture’s implementation rules and the terms of each sales channel. The effective discount rate in this article is a HotelBank estimate and does not represent the subsidy amount granted under the programme.
Related reading
- Kyushu Recovery Support Discount Confirmed — 60% in Kumamoto and Kagoshima, 50% in Five Prefectures, and the Price Band the ¥20,000 Cap Binds
- Kyushu Support Discount: the Net-Rate Gap Between Kurokawa Onsen and Yufuin Narrows to ¥665 — a 10pt Policy Gap Across 31km of Prefectural Border
References and Sources
■ Data sources
Listed prices are the rates published on booking sites, collected daily and averaged per property: the category averages are as of August 2026, and the property-level distribution covers check-in on 1-7 October 2026 (three or more observation days, N=4,165 properties). Both are per-room rates for two guests per room (tax included, all-plan average). Estimated settled ADR is an estimate as of October 2026 (per room, tax-excluded equivalent). The programme parameters (subsidy rate, cap, eligible stay period, booking start date) come from material published by the Japan Tourism Agency and the individual prefectures.
■ Estimation assumptions
The effective discount rate is calculated as min (nominal subsidy rate, cap ÷ per-person room rate). Unless otherwise noted, the per-person room rate assumes two guests per room and is the per-room listed price divided by two. The nominal subsidy rate is 60% in Kumamoto and Kagoshima and 50% in the other five prefectures. The cap is taken as ¥20,000 for a lodging-only product or a one-night transport-inclusive travel product; transport-inclusive stays of two nights or more (¥30,000) and multi-destination products (¥35,000) are handled separately in the text. Breakpoint = cap ÷ nominal subsidy rate x assumed guests per room. Properties reaching the cap are defined as those whose average listed price over the period exceeds their prefecture’s breakpoint.
■ Limitations and caveats
(1) Listed prices are an all-plan average and differ from prices actually transacted. Because higher-priced plans tend to remain unsold, they run above prevailing levels, so the shares reaching the cap in this article are an upper-leaning estimate. (2) October 2026 is a future period, and listed prices shift as the check-in date approaches; listed prices themselves may also change once the support discount takes effect. (3) The effective discount rate is a HotelBank estimate and does not represent the subsidy amount granted under the programme; eligibility and amounts depend on each prefecture’s implementation rules and the terms of each sales channel. (4) Cells with fewer than 10 listed properties are excluded from the category-level aggregation. (5) Estimated settled ADR is an estimate and differs from each property’s accounting figures.
- Japan Tourism Agency, “Kyushu Recovery Support Discount” disaster-related information (booking start dates and eligible stay periods by prefecture)
- Japan Tourism Agency, “Kyushu Recovery Support Discount” programme outline (subsidy rate, cap and scheme, PDF)
- Kumamoto Prefecture, “Kumamoto Recovery Support Discount” (60% discount rate, ¥20,000 cap per night, eligible period, booking start date)
- Travel Voice, “Japan Tourism Agency to launch the Kyushu Recovery Support Discount in October, 50% off travel and lodging charges, 60% in Kumamoto and Kagoshima” (28 August 2026, in Japanese)
- Travel Watch, “Travel support scheme Kyushu Recovery Support Discount confirmed from October. ¥20,000 off per night, up to ¥35,000 for tours” (28 August 2026, in Japanese)
- Travel Watch, “Kumamoto Prefecture opens bookings for the Kyushu Recovery Support Discount at 10:00 on 15 September” (September 2026, in Japanese)
- Nikkei, “Government approves ¥147.8bn of contingency-reserve spending for Kumamoto earthquake support” (28 August 2026, in Japanese)
- Nikkei, “Recovery-support Kyushu travel discount to start in October, 60% off in Kumamoto and Kagoshima” (28 August 2026, in Japanese)
- Nishinippon Shimbun, “Kyushu Recovery Support Discount: 60% off in Kumamoto and Kagoshima, 50% off in Fukuoka and four other prefectures, from October” (28 August 2026, in Japanese)
- MetroEngines Research — listed prices for the seven Kyushu prefectures (August 2026, by category; per-room rate for two guests per room, tax included), property-level listed prices for check-in on 1-7 October 2026 (N=4,165 properties), estimated settled ADR (October 2026), and an aggregation of published plan names (Kumamoto, N=278)