

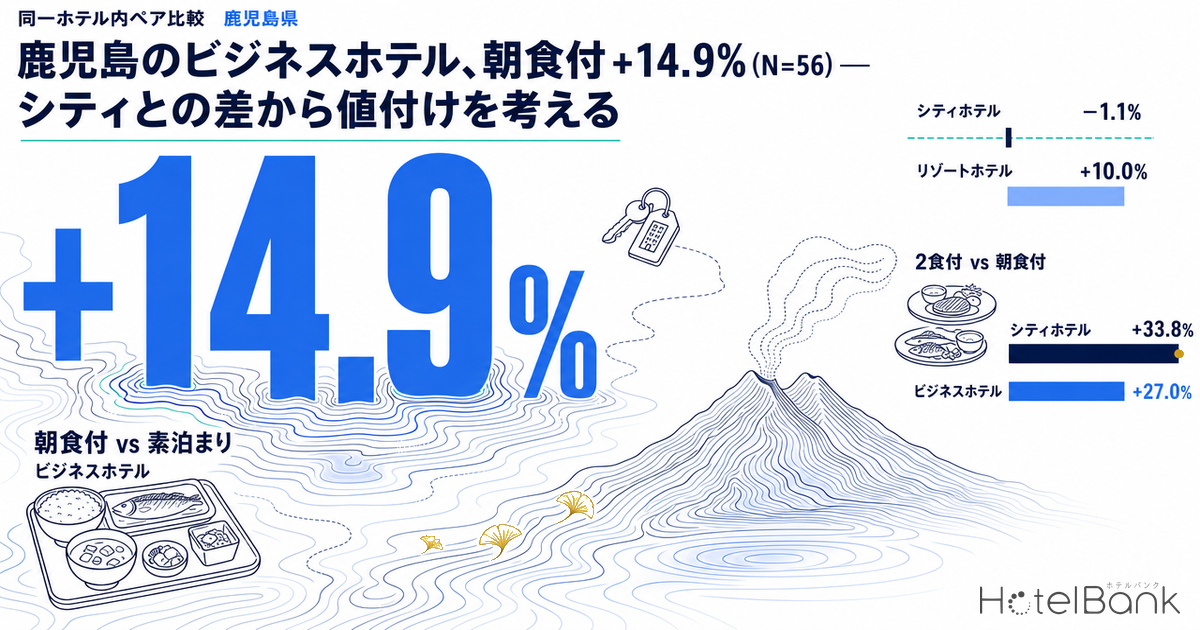
Compare the room-only plan and the breakfast-included plan sold by the same property at hotels in Kagoshima Prefecture, and the gap as of September 2026 is +14.9% for business hotels (56 paired properties), −1.1% for city hotels (12 properties) and +10.0% for resort hotels (21 properties). Same prefecture, same month — yet the way hotels price that single step of breakfast differs completely by hotel type. The step from breakfast-included to half-board (breakfast plus dinner) is larger still: business +27.0% (23 properties), city +33.8% (11 properties) and resort +22.7% (17 properties), well above the breakfast step in every case (about 2.7 times as large for the prefecture as a whole). This article restricts itself to same-property paired comparisons to break down the structure of these steps, and turns the question of “where to place the breakfast and dinner steps” into a practical framework for those selling rooms in Kagoshima.
Scope: business, city and resort hotels in Kagoshima Prefecture. Meal premiums are same-property paired comparisons, N=11–93 properties (varies by segment and pair; ryokan excluded). Estimated settled ADR covers N=153–161 business hotels and N=21–26 city hotels. The price metric in this article is estimated settled ADR (the transaction price level estimated from OTA and other sales data, tax-excluded equivalent); meal premiums are expressed only as rates (%), not yen amounts. Definitions appear at the end of the article. Data as of September 16, 2026.
- — +14.9% — The step from room-only to breakfast-included at Kagoshima business hotels (September 2026, same-property paired comparison, N=56). It held steady in a +13.2% to +14.9% band from May to September — the thickest level in Kyushu.
- — −1.1% — The breakfast step at city hotels (N=12). It stayed near zero (−2.9% to +1.1%) from May to September; whether breakfast is included does not show up as a difference in room rates.
- — +33.8% — The step from breakfast-included to half-board at city hotels (N=11), the largest of the three types. City hotels concentrate their step in the single dinner tier, while business hotels use a two-tier structure of breakfast +14.9% and dinner +27.0%.
- — Narrowed by about 3–10 points — The dinner step shrank from May to September for all three types (city 42.9% → 33.8%, resort 32.2% → 22.7%). The step is not a fixed value but a variable that moves month to month.
- — +2.0% / −4.0% — Year-on-year change in the January–August 2026 average of estimated settled ADR (business / city). The harder it is to lift room rates, the more the meal-plan steps become a card for building up the rate.
The Breakfast Step Within the Same Hotel — Business +14.9%, City −1.1%
The most common source of misreading when looking at meal premiums is lining up “the average of properties selling breakfast-included plans” against “the average of properties selling room-only plans.” The former skews toward mid- to upper-tier properties with a breakfast venue, the latter toward small properties without food service, so the resulting gap reflects differences in property mix rather than the price of breakfast.
This article therefore uses a paired comparison: it extracts only properties that actually sell both room-only and breakfast-included plans within the same hotel and aggregates the gap for each property. Properties selling only one of the two never enter the sample, which suppresses bias from differences in property mix. Ryokan, where meals are often designed as one with the room rate, are excluded. The N attached to each figure is the number of properties in that paired comparison.
In Kagoshima Prefecture in September 2026, the breakfast step measured this way was +14.9% for business hotels (N=56) versus −1.1% for city hotels (N=12). City hotels show almost no difference between breakfast-included and room-only. Resort hotels were at +10.0% (N=21), and the prefecture as a whole (the three types plus others) was +9.6% (N=93).
Tracing the past five months shows this pattern is not a one-off fluctuation. Business hotels went 13.7% in May → 14.1% in June → 14.9% in July → 13.2% in August → 14.9% in September, never leaving the 13–15% band. City hotels hovered near zero between −2.9% and +1.1%, at −1.1% in September. Resort hotels were the only type to widen the step, from 1.7% in May to 10.0% in September, suggesting the positioning of breakfast may have shifted after the summer peak. Placing September 2026 business hotels across Kyushu’s seven prefectures side by side, Kagoshima’s +14.9% is the thickest level in the region.
Source: Compiled by MetroEngines Research and the HotelBank Editorial Team
Why the breakfast step at city hotels is almost zero cannot be determined from this data alone. Several explanations are possible: many properties may build breakfast-included as the base plan and sell room-only alongside it at effectively the same level, or they may separate breakfast from the room rate by booking it as banquet/restaurant revenue. In addition, N=12 is a small base, small enough that design changes at a few properties move the figure by several points. Here we limit ourselves to confirming the fact that “at Kagoshima city hotels, whether breakfast is included does not show up as a difference in room rates.” Kagoshima is not the only prefecture where the city-hotel breakfast step is smaller than the business-hotel one; the same inversion appears in other prefectures nationwide as of August 2026.
The Dinner Step Far Exceeds Breakfast — Hotel Types Place the Step Differently
Run the same paired comparison between breakfast-included and half-board (breakfast plus dinner), and the picture changes. As of September 2026: business hotels +27.0% (N=23), city hotels +33.8% (N=11), resort hotels +22.7% (N=17). The prefecture as a whole was +26.2% (N=56), larger than the breakfast step in every case.
What stands out is that city hotels, which create almost no step with breakfast, apply the largest dinner step of the three types at +33.8%. In other words, city hotels do not “avoid pricing differences through meals” — they have a structure that concentrates the step in the single dinner tier. Business hotels, by contrast, use two tiers (breakfast +14.9%, dinner +27.0%), while resort hotels set both somewhat lower (breakfast +10.0%, dinner +22.7%).
Source: Compiled by MetroEngines Research and the HotelBank Editorial Team
Over the five-month trend, the dinner step shrank for all three types. Business hotels went from 30.1% in May to 27.0% in September, city hotels from 42.9% (N=10) in May to 33.8% (N=11) in September, and resort hotels from 32.2% (N=16) in May to 22.7% (N=17) in September. Either half-board rates were relatively harder to raise during the summer high-demand period, or room-only and breakfast-included prices were pushed up in peak season — both movements narrow the step, so the direction cannot be determined from the rate alone. Still, the point that “the dinner step is not fixed but a variable that moves several points a month” is an important premise for plan design.
| Hotel type | Breakfast-included vs room-only (September 2026) |
Same, May–Sep range | Half-board vs breakfast-included (September 2026) |
Same, May–Sep range |
|---|---|---|---|---|
| Business hotels | +14.9% (N=56) | +13.2 to +14.9% | +27.0% (N=23) | +27.0 to +30.9% |
| City hotels | −1.1% (N=12) | −2.9 to +1.1% | +33.8% (N=11) | +33.6 to +42.9% |
| Resort hotels | +10.0% (N=21) | +1.7 to +10.0% | +22.7% (N=17) | +21.8 to +32.2% |
| Prefecture total (excl. ryokan) | +9.6% (N=93) | +5.7 to +9.6% | +26.2% (N=56) | +26.2 to +33.9% |
Paired comparison of properties selling both meal plans within the same hotel only. Ryokan excluded. N is the number of properties in each pair (varies by a few properties by month). Source: Compiled by MetroEngines Research and the HotelBank Editorial Team
The Step Splits Even Within the Prefecture — Kagoshima City and Kirishima City
Drill the prefectural figures down to the municipal level and they split further. In September 2026, business hotels in Kagoshima City had a breakfast step of +19.2% (N=33), more than 4 points above the prefecture-wide business-hotel figure of +14.9%. The trend since May — 20.4% → 20.6% → 20.2% → 17.4% → 19.2% — has consistently stayed above the prefectural average. In Kagoshima City, the center of the market, breakfast appears to function as a paid option sitting outside the room rate.
Kirishima City, home to hot-spring areas, was at +6.5% across all hotel types (N=7). Although it widened from 2.5% in May to 6.5% in September, the level is just over half of Kagoshima City overall (+11.7%) and about one-third of Kagoshima City business hotels (+19.2%). With N=7, the figure is easily swayed by individual properties and should be used only to read the tendency. City hotels in Kagoshima City swung further negative at −6.9% (N=6) than city hotels prefecture-wide, but with N=6 this too is very small and useful only for confirming direction. In terms of room rates themselves, the intra-prefecture hierarchy has Kirishima and Ibusuki well above Kagoshima City, a structure examined in depth in our analysis of the hotel rate hierarchy within Kagoshima Prefecture.
| Area / hotel type | Breakfast-included vs room-only (September 2026) | N | May–Sep range |
|---|---|---|---|
| Kagoshima City — business hotels | +19.2% | 33 | +17.4 to +20.6% |
| Kagoshima City — all types | +11.7% | 39 | +11.5 to +13.2% |
| Kagoshima City — city hotels | −6.9% | 6 | −6.9 to −3.5% |
| Kirishima City — all types | +6.5% | 7 | +2.5 to +6.5% |
Only pairs with N≥5 properties are shown. Rows with N<10 are for reference. Source: Compiled by MetroEngines Research and the HotelBank Editorial Team
Market Estimated Settled ADR Is Moving in Opposite Directions by Hotel Type
Deciding where to place the meal steps has to be considered together with which way the underlying room rate is moving. We therefore compared Kagoshima Prefecture’s estimated settled ADR (the transaction price level estimated from OTA and other sales data, tax-excluded equivalent) year on year, using only months with finalized values on both sides.
Business hotels (N=153–161 properties) averaged in the ¥6,100 range for January–August 2026, up 2.0% year on year. By month, after early-year growth of +10.3% in January and +7.1% in February, the change converged to roughly flat: +0.3% in May, −0.9% in June, +0.6% in July and −2.8% in August. City hotels (N=21–26 properties), by contrast, averaged in the ¥7,800 range for January–August, down 4.0% year on year. After a strong start of +24.4% in January and +16.5% in February, they posted −12.8% in April, −13.4% in May, −13.6% in June, −9.4% in July and −15.8% in August — double-digit declines every month from spring onward except July.
Months with finalized values only (January 2025 – August 2026). Source: Compiled by MetroEngines Research and the HotelBank Editorial Team
| Hotel type (Kagoshima Pref.) | Jan–Aug 2025 average | Jan–Aug 2026 average | YoY | August alone, YoY | N (properties) |
|---|---|---|---|---|---|
| Business hotels | ¥6,016 | ¥6,137 | +2.0% | −2.8% (¥6,512 → ¥6,327) | 153–161 |
| City hotels | ¥8,212 | ¥7,885 | −4.0% | −15.8% (¥9,656 → ¥8,126) | 21–26 |
Estimated settled ADR (tax-excluded equivalent). Comparison between finalized months only. Source: Compiled by MetroEngines Research and the HotelBank Editorial Team
Here two facts overlap: business hotels, which manage to create a breakfast step, have held room rates at last year’s level, while city hotels, which create no breakfast step, have room rates below last year. This data does not establish causation. The ADR decline at city hotels can also be explained by factors other than meals, such as turnover in the property set (N rose from 23 to 26), new supply, or shifts in the mix of corporate and banquet demand. Even so, the fact that the breakfast step is near zero at a time when room rates are below last year points to the possibility that a card for creating price differences beyond the room rate is going correspondingly unused. This is where the revenue side has room to act.
For Revenue Managers Running Business and City Hotels in Kagoshima — Implications and Action Plan
(a) Operational implications
1. Check your own breakfast step against the market band. At Kagoshima business hotels, the same-property breakfast step stayed within a +13.2% to +14.9% band (N=56) throughout May–September, and within +17.4% to +20.6% (N=33) in Kagoshima City alone. If the gap between your room-only and breakfast-included rates is clearly smaller than this band, breakfast may effectively be treated as a free add-on. Start by calculating your current gap as a rate and confirming which band you sit in.
2. Treat it as a design decision about where to place the step. Kagoshima city hotels have almost no breakfast step at −1.1% (N=12), yet their half-board vs breakfast-included gap was the largest of the three types at +33.8% (N=11). How to allocate the total step between breakfast and dinner is a choice, and not charging for breakfast is not wrong in itself. The question is whether your property can explain if that allocation is an intended design or the result of past habit.
3. The flatter or weaker the room rate, the more meal steps matter. On a finalized basis, estimated settled ADR for business hotels in the prefecture rose 2.0% year on year for the January–August 2026 average, while city hotels fell 4.0%. When it is hard to raise the room rate itself, building up the rate for the same room through meal-plan steps remains an option. However, the dinner step narrowed from May to September for all three types (business 30.1% → 27.0%, city 42.9% → 33.8%, resort 32.2% → 22.7%), so it is better not to assume that a step, once set, stays fixed.
4. How the premium lands depends on location. Within the same prefecture, business hotels in Kagoshima City are at +19.2% (N=33), while Kirishima City, home to hot-spring areas, is at +6.5% across all types (N=7). Willingness to pay for breakfast shows up differently in the market center and the periphery. Breakfast should be worth more in areas with thinner nearby dining options, yet Kagoshima’s data does not necessarily bear this out — a reason to question the assumptions you hold about your own area.
How much the size of the step lifts the room rate is determined together with the share of guests choosing breakfast-included. The table below is an illustrative calculation, taking the room-only rate as the base (±0%), of how much the average rate per room sold rises over room-only for each combination of breakfast step and breakfast-included sales share (step × sales share; a revenue basis that does not deduct food costs). For example, at a property where 50% of sales are breakfast-included, resetting the step from +5.0% to the prefectural business-hotel level of +14.9% widens the uplift per room sold from +2.5% to +7.5%, or about 5 points.
| Breakfast-included vs room-only step | Breakfast-included sales share 30% | Breakfast-included sales share 50% | Breakfast-included sales share 70% |
|---|---|---|---|
| +5.0% (illustrative) | +1.5% | +2.5% | +3.5% |
| +10.0% | +3.0% | +5.0% | +7.0% |
| +14.9% (prefecture, business) | +4.5% | +7.5% | +10.4% |
| +19.2% (Kagoshima City, business) | +5.8% | +9.6% | +13.4% |
Illustrative (simple calculation). Measured step values are from the September 2026 same-property paired comparison (prefecture business hotels N=56, Kagoshima City business hotels N=33). Sales shares are assumptions. Source: Compiled by MetroEngines Research and the HotelBank Editorial Team
(b) Action plan
| Timeframe | Action | Decision trigger | Aim |
|---|---|---|---|
| Today – this week | Inventory, as rates, the gaps between your room-only, breakfast-included and half-board plans for the same date and room type | If your business-hotel breakfast gap stays below the market’s +13.2% to +14.9%, it is a candidate for redesign | Locate your current step on the market band |
| Today – this week | If breakfast-included is your base plan, confirm whether you also sell room-only and whether the gap between them is as intended | If a city-type property’s breakfast gap is around −1.1% (roughly the same price), verify whether that is the intended design | Find steps that have disappeared through habit |
| Within 2 weeks | Reset the step width of half-board plans, including the option of adding one more tier of ingredients or service format | If your half-board vs breakfast-included gap is below the lower end of the market’s +22.7% to +33.8% range, there is room to revise | Do not leave the largest step on the table |
| Within 2 weeks | For multi-night and business-trip demand, organize how breakfast is presented from the second night on (addressing the sense of repeating the same menu) | If the breakfast-included take-up rate on dates with a high share of multi-night stays is lower than for single nights, adjust presentation before content | Curb breakfast drop-off on multi-night stays |
| Toward next month | Build a rate-revision calendar that separates room rates from meal steps, with revisions made independently for each meal plan | Give priority slots to months where the room’s estimated settled ADR is below last year (April–August for city hotels) | Build up the rate in months when room rates do not move |
| Toward next month | Record your step rates monthly and track them against the market bands (breakfast +13–15%, dinner +23–34%) | If your step stays outside the band for two consecutive months, determine whether it reflects a demand-side change or your own design | Turn the step into a continuously managed metric |
None of these guarantees results; judge them against your property’s food-service setup, staffing and cost structure.
Summary — Three Yardsticks for Designing the Steps
Yardstick 1: The breakfast step has split three ways by hotel type. In Kagoshima Prefecture in September 2026, the gap between breakfast-included and room-only was business +14.9% (N=56), resort +10.0% (N=21) and city −1.1% (N=12). Which band your property sits in only means something when compared within your hotel type.
Yardstick 2: The dinner step far exceeds breakfast — and it is shrinking. The gap between half-board and breakfast-included was business +27.0%, city +33.8% and resort +22.7% (September 2026). In May they were 30.1%, 42.9% and 32.2% respectively, narrowing by about 3–10 points over five months. Treat the step not as a fixed value but as a variable to monitor monthly.
Yardstick 3: Look at room rates and meal steps as a set. On a finalized basis, Kagoshima Prefecture’s estimated settled ADR for the January–August 2026 average was business +2.0% and city −4.0%. When room rates fall below last year, meal-plan steps are one of the few cards left for building up the rate. It starts with calculating your own rate and placing it on the market band.
About the Data
- Definition of meal premium: A property-level paired comparison covering only properties that actually sell both room-only and breakfast-included plans (or breakfast-included and half-board plans) within the same hotel. Excluding properties that sell only one of the meal plans from the sample suppresses bias from differences in property mix. Ryokan are excluded. N= is the number of properties in each pair and varies by a few properties by month. This article deals only with rates (%), not yen levels.
- Definition of estimated settled ADR: The transaction price level (tax-excluded equivalent) estimated from OTA and other sales data (cheapest-plan level × hotel-type coefficient, an ensemble of multiple channels). Past months are finalized values; current and future months are estimates based on current sales status. Median error against published operating results is 6.6%. This article uses only months with finalized values (January 2025 – August 2026), and year-on-year changes are also calculated between finalized values.
- Breakdown of N: Estimated settled ADR covers N=153–161 business hotels per month and N=21–26 city hotels per month (both in Kagoshima Prefecture). Meal premiums cover N=11–93 properties by hotel type (shown alongside in the text and tables); municipal figures show only pairs with N≥5 properties. Figures with N<10 are treated as reference values.
- On occupancy: This article analyzes price structure and does not use occupancy (estimated OCC) metrics.
- Data as of September 16, 2026. Because sales status and inventory change daily, the figures in this article are a snapshot as of the time of retrieval.