

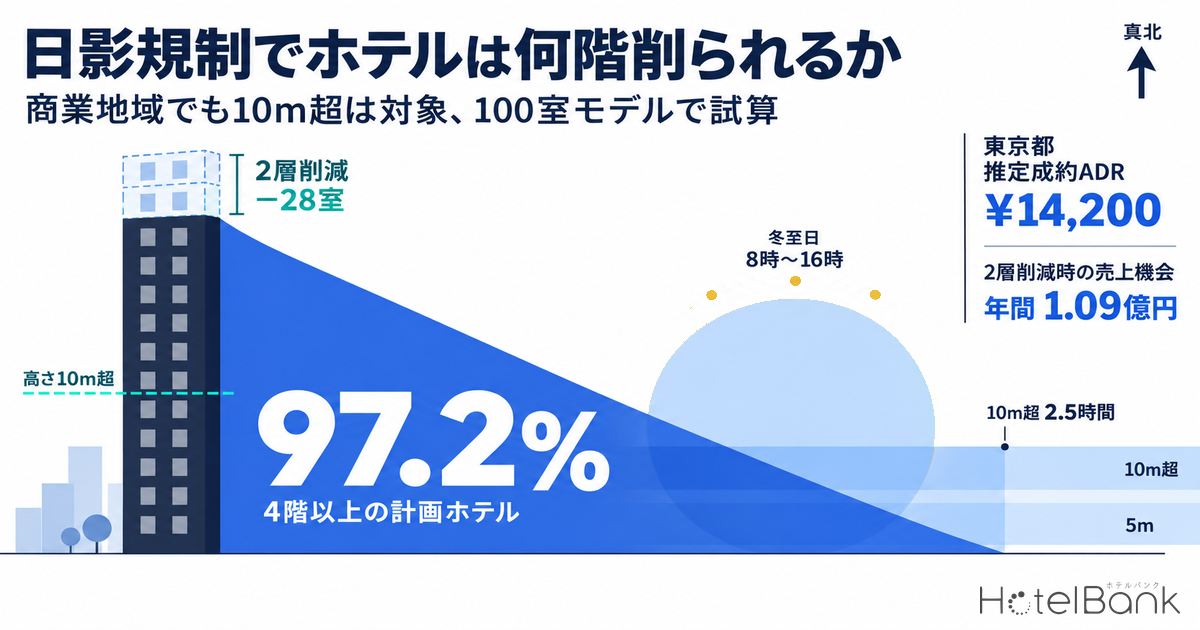
In a volume check for a hotel site, the uncertainty that survives to the very end is neither the floor area ratio (FAR) nor the absolute height limit. It is how many hours the building’s shadow falls on neighbouring land on the winter solstice. Japan’s shadow regulation (hikage kisei) under Article 56-2 of the Building Standards Act turns on the shape of the site, the direction of true north, and “which zoning district lies next door”, so a desk-top FAR calculation cannot tell you how many floors you can build. This article quantifies how the shadow regulation erodes the planned room count, using the floor-count distribution of planned hotels that we track and estimated settled ADR.
Our earlier work on hotel height and building volume has covered the FAR cap set by front-road width (Article 52(2)) — the volume layer, the 31m absolute height limit in height control districts — the height layer, the procedure from posting a mid- to high-rise ordinance sign to filing for building confirmation — the time layer, and the obstacle limitation surfaces under the Civil Aeronautics Act — the airspace layer. The shadow regulation is distinct from all of these: it is a fifth layer, “how long a shadow lingers”. Even with FAR to spare and headroom under the absolute height limit, floors get cut if the shadow exceeds the permitted hours. Put the other way, shadow is also a regulation that site conditions can be used to satisfy. We have separately quantified how the absolute height layer (Kyoto’s 20m height limit) and the airspace layer (the 45m height limit around airports) feed through to land cost per room.
Metric Definitions Used in This Article
- ADR (Average Daily Rate): Estimated settled rate (tax-exclusive equivalent), calculated by applying segment-specific adjustment factors to the lowest published plan rate of each property (2 guests per room, per-room price, tax-inclusive). Benchmarked against property-level actuals disclosed by listed hotel REITs (91 properties, most recent 3 months), the median error is approximately 7%. These are estimates and differ from each property’s actual transaction prices and accounting figures. Area-level ADR is the median of the properties covered (the level of a typical property in the area).
- Planned hotels: Building plans (building confirmation basis) from the Ministry of Land, Infrastructure, Transport and Tourism (MLIT) “Building Construction Statistics”. Floors, gross floor area and room counts are aggregated where available.
- Occupancy: The occupancy rate used for revenue conversion in this article is the national business hotel room occupancy of 75.3% for calendar 2025 (preliminary) from the Japan Tourism Agency “Overnight Travel Statistics Survey”. It is a separate series from our estimated OCC based on OTA inventory.
- Data sources: MetroEngines Research & Consulting / MLIT “Building Construction Statistics” / Japan Tourism Agency “Overnight Travel Statistics Survey”
- — Article 56-2(4): Even if the site is in a commercial zone, a building over 10m tall that casts shadow into a regulated district is subject to that northern district’s limits as they stand. Judging only by your own site’s zoning throws the volume off by two floors at a time.
- — 97.2%: Of 716 planned hotels with a known floor count, 696 have 4 or more floors (roughly over 10m). Virtually all hotel development sits in the height band where the shadow regulation applies.
- — 14.2 rooms per floor (median of planning data, hotel-only use, n=55). Losing 2 floors removes 28 rooms; with a 20-rooms-per-floor plate it removes 40 — the floor-plate assumption alone doubles the hit.
- — ¥109 million per year: Revenue opportunity lost from a 2-floor, 28-room cut in Tokyo at an estimated settled ADR of ¥14,200 and 75.3% occupancy (calendar 2025). At a 30% GOP margin and a 5% cap rate, that is equivalent to ¥660 million in asset value.
- — True north decides feasibility: Sites that combine a wide road, water body or railway on the true-north side, a 6.5m measurement plane, and higher ground to the north can support more floors even within the same zoning district.
The shadow regulation measures “time”, not “height”
Article 56-2 of the Building Standards Act regulates the duration of shadow that a building casts on adjoining land over the 8 hours from 8:00 to 16:00 true solar time on the winter solstice (9:00 to 15:00 in Hokkaido). What is measured is not the height of the building but how many hours shadow falls at set distances from the site boundary.
The regulation works in two tiers. Maximum shadow hours are set separately for the zone more than 5m and up to 10m horizontally from the site boundary and for the zone beyond 10m. The nearer zone is allowed longer hours and the farther zone shorter hours. Because a taller building throws its shadow farther, it is often the far-zone limit that caps the number of floors.
The height of the plane at which shadow is measured (the measurement plane) is also designated by ordinance. It is 1.5m above average ground level in Category I and II exclusively low-rise residential zones and rural residential zones, and 4m or 6.5m in other regulated districts. Where 6.5m is designated, shadow is measured at roughly second-floor window height, so the same building is regulated more loosely. In hotel development, whether the measurement plane is 4m or 6.5m can move the feasible building height by one floor.
Which zoning districts are covered — commercial, industrial and exclusively industrial zones are excluded “as districts”
The districts subject to the shadow regulation are not set by the Act itself; they are designated by local governments through ordinance. Eligible districts are Category I and II exclusively low-rise residential zones, rural residential zones, Category I and II mid/high-rise oriented residential zones, Category I and II residential zones, quasi-residential zones, neighbourhood commercial zones, quasi-industrial zones, and areas with no zoning designation. Commercial, industrial and exclusively industrial zones cannot be designated as regulated districts.
Appended Table 4 of the Act provides three sets of limits — types (1), (2) and (3) — and the ordinance also chooses which one applies. The structure is summarised below.
| Zoning district | Buildings regulated | Measurement plane | Over 5m, up to 10m | Over 10m |
|---|---|---|---|---|
| Category I & II exclusively low-rise residential Rural residential | Eaves height over 7m, or 3+ floors excluding basements | 1.5m | 3 hrs / 4 hrs / 5 hrs | 2 hrs / 2.5 hrs / 3 hrs |
| Category I & II mid/high-rise oriented residential | Height over 10m | 4m or 6.5m | 3 hrs / 4 hrs / 5 hrs | 2 hrs / 2.5 hrs / 3 hrs |
| Category I & II residential Quasi-residential / Neighbourhood commercial / Quasi-industrial | Height over 10m | 4m or 6.5m | 4 hrs / 5 hrs | 2.5 hrs / 3 hrs |
| Areas with no zoning designation | Eaves height over 7m and 3+ floors, or height over 10m (chosen by ordinance) | 1.5m or 4m | 3 hrs / 4 hrs / 5 hrs | 2 hrs / 2.5 hrs / 3 hrs |
| Commercial / Industrial / Exclusively industrial | Cannot be designated as regulated districts (but see paragraph 4 below) | |||
Source: Compiled from Building Standards Act Article 56-2 and Appended Table 4. In Hokkaido each hour limit is shortened (e.g. 4 hrs → 3 hrs, 2.5 hrs → 2 hrs).
The practical point comes down to one thing: the numbers are set by ordinance. In the same Category I residential zone, a municipality that adopts type (2) applies 5 hrs / 3 hrs, while one that adopts type (1) applies 4 hrs / 2.5 hrs — and the feasible number of floors changes accordingly. In Tokyo, regulated districts and limits are set in the appended table of the “Tokyo Metropolitan Ordinance on Height Restrictions for Mid- to High-Rise Buildings by Shadow”, through the combination of three factors — zoning district, designated FAR and height control district — and each ward also sets exception areas. The first step in a volume check is not to look up the zoning of the lot, but to confirm the limit type and measurement plane in the relevant municipality’s ordinance table.
“The site is in a commercial zone, so shadow doesn’t matter” is wrong — Article 56-2(4)
This is the most important point in this article. Article 56-2(4) provides that a building outside a regulated district that is more than 10m tall and casts shadow into a regulated district on the winter solstice is deemed to be located within that regulated district, and the regulation applies accordingly.
In other words, even if the site is in a commercial zone, if the land to the north across the road is designated as a shadow-regulated district — for example a Category I residential or neighbourhood commercial zone — then a building over 10m tall (roughly 4 floors or more at typical hotel floor heights) is subject to that northern district’s limits as they stand. Looking only at your own site on the zoning map and concluding “commercial, so no shadow limits” throws the volume off by two floors at a time.
Source: Compiled by MetroEngines Research & Consulting from Building Standards Act Article 56-2(4) and materials of the Investment Working Group, Council for Promotion of Regulatory Reform, Cabinet Office
This structure is a real issue for mid-sized hotels in commercial zones near stations. Station-front commercial zones are often designated as narrow strips, switching to residential zoning one block back. If the north side is residential, a hotel can hit a shadow ceiling even with 600% FAR. Reading the shadow layer means “checking zoning not just for the site but for the adjoining block in the true-north direction”.
97.2% of planned hotels fall in the “over 10m” floor band
So how many plans cross this 10m threshold? Among building plans that include hotel use, which we track from MLIT’s “Building Construction Statistics”, we aggregated the 716 plans for which a floor count was available.
Source: Compiled by MetroEngines Research & Consulting from MLIT “Building Construction Statistics” (N=716 plans with a known floor count)
Plans with 4 or more floors number 696, or 97.2%. Assuming a hotel floor-to-floor height of about 3.0–3.3m, a 4-storey building is roughly 12–13m, above the 10m threshold. In practice, virtually all hotel development can be assumed to sit in the height band where the shadow regulation applies. The largest band is 10–14 floors with 358 plans (50.0%); here shadow extends well beyond 10m from the site boundary, making it the typical range in which the far-zone limit (2.5 or 3 hours) caps the number of floors.
*This data is on a building confirmation basis; counts are expected to rise as further applications are added, so the figures represent a lower bound of the confirmed pipeline at present. Tokyo accounts for the large majority of records (531 plans), so the regional mix is skewed and does not directly represent the national distribution of floor counts. For reference, the existing stock base is the 27,162 properties and 1,266,933 rooms (2026) tracked by MetroEngines Research whose operation is confirmed on OTAs.
How many rooms are lost when 2 floors are cut — a 100-room model
When shadow cuts floors, what is lost is not “floors” but “rooms”. Knowing the rooms per floor lets us convert floors cut into rooms lost. Among plans in our data with both floor count and room count, those whose principal use is hotel only (n=55) had a median of 14.2 rooms per floor. Across all plans including mixed use (n=77), the median was 12.0 rooms. The model below uses 14 rooms per floor as the base and assumes a hotel of around 100 rooms.
| Rooms per floor | Guestroom floors for 100 rooms | 1 floor cut | 2 floors cut | 3 floors cut |
|---|---|---|---|---|
| 10 rooms (small / irregular site) | 10 floors | 90 rooms (−10) | 80 rooms (−20) | 70 rooms (−30) |
| 14 rooms (planning-data median) | approx. 7 floors | 86 rooms (−14) | 72 rooms (−28) | 58 rooms (−42) |
| 20 rooms (large floor plate) | 5 floors | 80 rooms (−20) | 60 rooms (−40) | 40 rooms (−60) |
Source: Compiled by MetroEngines Research & Consulting from MLIT “Building Construction Statistics” (rooms per floor calculated from plans with both floor count and room count: hotel-only use n=55, including mixed use n=77)
The relationship to note here is that the larger the floor plate, the bigger the hit from each floor cut. Cut 2 floors from a 20-rooms-per-floor plan and 40 rooms — 40% of the business plan — disappear. Conversely, a 10-rooms-per-floor plan on a narrow site loses only 20 rooms from a 2-floor cut. Because shadow is a regulation that effectively prices height, for the same room count a lower, wider building is less exposed. Building low and wide, however, requires spare building coverage and site area, so in the end it is the shape of the site that determines feasibility.
Putting a yen figure on the annual revenue of the lost rooms
Rooms lost disappear as revenue opportunity every year. Using estimated settled ADR (MetroEngines Research & Consulting, business hotel segment, 12-month average from September 2025 to August 2026) and the 2025 national business hotel room occupancy of 75.3% from the Japan Tourism Agency “Overnight Travel Statistics Survey”, we converted the annual revenue impact for the 100-room model at 14 rooms per floor.
Source: Compiled from MetroEngines Research & Consulting (estimated settled ADR, business hotel segment) / Japan Tourism Agency “Overnight Travel Statistics Survey”, calendar 2025 (preliminary)
| Area | Estimated settled ADR (12-month avg.) | N (properties) | 1 floor cut (−14 rooms) | 2 floors cut (−28 rooms) | 3 floors cut (−42 rooms) |
|---|---|---|---|---|---|
| Tokyo | ¥14,200 | 894–924 | ¥55M | ¥109M | ¥164M |
| Kyoto | ¥13,900 | 314–329 | ¥54M | ¥107M | ¥160M |
| Fukuoka | ¥10,900 | 331–341 | ¥42M | ¥84M | ¥126M |
| Osaka | ¥10,000 | 487–503 | ¥39M | ¥77M | ¥116M |
| Hokkaido | ¥8,900 | 419–441 | ¥34M | ¥68M | ¥102M |
| Aichi | ¥7,800 | 319–329 | ¥30M | ¥60M | ¥90M |
Source: MetroEngines Research & Consulting (estimated settled ADR = 12-month average September 2025–August 2026, business hotel segment) / Japan Tourism Agency “Overnight Travel Statistics Survey” (occupancy 75.3%)
Circle size and shade show the annual revenue impact of a 2-floor cut (−28 rooms). Source: MetroEngines Research & Consulting (estimated settled ADR, business hotel segment) / Japan Tourism Agency “Overnight Travel Statistics Survey”
If 2 floors and 28 rooms are cut in Tokyo, about ¥109 million a year of revenue disappears from the business plan. Taking a conservative 30% GOP margin, that equals roughly ¥33 million of gross operating profit a year; capitalised at a 5% cap rate, it translates to asset value on the order of ¥600 million. The precision of the volume check feeds directly into the land bid price.
The result also moves with the rooms-per-floor assumption. For the Tokyo 2-floor-cut case, the annual loss is about ¥78 million at 10 rooms per floor, about ¥109 million at 14 and about ¥156 million at 20 — a twofold spread from the floor-plate assumption alone. For those reviewing a business plan, checking “how many rooms per floor and how many floors are assumed” gives a faster read on shadow-risk sensitivity than the planned room count itself.
Business impact for the Tokyo 100-room model under three scenarios
Because the number of floors cut depends on site conditions, it is more practical in business-plan review to hold a range rather than a single value. With common assumptions of 14 rooms per floor, Tokyo’s estimated settled ADR of ¥14,200 and 75.3% occupancy (calendar 2025), the annual revenue, gross operating profit and implied asset value for cuts of 1 floor (optimistic), 2 floors (base) and 3 floors (pessimistic) are as follows.
| Scenario | Floors cut / rooms lost | Annual revenue opportunity | Gross operating profit (30% GOP margin) | Implied asset value (5% cap rate) |
|---|---|---|---|---|
| Optimistic | 1 floor / −14 rooms | ¥55M | approx. ¥16.4M | approx. ¥330M |
| Base | 2 floors / −28 rooms | ¥109M | approx. ¥32.8M | approx. ¥660M |
| Pessimistic | 3 floors / −42 rooms | ¥164M | approx. ¥49.2M | approx. ¥980M |
Annual revenue = estimated settled ADR ¥14,200 × rooms lost × 365 days × occupancy 75.3%. Source: Compiled from MetroEngines Research & Consulting (estimated settled ADR, business hotel segment, September 2025–August 2026) / Japan Tourism Agency “Overnight Travel Statistics Survey”, calendar 2025 (preliminary)
As a further sensitivity, we flex occupancy, the demand-side assumption. Occupancy is centred on the Japan Tourism Agency’s national business hotel figure of 75.3% (calendar 2025, preliminary) and ranged from 65% to 85%. A difference of one floor cut outweighs a 20-point difference in occupancy — in this sensitivity, also centred on the calendar 2025 figure, a 3-floor cut at 65% occupancy (¥142M) is a bigger loss than a 2-floor cut at 85% occupancy (¥123M). In other words, the precision of the volume check matters more to the business plan than the precision of the demand outlook.
Source: Compiled from MetroEngines Research & Consulting (estimated settled ADR, business hotel segment, 12-month average September 2025–August 2026, Tokyo N=894–924 properties) / Japan Tourism Agency “Overnight Travel Statistics Survey”, calendar 2025 (preliminary)
Relief provisions — how feasibility can be created
The shadow regulation includes several mechanisms that effectively relax it depending on site conditions. Rather than treating them as “loopholes”, it is more practical to use them as a checklist for identifying which sites can actually deliver the planned room count.
| Type of relief | What it provides | How to read it in site selection |
|---|---|---|
| Site abutting a road, water body or railway | The site boundary is deemed to lie on the far boundary of that road, etc. Where the width exceeds 10m, the deemed boundary is a line 5m in from the far boundary towards the site | Sites facing a wide road, river or railway on the true-north side are strong. Feasible floor count changes even within the same zoning district |
| Level difference with adjoining land | If the ground level of the site casting the shadow is 1m or more below the adjoining land, the ground level is deemed raised by half of (the level difference minus 1m) | Sites with higher ground to the north can be advantaged. Consider together with the grading plan |
| Designated measurement plane | Ordinance designates either 4m or 6.5m | Where 6.5m is designated, the feasible floor count rises under the same hour limits. Useful in initial screening when comparing sites |
| Permission by the designated administrative agency | Granted where, owing to land conditions etc., the agency finds no risk of harming the surrounding living environment and obtains the consent of the Building Review Board | Do not assume it. It introduces wide uncertainty into schedule and cost |
| Coordination with the north-side slant plane | Buildings subject to the shadow regulation by virtue of paragraph 4 are exempt from the north-side slant plane restriction | Height is not restricted twice. Initial schemes drawn on the assumption of slant-plane cuts may have room to be revisited |
Source: Compiled by MetroEngines Research & Consulting from Building Standards Act Article 56-2 and Enforcement Order Article 135-12. Specific values and district designations depend on each municipality’s ordinance
In practice the sequence is: (1) confirm the zoning of the site and of the adjoining block in the true-north direction; (2) confirm in the municipality’s ordinance the limit type (4 hrs / 2.5 hrs or 5 hrs / 3 hrs) and the measurement plane (4m or 6.5m); (3) confirm the width of any road, water body or railway on the true-north side; and (4) only then pencil in a floor count and draw the shadow diagram. Steps (1) and (2) alone can be completed the same day from public information, and even that narrows the feasible floor range considerably.
Summary — reading feasibility through “shadow time”
Unlike FAR or absolute height limits, the shadow regulation’s numbers are not written on the drawings. That is exactly why it is easily overlooked in initial screening before consultants are engaged, and why it later undermines the room-count assumption of the business plan. The points of this article can be summarised as follows.
| Issue | Key conclusion |
|---|---|
| What is measured | Not height, but the duration of shadow from 8:00 to 16:00 on the winter solstice (9:00 to 15:00 in Hokkaido). Two tiers: over 5m up to 10m from the boundary, and beyond 10m |
| Who it applies to | Districts designated by ordinance among residential, neighbourhood commercial, quasi-industrial and non-zoned areas. Commercial, industrial and exclusively industrial zones cannot be designated |
| Biggest pitfall | Article 56-2(4). Even outside a regulated district, a building over 10m that casts shadow into one is regulated. Hotels qualify at roughly 4 floors or more |
| Share affected | Of 716 plans with a known floor count, 696 (97.2%) have 4 or more floors |
| Financial impact | In a 100-room model at 14 rooms per floor, a 2-floor cut = 28 rooms lost. In Tokyo, about ¥109 million a year of revenue opportunity |
| Conditions for feasibility | A wide road, water body or railway on the true-north side / a 6.5m measurement plane / higher ground to the north. Sites meeting these three conditions support more floors within the same zoning district |
Put differently, shadow is not a story of “the regulation is too strict to develop”. It is a question of site-selection resolution: depending on what lies to the true north, sites with the same zoning and the same FAR can differ in feasible room count by tens of rooms. A comparable case where site-side conditions drive the feasible room count is the analysis of scenic districts, where building coverage is capped as low as 20% and land cost per room rises roughly fivefold. When regional banks and funds review business plans, too, the validity of the planned room count is checked faster by working back from “true-north conditions and rooms per floor” than from “gross floor area ÷ room size”.
* This article is general in nature. Regulated districts, limit values and measurement planes under the shadow regulation are all set by local government ordinance, and values differ by municipality and district even within the same zoning district. Whether shadow compliance can be achieved also depends on site-specific conditions such as shape, orientation, level differences and surrounding buildings, so when judging the actual number of floors and rooms, please always consult the designated administrative agency (building official) with jurisdiction over the site. The financial estimates in this article are model calculations based on public data and do not guarantee the returns of any specific business plan.
References & Sources
■ Laws and ordinances
- Building Standards Act (Act No. 201 of 1950), Article 56-2 and Appended Table 4 — e-Gov Law Search (Japanese)
- Tokyo Metropolitan Ordinance on Height Restrictions for Mid- to High-Rise Buildings by Shadow (Tokyo Metropolitan Government regulations database, Japanese)
- Shibuya City, “Building restrictions under the shadow regulation” (Japanese)
■ Government materials and statistics
- Cabinet Office, Council for Promotion of Regulatory Reform, Investment Working Group, “Overview of the Shadow Regulation (Building Standards Act Article 56-2)” (Japanese)
- Japan Tourism Agency, “Overnight Travel Statistics Survey” (calendar 2025, preliminary)
- MLIT, “Building Construction Statistics” (building plan data, building confirmation basis)
■ Data sources
Floor counts and room counts of planned hotels were compiled by MetroEngines Research & Consulting from MLIT’s “Building Construction Statistics” (building confirmation basis): 731 unique plans, of which 716 have a known floor count and 77 have both floor count and room count (55 with hotel-only principal use). Estimated settled ADR is the company’s 12-month average for the business hotel segment in six major prefectures, September 2025–August 2026 (Tokyo N=894–924 properties, etc.). Occupancy is the national business hotel figure of 75.3% from the Japan Tourism Agency “Overnight Travel Statistics Survey”, calendar 2025 (preliminary). Existing stock is the 27,162 properties and 1,266,933 rooms (2026) whose operation the company can confirm.
■ Model assumptions
The 100-room model sets rooms per floor at three levels — 10, 14 (the planning-data median of 14.2 rounded) and 20 — combined with cuts of 1 to 3 floors. Annual revenue opportunity is calculated as “estimated settled ADR × rooms lost × 365 days × occupancy 75.3% (calendar 2025)”; gross operating profit uses a 30% GOP margin and implied asset value a 5% cap rate, both conservative settings. Floor-to-floor height is taken as 3.0–3.3m, treating a 4-storey building as roughly 12–13m for the 10m threshold test. Occupancy sensitivity is ranged from 65% to 85%.
■ Limitations
Regulated districts, limit values and measurement planes under the shadow regulation are all set by local government ordinance, so values differ by municipality and district even within the same zoning district. Feasibility depends on site-specific conditions — shape, orientation, level differences and surrounding buildings — and the model in this article does not guarantee the floor or room count of any specific site. Tokyo accounts for the large majority of planned-hotel records (531 plans), so the data does not directly represent the national distribution of floor counts. Being on a building confirmation basis, counts will rise as further applications are added, and current values are a lower bound. ADR figures are estimates and differ from each property’s actual transaction prices and accounting figures.
■ Market data
- MetroEngines Research & Consulting — estimated settled ADR (business hotel segment, September 2025–August 2026), floor and room count aggregation of planned hotels (N=716), existing stock of 27,162 properties and 1,266,933 rooms (2026)