

“Long-stay hotels” are one of the most loosely defined segments in Japan’s lodging market. Apartment-style properties with kitchens and washing machines, furnished serviced apartments, and conventional hotels that have simply repackaged their rates into monthly plans — businesses with entirely different operating models and revenue structures are all lumped together under the same label. This article first breaks the segment down from an operator’s perspective, lays out the main brands operating in Japan side by side, and then shows, area by area, the price levels at which these properties actually sell, based on measured listed prices.
Metric Definitions Used in This Article
- Listed price (all-plan average): The average of the selling prices each property publishes on booking sites and similar channels. It is the per-room rate for two guests sharing one room (tax included), covering all plans from room-only to meal-inclusive. All price comparisons in this article use this listed-price basis. Area-level listed prices are the median of the daily average prices of the properties in scope (i.e., the level of a typical property in that area).
- Prices are per room: Long-stay hotel rooms are often spacious layouts designed for 3–6 guests, so the per-room listed price includes differences in room capacity. The comparisons in this article show “how much one room sells for,” not a per-person comparison.
- Estimated settled ADR: Shown in some places for reference. An estimated settled room rate (tax-excluded equivalent) calculated by applying a property-type-specific adjustment factor to the lowest-plan price level each property publishes. Checked against property-level results disclosed by listed hotel REITs (91 properties, most recent three months), the median error is about 7%. It is an estimate and differs from each property’s actual settled prices and accounting figures.
- Data source: MetroEngines Research (listed prices, property information)
- — Three types: Long-stay properties split into apartment-style, serviced-apartment and extended-stay-ready hotels, each with a different revenue structure and different investment considerations.
- — 1.1–3.9x the area overall: Per-room listed prices for the 113 properties in scope (median, September 2025–August 2026) were 2.29x the area overall in Tokyo, 3.95x in Osaka and 1.11x in Kyoto. The multiple is driven by the composition of each area’s property base.
- — 1.60x seasonal swing: The 35 Tokyo properties in scope ranged from ¥48,400 (September 2025) to ¥77,200 (December 2025), a wider price swing than Tokyo overall (1.35x).
- — 63% have 29 rooms or fewer: 71 of the 113 properties are small, low-staff, dispersed operations with 29 rooms or fewer, polarized against staffed-service properties with 30–59 rooms (31 properties).
- — Translate prices into monthly terms: Search queries feature cost-of-living comparison terms such as “cost” and “one month.” Presenting total multi-night and monthly-equivalent prices, and capturing corporate and project demand in the off-season, are the key issues.
Long-Stay Hotels Fall into Three Types
The first thing operators need when making investment decisions or defining a competitive set is a clear segmentation. From a revenue-structure standpoint, the properties called “long-stay” in Japan can be organized into the following three types.
| Type | Room configuration | Main demand | Revenue characteristics |
|---|---|---|---|
| Apartment-style | Kitchen and dining area, around 30–60㎡, sleeps 4–6 | Inbound families, groups, mid-length stays | High per-room rates but few rooms. A model that builds revenue per room |
| Serviced apartment | Residences with furniture and appliances, weekly or monthly contracts | Expatriates, long project assignments, temporary stays by high-net-worth individuals | Low occupancy volatility and stable, rent-like income. On the other hand, harder to capture rate upside in peak periods |
| Extended-stay-ready hotel (monthly plans) | Standard hotel rooms with added washer-dryers, microwaves, etc. | Solo long business trips, temporary housing between moves | Existing rooms are allocated to long-stay inventory. Housekeeping frequency design drives profitability |
Source: Compiled by HotelBank Editorial Team from company disclosures
Although all three are “long-stay,” the key investment considerations differ. Apartment-style properties can command high revenue per room, but each building has few rooms, so development projects tend to be small. Serviced apartments enjoy stable occupancy but benefit less from peak-season price upside. Extended-stay-ready hotels require the least additional investment, but every room allocated to long-stay inventory carries an opportunity cost in the form of forgone high-rate short-stay demand. Below, we use data to outline the market, focusing on the apartment-style and serviced-apartment types, for which price data can be collected continuously.
Demand Side: Search Growth Comes from the “Living” Context
One indicator of demand is search behavior. HotelBank’s search performance data (last 90 days) shows that impressions for long-stay-related queries have reached a meaningful scale. “Long-stay hotel brands Japan” (長期滞在型ホテル ブランド 日本) recorded 794 impressions with an average position of 3.93; “hotel living” (ホテル暮らし) had 2,086 impressions; “cheap one-month hotel living” (1ヶ月ホテル暮らし 安い) had 1,241; and “hotel living cost” (ホテル暮らし 費用) had 1,012. More recently, we also observed a “hotel living”-related query whose impressions grew 6.8x over the prior period (1,567 impressions).
The vocabulary mix is what stands out. Comparison terms such as “brand” and “features” sit alongside practical living terms such as “cost,” “cheap” and “resident registration.” In other words, searchers are increasingly evaluating accommodation not as an extension of travel but as a substitute for the cost of housing. For operators, this means prices need to be translated from a per-night unit into monthly terms, and that the comparison set may be rental housing or monthly furnished apartments rather than other hotels. Note that this search data reflects impressions for this site only and does not represent total market search volume.
Major Brands Operating in Japan (Side-by-Side Overview)
Below, operators running apartment-style and serviced-apartment properties in Japan are laid out side by side based on each company’s public disclosures. Because companies count their properties differently (directly operated only, or including management contracts and partnerships, or including overseas properties), we do not rank them by size.
| Brand | Operator | Main areas | Rooms, intended use and disclosures |
|---|---|---|---|
| MIMARU / MIMARU SUITES | Cosmos Hotel Management (Daiwa House Group / Cosmos Initia) | Tokyo, Kyoto, Osaka | Rooms from about 40㎡ with kitchen and dining area, oriented toward inbound families. Currently operates about 1,500 rooms and has announced a goal of 3,000 rooms by 2030 (December 2025). Opening two new properties in Osaka in autumn 2026 |
| Citadines / Ascott / Somerset / Oakwood / lyf | Ascott Japan (The Ascott Limited) | Tokyo, Yokohama, Osaka, Kyoto, Fukuoka | Announced that it operates 22 properties under five brands centered on serviced residences. “Citadines North Shinjuku Tokyo” is scheduled to open on October 28, 2026 |
| GRAND BASE | Recrea | Mainly Kyushu and western Japan (Fukuoka, Nagasaki, Hiroshima, Oita, etc.) | Whole-building or few-room properties for 3–6 guests. A model built around low-staff operations; announced about 50 properties nationwide |
| Minn | SQUEEZE | Tokyo, Osaka, etc. | Apartment hotels centered on rooms with kitchens. Highlights low-staff operations powered by its in-house operating system |
| Randor Residence | Randor Hotels & Resorts | Tokyo, Kyoto, Hiroshima, Okinawa, etc. | Residence-style properties for mid- to long-term stays. A dispersed footprint with small room counts per property |
Source: Compiled by HotelBank Editorial Team from company press releases and official websites (order unrelated to size)
Beyond these, established hotel brands capturing long-stay demand as extended-stay-ready hotels have also become common. Tokyu Stay offers rooms with washer-dryers and promotes flat-rate long-stay plans on its official website. Villa Fontaine (Sumitomo Realty & Development) also has stay-oriented room configurations, mainly in central Tokyo. Among foreign operators, Hilton runs a family of extended-stay brands globally (Homewood Suites, Home2 Suites, LivSmart Studios, etc.), and our own search data shows “Hilton extended-stay hotel features” (ヒルトン長期滞在型ホテル 特徴) with 3,476 impressions, confirming strong interest from within Japan. Domestic developers entering the apartment-hotel business, such as Mitsubishi Estate with WAYPOINT, and Hilton’s newer Apartment Collection brand point to the same trend.
Measured Price Levels: Per-Room Listed Prices at 1.1–3.9x the Area Overall
From here on, we look at measured data. Of the apartment-style and serviced-apartment brands above, we took the 113 properties (3,341 rooms) whose prices MetroEngines Research can observe continuously, and aggregated the median listed price by area over the last 12 months (September 2025–August 2026). The benchmark is the listed price for each area overall over the same period on the same basis (two guests per room, per room, tax included, all-plan average).
Long-stay figures cover the 78 of the 113 properties located in these four prefectures (Tokyo 35, Kyoto 17, Fukuoka 18, Osaka 8); area overall covers listed properties in each prefecture. Monthly medians, September 2025–August 2026.
Source: MetroEngines Research; compiled by HotelBank Editorial Team
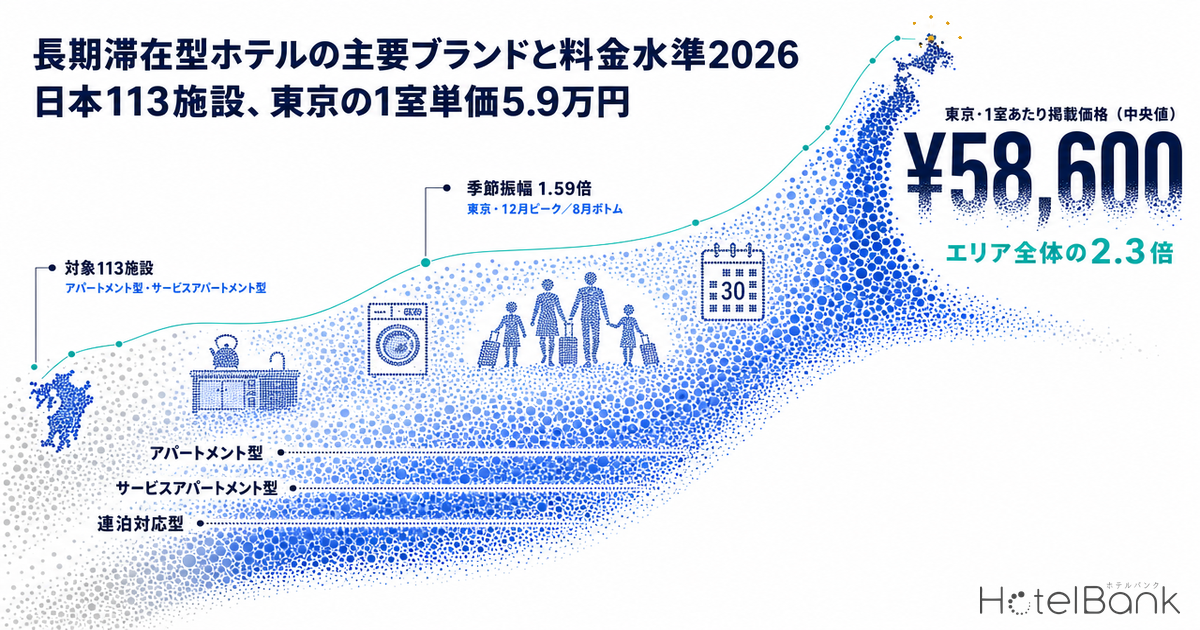
In Tokyo, the median per-room listed price for the 35 long-stay properties (out of the 113) was ¥58,600 — 2.3x the Tokyo-wide median listed price of ¥25,500 over the same period. Osaka came in at ¥72,000, or 3.9x the area overall (8 properties), and Fukuoka at ¥34,700, or 1.4x (18 properties). Kyoto, by contrast, was ¥35,400, only 1.1x the area-wide ¥31,900, a small gap.
These differences in multiples are determined not by whether long-stay properties sell at high prices, but by the composition of the benchmark area. Kyoto’s property base includes many ryokan and high-priced accommodations, so the area-wide listed price itself is high and the gap narrows. Osaka, conversely, has deep low-priced inventory centered on business hotels, so the gap versus long-stay properties with spacious rooms widens considerably. Reading the multiple as “Kyoto is at a disadvantage” would be a mistake; when designing a price position for market entry, the multiple must be read together with the area’s property mix.
| Area | Properties in scope | Avg. rooms per property | Per-room listed price (long-stay, median) |
Lowest-plan level (median) |
Area-wide listed price |
Multiple | Ref.: area-wide est. settled ADR |
|---|---|---|---|---|---|---|---|
| Tokyo | 35 properties / 1,561 rooms | 44.6 rooms | ¥58,600 | ¥36,700 | ¥25,500 | 2.29x | ¥14,500 |
| Kyoto | 17 properties / 602 rooms | 35.4 rooms | ¥35,400 | ¥19,000 | ¥31,900 | 1.11x | ¥15,500 |
| Fukuoka | 18 properties / 139 rooms | 7.7 rooms | ¥34,700 | ¥15,900 | ¥24,300 | 1.43x | ¥11,900 |
| Osaka | 8 properties / 648 rooms | 81.0 rooms | ¥72,000 | ¥47,400 | ¥18,200 | 3.95x | ¥9,800 |
Monthly medians, September 2025–August 2026. Long-stay figures cover the properties in each area among the 113 in scope. Area overall covers the listed properties MetroEngines Research tracks in each prefecture (2,406 properties in Tokyo, etc.). Aichi (4 properties) and Hokkaido (4 properties) are excluded from the table due to small sample sizes.
Source: MetroEngines Research; compiled by HotelBank Editorial Team
In practice, the more important column is “Lowest-plan level,” fourth from the right. In long-stay negotiations, the starting point is not the all-plan average but the price band close to the floor each property offers. That level is ¥36,700 in Tokyo, ¥19,000 in Kyoto and ¥15,900 in Fukuoka. Fukuoka’s notably low figure is consistent with its 18 properties averaging just 7.7 rooms each, with small, low-staff operations predominating. Even within the same “long-stay” label, mid-sized family-oriented properties in Tokyo and Osaka and small dispersed properties in Kyushu are selling fundamentally different products.
Seasonality: Long-Stay Properties Swing More
The conventional wisdom that “long-stay properties have stable occupancy and rates” does not hold, at least for Japan’s apartment-style properties today. Tracking the monthly listed prices of the 35 Tokyo properties in scope, the peak of ¥77,200 in December 2025 compares with a low of ¥48,400 in September 2025 — a 1.60x swing. Tokyo overall ranged from ¥29,300 to ¥21,800 over the same period, a 1.35x swing, meaning long-stay properties show larger seasonal price fluctuations.
Tokyo long-stay N=35 properties; Tokyo overall N=1,652–2,416 properties (varies by month). September 2025–August 2026.
Source: MetroEngines Research; compiled by HotelBank Editorial Team
The reason lies in the nature of demand. Japan’s apartment-style properties currently rely more on leisure demand from inbound families and groups than on expatriates or long-term business travelers. Leisure demand concentrates heavily around the year-end holidays, cherry blossom season and major holiday periods, so the price curve resembles that of a typical leisure property. The implication for operators is clear: building a financial plan on the assumption that “long-stay = insensitive to the economy and seasons” will fail to account for off-season dips. Conversely, there is still significant room to smooth this swing by inserting corporate contracts and project-related long-stay demand into weekdays and the off-season.
Property Size Is Polarized
Splitting the 113 properties by room count reveals the structure of this market. There are 39 properties with 1–9 rooms and 32 with 10–29 rooms, so small properties with 29 rooms or fewer make up 63% of the total. Meanwhile, 31 properties have 30–59 rooms, and only 4 have 100 rooms or more.
N=113 properties, 3,341 rooms.
Source: MetroEngines Research; compiled by HotelBank Editorial Team
This polarization mirrors a split in operating models. The 1–9 room band consists of low-staff properties premised on unstaffed check-in and outsourced housekeeping, designed to work with small upfront investments such as conversions of existing buildings or whole-building repurposing. The 30–59 room band deploys in-house staff and commands higher rates through multilingual support and family-oriented services. The in-between 10–29 room band is where the break-even point shifts depending on which model a property leans toward, making it the zone that demands the most design judgment at entry. Large properties with 100+ rooms are limited to 4 because stacking many spacious rooms lowers room efficiency per unit of floor area, and this constraint defines the per-building development scale of long-stay properties.
Circle size indicates room count. Locations of the 113 properties in scope (N=113 properties, 3,341 rooms). Source: MetroEngines Research
The map shows that, in addition to the three major metropolitan areas of Tokyo, Kyoto and Osaka, there is a second cluster in northern Kyushu stretching from Fukuoka to Nagasaki and Oita. The former targets inbound family demand, while the latter uses small, low-staff properties to capture mid-length-stay demand in regional cities — the same segment, aiming at different demand.
Supply Ramp-Up and Guest Ratings
Stacking up the opening years of 138 properties across the six brands covered shows that this segment took shape over the last seven to eight years. The cumulative total through 2018 was 856 rooms; 422 rooms were added in 2019, 789 in 2020 and 761 in 2022, bringing the cumulative total to around 3,900 rooms.
*Based on confirmed listings on booking sites and similar channels. Listings appear a few months before opening, so figures for recent years may increase as listings are reflected. Coverage is limited to the six brands discussed in this article and does not represent total long-stay supply.
Source: MetroEngines Research & Consulting (based on OTA listing confirmation, N=138 properties)
Guest ratings are also worth checking. Among the 113 properties in scope, the 110 with available rating scores have a median overall score of 4.38 (out of 5). This level suggests that the product’s defining features — spacious rooms and kitchens — are valued by guests who have actually stayed. For a segment whose supply ramped up in a short period, it indicates that quality foundations are being established.
Implications for Operators
Based on the data so far, we summarize three key issues for operators and investors considering long-stay hotels.
First, revenue models must be built on a per-room basis. The ¥58,600 per-room listed price of the Tokyo properties in scope is 2.3x the area overall, but that does not mean the per-person rate is 2.3x. It reflects rooms for 4–6 guests being sold as a single room, and because room counts are small, total property revenue does not grow as much as the room rate would suggest. Comparing against existing property types on revenue per unit of floor area is essential, including weighing central business districts against resort locations on revenue per tsubo.
Second, there is room to secure off-season demand sources at the design stage. Tokyo’s 1.60x seasonal swing shows a heavy reliance on leisure demand. If demand with different seasonality — corporate long-term business travel, project demand from redevelopment and factory construction, stays accompanying medical care, or temporary housing between moves — can be built into weekdays, the stability of annual RevPAR (room revenue per available room) will improve. This is upside that existing properties can also pursue without additional investment.
Third, translate prices into monthly terms. With search interest concentrated on “cost” and “one month,” showing only a nightly rate makes it hard to be considered in comparisons. Presenting total multi-night and monthly-equivalent prices up front is an effective move toward prospects comparing against rentals and monthly furnished apartments. For benchmark discount rates by length of stay, see our measurements in Japan Hotel Long-Stay Discounts: 15% at 7 Nights, 20% at 30 Nights.
For Hotels: Plan-Name Tips for This Theme
Most common elements in public plan names promoting multi-night stays (N=1,446) —
Multi-night discount 96%Breakfast included 32%Room only 27%Long stay / living 20%Eco 18%Business 8%
Examples of actual names (anonymized, translated):
- [Business Pack] Great value for 2+ nights! Free natural hot-spring bath & breakfast buffet
- [Multi-Night Discount / Breakfast] Popular Japanese-Western buffet ◆ A base for business & sightseeing
- [Value Multi-Night Plan] Experience relaxed country living · BBQ and self-catering OK! Whole-house rental
*Trends are based on aggregated public plan names and do not indicate that naming causes sales.
Summary
Long-stay hotels are not a single market but a collection of three layers with different revenue structures: apartment-style, serviced apartments and extended-stay-ready hotels. Our measurements show that per-room listed prices for the 113 apartment-style and serviced-apartment properties were 1.1–3.9x the area overall, with the multiple depending heavily on each area’s property mix. Property size splits into two poles — 29 rooms or fewer and 30–59 rooms — corresponding to distinct operating designs: low-staff for the former and staffed service for the latter.
Tokyo’s 1.60x seasonal swing shows that this segment is currently supported by leisure demand. The premise that “long-stay = stable revenue” only holds once the demand side is deliberately designed. On the search side, the number of people evaluating accommodation as a substitute for housing costs is clearly growing, and how to draw that demand into weekdays and the off-season will be the issue that separates revenue outcomes over the next few years.
Data note: Listed prices in this article are aggregated from selling prices published on booking sites and similar channels and differ from actual settled prices. Coverage is limited to the 113 properties whose prices MetroEngines Research could observe continuously within its tracking scope and does not cover all long-stay hotels in Japan. Prices are per room; please note that room capacity varies by property.
References and Sources
■ Market data
- MetroEngines Research — Listed prices (N=113 properties, 3,341 rooms, September 2025–August 2026), listed prices by area, property information
- HotelBank Editorial Team research — Search performance data for this site (last 90 days)
■ Company disclosures (in Japanese)
- Apartment hotel “MIMARU” restarts new openings toward 3,000 rooms by 2030 (Daiwa House Group, August 26, 2026)
- Family-favored apartment hotel “MIMARU” accelerates expansion in the Osaka area (Cosmos Hotel Management)
- Citadines opens new base “Citadines North Shinjuku Tokyo” in Tokyo’s Shinjuku area on October 28, 2026 (Ascott Japan)
- Ascott (The Ascott Limited) announces sales strategy (Monthly Hoteres)
- GRAND BASE official website (Recrea)
- “GRAND BASE Nagoya Chiyokura” opens under Recrea Inc.’s low-staff hotel operation business
- Flat-rate long-stay plans (Tokyu Stay official)
- Extended-stay hotel brands | Long stays at Hilton (Hilton official)
- Why global hotel majors are focusing on “long stays” (Travel Voice, July 28, 2026)