

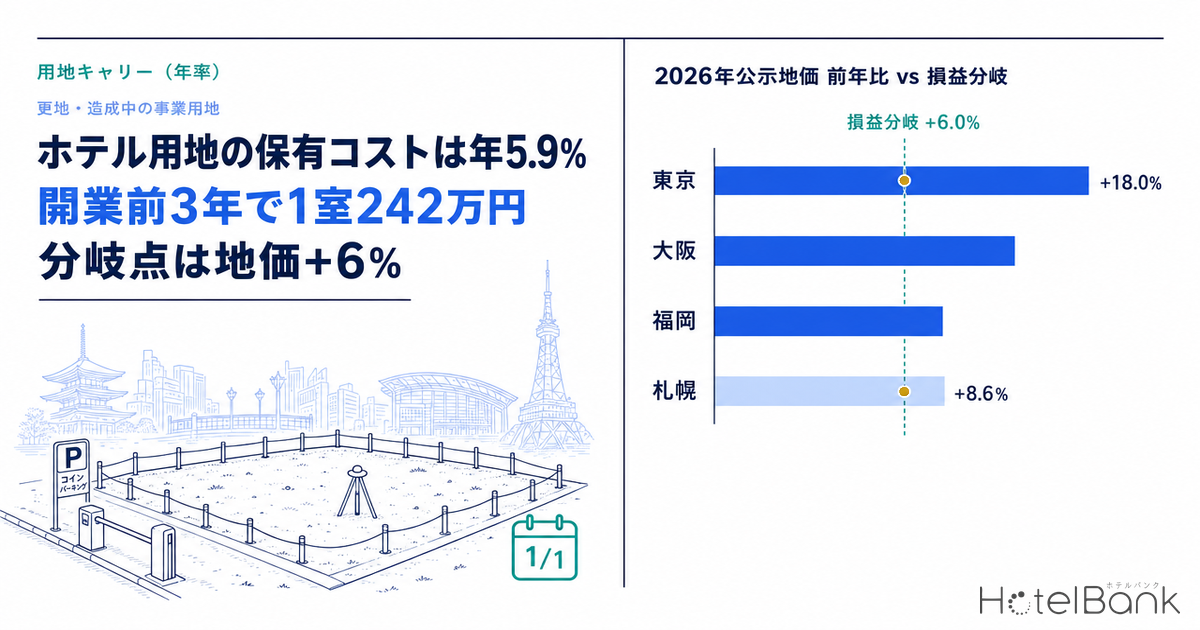
The cost most easily overlooked at a hotel development investment committee is what the land keeps consuming during the “no-income period” between site acquisition and opening. Land is not depreciated and produces no revenue, yet fixed asset tax, city planning tax and the cost of capital arrive in full every single year. This article breaks down this pre-opening land holding cost (carry) into an annual rate, using actual data from 243 commercial-land standard sites in Tokyo, Osaka, Fukuoka and Sapporo, and takes it all the way to a break-even: how many percent per year land prices must rise for the carry to be offset.
First, how this piece differs from earlier coverage. Our article on 2026 official land prices and hotel development feasibility dealt with the ceiling on acquisition price — how much you can afford to pay for a site — and our article on hotel fixed asset tax (¥160,000–¥240,000 per room per year) dealt with holding taxes on operating hotels. The subject here is how much is added each year between paying for the land and opening the hotel, and the one axis of differentiation is that the object is vacant or under-development business land. Before and after a building stands, both the applicable tax relief and the taxable object are entirely different.
Metric Definitions Used in This Article
- Carry (land holding cost): The total of costs incurred each year while holding vacant or under-development business land. In this article it is defined as “holding taxes (fixed asset tax + city planning tax) + cost of capital (loan interest + opportunity cost of equity) + land maintenance cost”, expressed as an annual rate (%) of the official land price.
- ADR (Average Daily Rate): An estimated settled rate (tax-exclusive equivalent) calculated by applying a segment-specific adjustment factor to the lowest-plan price level each property publishes on OTAs (double occupancy, per-room rate, tax-inclusive). Checked against property-level results disclosed by listed hotel REITs (91 properties, most recent 3 months), the median error is about 7%. These are estimates and differ from each property’s actual settled prices and accounting figures. Area-level ADR is the median of the properties covered (the level of a typical property in the area).
- Official land price: The standard-site price in the 2026 Land Price Publication (valuation date 1 January 2026). The sites aggregated here are commercial-land standard sites in locations where limited-service hotels in each city tend to be built.
- Data sources: Ministry of Land, Infrastructure, Transport and Tourism (MLIT) Real Estate Information Library (Land Price Publication); Ministry of Internal Affairs and Communications (fixed asset tax system); MetroEngines Research & Consulting
- — 5.9–6.0% per year — In limited-service hotel locations in Tokyo, Osaka, Fukuoka and Sapporo, the pre-opening land holding cost (carry) converges on almost the same annual rate relative to the official land price (commercial-land standard sites, N=243).
- — 85% of it is cost of capital — Holding taxes are only 0.833% (70% assessment × 70% tax base × 1.7% tax rate); loan interest of 1.89% and the 3.20% opportunity cost of equity make up the bulk.
- — Break-even is land price growth of +6.0% a year — Median year-on-year changes in the 2026 publication were +18.0% in Tokyo, +15.8% in Osaka, +9.6% in Fukuoka and +8.6% in Sapporo, so over the latest year all four markets cleared the break-even.
- — ¥1.35M–¥3.17M per room over 3 years — Fukuoka is heaviest not because of land prices but because of the floor area ratio (FAR). At a designated FAR of 500%, the site area needed per room is 8.06㎡, 17% more than the 6.72㎡ at 600%.
- — The levers that work are time and FAR — Measured median construction-start-to-completion periods are 1.74 years for standalone hotels and 3.87 years for mixed-use projects (N=39). Mixed-use gains on FAR and pays in time.
Conclusion — Land generates cost at 6% a year, and the decision turns on whether land price growth outpaces it
The conclusion first. On 2026 interest rates, tax rates and land price levels, the carry on urban hotel land is 5.9–6.0% per year. The breakdown is holding taxes of 0.83%, loan interest of 1.89% (LTV 60%, rate 3.15%), an opportunity cost of equity of 3.20% (40% equity, 8% required return), and land maintenance costs of 0.05–0.10% depending on land price levels. The figures line up across the four markets because most of the carry is cost of capital, which is proportional to the land price.
This is not a story that “holding land is dangerous”. It is a story that once the cost of time is quantified at 6% a year, you can choose when to acquire on comparable numbers. In the 2026 Land Price Publication, the all-use average rose +2.8% year on year and commercial land +4.3% — the largest increases since 1992, after the bubble burst (MLIT). Limited to the limited-service hotel locations in the four markets aggregated here, the median year-on-year change for commercial-land standard sites was +18.0% in Tokyo (N=110), +15.8% in Osaka (N=72), +9.6% in Fukuoka (N=35) and +8.6% in Sapporo (N=26), all above the 6% break-even. Past-year land price movements cannot simply be extended into the future, but at least over the latest year, the carry was paid for by rising land values.
Put the other way, the decision is not “whether to hold land” but reduces to two questions: is this a trade area where land price growth above 6% a year will continue, and if not, in how many years can the project be brought to construction start? The rest of this article builds up the institutional framework, carry amounts by market, measured holding periods and sensitivities, in that order.
The institutional framework — taxes that hit vacant land, and relief that does not apply to it
Start by pinning down the tax system precisely. Fixed asset tax has a standard rate of 1.4% and city planning tax a maximum rate of 0.3%; Tokyo’s 23 wards, Osaka City, Fukuoka City and Sapporo City all levy city planning tax at 0.3%. City planning tax is a municipal tax levied only on land and buildings within urbanization promotion areas, and is not levied on sites in urbanization control areas.
The key point is that the tax base is not the assessed value itself. The assessed value for fixed asset tax is set with roughly 70% of the official land price as a guideline. On top of that, a burden adjustment measure applies to commercial and similar land, capping the tax base at 70% of assessed value (if the previous year’s tax base is lower, that is used instead, and if the burden level is within the 60–70% range, it is held at the previous year’s amount). So for urban business land whose burden level has reached the cap, the effective annual holding tax rate relative to the official land price stacks up as follows.
| Item | Factor / tax rate | Basis |
|---|---|---|
| Official land price | 100% | 2026 Land Price Publication (valuation date 1 January 2026) |
| × Fixed asset tax assessed value | 70% | Set with roughly 70% of the official land price as a guideline |
| × Tax base (commercial and similar land) | 70% | Burden adjustment measure; tax base capped at 70% of assessed value |
| × Tax rate (fixed asset tax + city planning tax) | 1.4% + 0.3% | Standard rate / maximum rate; all four cities levy 0.3% |
| = Effective holding tax rate vs official land price | 0.833% / yr | 0.70 × 0.70 × 1.7% |
Next, it is worth stating explicitly the relief that does not apply to vacant land. The residential land special provision (which reduces the tax base to 1/6 of assessed value for small residential land and 1/3 for general residential land) applies to land with a dwelling standing on it as of the 1 January assessment date. It does not apply to business land or vacant land. So if you acquire land that had a house on it and demolish it, the relief falls away from the following assessment date, and the tax on the land can in principle jump by up to six times. In practice the burden adjustment measure means it will not necessarily be six times in a single year, but the direction is certainly up. This is where the point comes from that placing demolition before or after 1 January changes a full year’s tax bill.
The other element is the time structure on the building side. Because fixed asset tax is levied on the state of things as of the assessment date (1 January each year), a building under construction that is not complete at that point is not subject to fixed asset tax on the building. In other words, during construction, tax continues to accrue only on the land. Taxation of the building begins from the fiscal year after completion, which is roughly synchronized with opening — that is, with revenue starting. The asymmetry that only land tax bites during the no-income period is the essence of carry.
| Phase | Tax on land | Tax on building | Revenue |
|---|---|---|---|
| Site acquisition to demolition (dwelling still standing) | Residential land relief applies (1/6–1/3) | Levied on existing building | None (or residual income from former use) |
| After demolition, through construction start and the construction period | No relief; full rate as commercial land | None (not yet complete) | None |
| Fiscal year after completion, through post-opening | No relief; full rate as commercial land | Levy on building begins | Yes |
Carry amounts in four markets — Tokyo ¥112,900 per ㎡ per year, Sapporo ¥62,900 per ㎡ per year
From the MLIT Real Estate Information Library, we extracted commercial-land standard sites in locations where limited-service hotels tend to be built in each market: around Ueno, Asakusa, Kinshicho and Ikebukuro in Tokyo (N=110); around Namba, Nipponbashi and Honmachi in Osaka (N=72); around Hakata Station, Nakasu and Tenjin in Fukuoka (N=35); and around Susukino, Odori and Sapporo Station in Sapporo (N=26) — 243 sites in total. Ultra-high-price areas such as central Tokyo’s three wards (Chiyoda, Chuo and Minato) are rarely targets for limited-service hotel site acquisition, so the sample is deliberately weighted toward where hotels are actually located.
| Market (standard sites N) | Median official land price | Holding taxes | Loan interest | Opportunity cost of equity | Maintenance | Total (¥/㎡/yr) | Annual rate |
|---|---|---|---|---|---|---|---|
| Tokyo: Ueno / Asakusa / Kinshicho / Ikebukuro (N=110) | ¥1,890,000 | ¥15,744 | ¥35,721 | ¥60,480 | ¥1,000 | ¥112,945 | 5.98% |
| Osaka: Namba / Nipponbashi / Honmachi (N=72) | ¥1,955,000 | ¥16,285 | ¥36,950 | ¥62,560 | ¥1,000 | ¥116,795 | 5.97% |
| Fukuoka: Hakata Station / Nakasu / Tenjin (N=35) | ¥2,070,000 | ¥17,243 | ¥39,123 | ¥66,240 | ¥1,000 | ¥123,606 | 5.97% |
| Sapporo: Susukino / Odori / Sapporo Station (N=26) | ¥1,045,000 | ¥8,705 | ¥19,750 | ¥33,440 | ¥1,000 | ¥62,895 | 6.02% |
The annual rate is nearly identical across the four markets because 85% of the carry is cost of capital proportional to the land price. Even with different absolute land price levels, the rate converges to the same place. In other words, the intuition that “cheap land is easier to hold” does not hold as a rate. Cheap land only makes the per-㎡ amount smaller; the way time eats into invested capital does not change. The difference emerges on the side examined next: how many ㎡ of land each room needs — that is, the floor area ratio.
It is also worth being explicit about how interest rates work. The long-term prime rate was raised to 3.00% a year in April 2026, the first time in the 3% range in about 29 years since May 1997, and stood at 3.15% as of June 2026. If the borrowing rate rose by 1.0 percentage point, on an LTV 60% assumption the carry would be pushed up by 0.6 points, and the break-even land price growth rate would rise by the same amount. A turn in the rate cycle works in the direction of shortening the land holding period itself — a constraint, but also a discipline that brings construction decisions forward.
| Median official land price | ¥1,890,000/㎡ |
| 1st quartile / 3rd quartile | ¥1,237,500 / ¥3,192,500 |
| Median YoY change | +18.0% |
| YoY 1st / 3rd quartile | +15.1% / +19.2% |
| Median designated FAR | 600% |
How many years will you hold it? — Measured median from construction start to completion is 2.08 years, 3.87 years for mixed-use
Since total carry is determined by “annual rate × years held”, how the holding period is set drives the conclusion. Measuring the projects in the construction plan data we track where both the construction start date and scheduled completion date can be confirmed (N=39), the period from construction start to completion was a median of 2.08 years and a mean of 3.02 years. Hotel-only projects (N=19) had a median of 1.74 years and a mean of 2.25 years, while mixed-use projects including a hotel (N=20) had a median of 3.87 years and a mean of 3.75 years — more than double. The same structure reappears with an updated population as in our earlier measurement of hotel construction periods, which showed a mean of 2.80 years (1.96 years standalone, 4.00 years mixed-use).
Among actual projects there are some exceptionally long cases. A 300-room project in Nodayamachi, Kita Ward, Okayama City (mixed residential, hotel and retail) started construction in April 2021 with completion scheduled for December 2028 — 7.75 years. A 197-room project in Nihonbashi 1-chome, Chuo Ward, Tokyo (mixed retail, office, hotel and apartments) likewise reaches 7.75 years, from a January 2020 start to a scheduled October 2027 completion. Mixed-use projects involving urban redevelopment schemes tend to have long construction periods because of rights conversion and phased construction of facility buildings. On the other hand, a 300-room project in Ikegamicho, Utsunomiya City is proceeding at close to a standalone-use pace, with a start in April 2026 and scheduled completion in October 2028 — 2.5 years. For the same 300 rooms, differences in project scheme move the holding period by a factor of three.
Furthermore, carry starts accruing not on the construction start date but on the site acquisition date. The preparatory period before construction starts piles up procedures: neighbour briefings under ordinances on mid- and high-rise buildings, building confirmation applications, trial and full excavations for buried cultural properties, and soil contamination surveys. For buried cultural properties, measured data show that excavation surveys are ordered for 8.2% of notifications. For soil contamination, against 12,507 notifications there are 661 area designations a year, so conditions under which surveys and countermeasures halt construction start genuinely exist. Factoring these in, it is realistic to allow 1.0–1.5 years of preparation for standalone use and more than 1.5 years for mixed-use redevelopment.
| Phase | Standalone hotel | Mixed-use / redevelopment | Main rate-limiting factors |
|---|---|---|---|
| Site acquisition to construction start (preparation) | 1.0–1.5 yrs | 1.5 yrs+ | Neighbour briefings, confirmation application, buried cultural properties, soil contamination |
| Construction start to completion (measured median) | 1.74 yrs | 3.87 yrs | Structure and scale, phased construction, rights conversion |
| Completion to opening | 0.2–0.5 yrs | 0.3–0.5 yrs | Inspections, FF&E installation, hiring and training |
| Total (no-income land holding period) | approx. 3 yrs | approx. 5–6 yrs | Base period for this article’s sensitivity analysis |
The cost of time per room — ¥1.35M–¥3.17M over 3 years, with FAR deciding how hard it bites
Let’s convert to a unit that investment committees can compare easily. Assuming a limited-service hotel with 25㎡ rooms and a guestroom share of 62%, gross floor area per room is 40.3㎡. Dividing this by the designated FAR gives the site area needed per room: 6.72㎡ per room at 600%, and 8.06㎡ per room at 500%.
| Market | Median designated FAR | Site area / room | Land cost / room | Carry / room / yr | 3-year hold | 5-year hold | vs stabilized GOP |
|---|---|---|---|---|---|---|---|
| Tokyo | 600% | 6.72㎡ | ¥12,701,600 | ¥759,000 | ¥2,417,700 | ¥4,280,000 | 39.0% |
| Osaka | 600% | 6.72㎡ | ¥13,138,400 | ¥784,900 | ¥2,496,400 | ¥4,418,900 | 57.0% |
| Fukuoka | 500% | 8.06㎡ | ¥16,693,500 | ¥996,800 | ¥3,171,900 | ¥5,614,600 | 66.5% |
| Sapporo | 600% | 6.72㎡ | ¥7,022,800 | ¥422,700 | ¥1,346,200 | ¥2,384,200 | 34.6% |
Only here do the markets diverge. In Tokyo, land carry is ¥759,000 per room per year, equivalent to 39.0% of one year of stabilized GOP. Sapporo is ¥422,700 a year, or 34.6%. Fukuoka, however, reaches ¥996,800 a year, or 66.5%. Fukuoka comes out heavy not because its land is expensive, but because the median designated FAR of the limited-service hotel locations extracted is 500%, lower than the other three markets, so each room needs more land. The gap between Fukuoka’s median land price (¥2,070,000/㎡) and Tokyo’s (¥1,890,000/㎡) is just under 10%, but the FAR difference widens land cost per room by more than 30%.
The action that follows is clear. In trade areas with relatively low FAR, such as Fukuoka, choosing plots with a higher FAR, or stacking floor area through mixed use, is the most efficient way to compress the cost of time. Securing a 600% FAR plot shrinks site area per room by 17%, from 8.06㎡ to 6.72㎡, and lightens carry by the same proportion. Negotiating one FAR tier higher at the site selection stage is as effective as, or more effective than, negotiating a 0.5-point cut in interest rates. Conversely, in zones with strict FAR and building coverage limits — such as scenic districts where coverage is capped at 20% — land cost per room can swell several-fold.
Break-even — if land prices rise 6.0% a year, carry is offset
Carry is a certain cost, while land price growth is an uncertain expectation. Because they differ in nature, they cannot simply be netted off, but as a yardstick for decisions the most usable measure is the break-even: what annual land price growth would bring carry to zero. For all four markets it is 5.97–6.02% a year — 6.0% a year when rounded.
On actual 2026 publication figures, all four markets cleared the break-even. Tokyo’s median year-on-year change of +18.0% exceeded its 5.98% carry by 12.0 points; Osaka at +15.8% by 9.8 points; Fukuoka at +9.6% by 3.6 points; and Sapporo at +8.6% by 2.6 points. Given that the national commercial land average was +4.3%, the limited-service hotel locations in these four markets clearly moved well above the national average. Limited to the latest year, holding land was a gain rather than a cost.
However, this result must not be mechanically extended into the future. Land price growth is an unrealized gain until it is realized, while cash only flows out. From the perspective of the lender funding the site acquisition, the source of repayment is not land price growth but post-opening NOI. So in practice, the sound design is to first confirm that the project can withstand a “conservative case” with zero land price growth, and to evaluate land price growth separately as upside. The sensitivity matrix below shows both on a single page.
| Holding period \ annual land price growth | 0% | +2% | +4% | +6% | +8% |
|---|---|---|---|---|---|
| 2 years (short, fast-tracked standalone) | +12.3% | +8.3% | +4.2% | −0.0% | −4.3% |
| 3 years (standard standalone case) | +19.0% | +12.9% | +6.5% | −0.1% | −7.0% |
| 5 years (mixed-use / redevelopment case) | +33.7% | +23.3% | +12.0% | −0.2% | −13.3% |
Here is how to read it. Hold for 3 years with flat land prices (0%) and 19.0% of the land cost disappears as net cost. Applied to Tokyo’s land cost of ¥12,701,600 per room, that is ¥2,417,700 per room, or about ¥240M for 100 rooms. That is not a scale that can be absorbed as estimating error in total project cost; it is a figure that should be set up from the start as a separate cost line in the business plan. As a point of comparison, construction cost per room measured across 31 planned projects is ¥20.67M, so three years of carry is on the order of about 10% of construction cost. Conversely, if land prices rise 4% a year, the same 3 years shrinks to 6.5%, and above 6% a year the sign flips.
The 5-year mixed-use / redevelopment case has a large impact. With flat land prices 33.7% disappears, and even with 2% annual growth 23.3% is lost. Mixed-use projects can stack floor area and compress site area per room, but doubling the holding period sends the cost of time soaring. The benefit of mixed use is gained in FAR, but the cost is paid in time — reflecting this structure correctly in the IRR is the biggest issue in underwriting mixed-use projects.
Arranged in a form an investment committee can work with, the choice of three variables — holding period, land price growth and interest rate — yields the following three scenarios. The sound design is to take the middle case as the base, first confirm the pessimistic case can be withstood, and evaluate the optimistic case separately as upside.
| Scenario | Holding period | Annual carry | Annual land price growth | Cumulative net carry (vs land cost) | Tokyo, per room | 100 rooms |
|---|---|---|---|---|---|---|
| Pessimistic (mixed-use / redevelopment; rates +1.0pt; flat land prices) | 5 yrs | 6.58% | 0% | +37.5% | ¥4,766,200 | approx. ¥477M |
| Middle (standard standalone case) | 3 yrs | 5.98% | +2% | +12.9% | ¥1,640,200 | approx. ¥164M |
| Optimistic (shortened preparation; land prices rise at break-even pace) | 2 yrs | 5.98% | +6% | −0.0% | effectively ±0 | effectively ±0 |
The gap between the pessimistic and middle cases is ¥3,126,000 per room, or about ¥310M for 100 rooms. The practical implication is that this spread is driven not by the land price call but by two manageable variables — holding period and interest rate. Rather than betting on land price growth, eliminating the rate-limiting factors of the preparatory period before acquisition and cutting a year off the holding period is the higher-certainty return.
Partial recovery through interim use — rent equal to 1% of land value brings carry down to 4.98%
One option is to put vacant land to interim use during the preparatory period — as coin-operated parking, for example — and partially recover carry through ground rent. Rent levels depend heavily on time-of-day demand at the location, and are said to deviate from market rates in locations with thin monthly-contract demand or plots with poor visibility. Rather than assume a specific rent level, we show sensitivity using annual ground rent as a percentage of land value as the parameter.
| Interim-use rent level (vs land value) | Effective carry (annual rate) | 3-year cumulative (vs land cost) | Tokyo, per room, 3 years |
|---|---|---|---|
| No interim use | 5.98% | 19.0% | ¥2,417,700 |
| Equivalent to 0.5% a year | 5.48% | 17.4% | ¥2,204,700 |
| Equivalent to 1.0% a year | 4.98% | 15.7% | ¥1,993,700 |
| Equivalent to 2.0% a year | 3.98% | 12.4% | ¥1,577,700 |
If rent equivalent to 1.0% a year can be obtained, 3-year cumulative carry shrinks from 19.0% to 15.7%, or ¥424,000 per room — about ¥42.4M recovered for 100 rooms. Interim use comes with two caveats, however. First, the residential land special provision does not apply even to business land used for parking, so holding taxes do not change with or without interim use. Second, structures such as paving, pay stations and signage may be taxable as depreciable assets, so whether the burden falls on you depends on whether the operator installs the equipment under a master-lease arrangement or you install it yourself. Recovery efficiency rises or falls depending on how the contract is structured.
Another lever that works in practice is designing demolition timing. If you acquire land with an existing dwelling on it, the residential land special provision is determined by the state of things on 1 January, the assessment date. Demolishing right after 1 January keeps the relief for that fiscal year, with full taxation starting the following fiscal year. For projects with slack in the construction schedule, this single point can compress a year’s worth of land tax. Demolition itself also carries a cost, and rebuilding an existing non-conforming building can mean losing floor area to today’s FAR limits — both should be priced into the plan alongside carry.
Applying it to investment decisions — three checkpoints
01 Book 6% a year as a separate cost
Land carry is not an error margin in total project cost but a separate cost line. With flat land prices and a 3-year hold it is 19.0% of land cost — about ¥240M for a 100-room Tokyo project. Rather than placing it as a lump sum in the acquisition year of the IRR model, spreading it across each year to opening makes the sensitivity to construction delays work correctly.
02 Cut site area per room with FAR
Because the annual carry rate converges on about 6% regardless of market, what you can compress is the denominator — site area per room. Taking FAR from 500% to 600% shrinks site area by 17% and lightens carry by the same proportion. FAR negotiation at site selection has more impact than a 0.5-point improvement in interest rates.
03 Shortening the timeline is the most effective lever
The measured median is 1.74 years for standalone use versus 3.87 years for mixed use. Mixed use gains on FAR and pays in time. If the rate-limiting factors of the preparatory period (buried cultural properties, soil contamination, neighbour briefings) can be brought forward into pre-acquisition due diligence, that translates directly into lower cumulative carry.
Finally, the limitations of this analysis. First, holding taxes here assume “commercial and similar land whose burden level has reached the cap”; for land with a lower previous-year tax base, the effective rate is lower. Second, cost of capital moves significantly with capital structure and required return: with full debt financing it is 3.15% a year, and the higher the equity ratio, the heavier carry looks. Third, the year-on-year changes in the 2026 publication are actuals as of the 1 January 2026 valuation date and do not guarantee future land prices. Even so, fixing the cost of time as a single number — 6% a year — makes it possible to compare “when to acquire” and “in how many years to reach construction start” quantitatively — that is the practical conclusion of this article.
⚠ Note on estimates: The figures in this article are simplified estimates based on public data and explicitly stated assumptions. Actual investment decisions require a detailed feasibility study reflecting individual tax statements (the fixed asset tax ledger), lenders’ credit terms and the project scheme. Tax amounts vary with burden levels and reduction/exemption schemes for each municipality and parcel. In addition, scheduled completion years in the construction plan data are based on confirmation applications at the time of the survey; the number of projects and rooms is expected to increase as further applications are filed, so please treat them as a lower bound on the currently confirmed pipeline.
Related Reading
- Hotel Build Times: 2.80-Year Median, 1.96 Solo vs 4.00 Mixed-Use
- Policy Rate 1.00%: Break-Even ADR Across Japan’s 8 Hotel Markets
- Hotel Acquisition Costs 7.1%: A 6.5% Gross Yield Becomes 4.65% Net
References and Sources
■ Data sources
243 commercial-land standard sites (Tokyo 110 / Osaka 72 / Fukuoka 35 / Sapporo 26) from the 2026 Land Price Publication (MLIT Real Estate Information Library, valuation date 1 January 2026). Designated FAR from the zoning data in the same library. Construction-start-to-completion periods from the 39 projects (19 standalone, 20 mixed-use) in the construction plans we track where both construction start date and scheduled completion date can be confirmed. Estimated settled ADR is MetroEngines Research & Consulting’s business hotel figure by prefecture, trailing 12-month average (Tokyo N=914 / Osaka N=497 / Fukuoka N=338 / Hokkaido N=430). Occupancy is the business hotel figure of 75.3% from the Japan Tourism Agency “Accommodation Survey”, 2025 annual final figures. Tax rates and burden adjustment measures from Ministry of Internal Affairs and Communications publications; long-term prime rate from Bank of Japan published figures (3.15% as of June 2026).
■ Estimation assumptions
Fixed asset tax assessed value = official land price × 70%; tax base for commercial and similar land = assessed value × 70%; tax rate 1.7% (1.4% fixed asset tax + 0.3% city planning tax). Financing at LTV 60% with a borrowing rate of 3.15%, and 40% equity with an 8.0% required return. Land maintenance cost fixed at ¥1,000/㎡/yr, assuming hoarding, weeding and security. Rooms of 25㎡ with a guestroom share of 62% (gross floor area of 40.3㎡ per room), divided by designated FAR to derive site area per room. Cumulative carry is compounded to reflect capitalization of construction-period interest; cumulative net carry = (1 + annual carry)^n − (1 + land price growth)^n. A GOP margin of 50% is applied.
■ Limitations and caveats
Holding taxes assume commercial and similar land whose burden level has reached the cap; for land with a lower previous-year tax base the effective rate is lower. Cost of capital depends heavily on capital structure and required return: with full debt financing it is 3.15% a year, and the higher the equity ratio, the heavier carry appears. Year-on-year changes in the 2026 publication are actuals as of the 1 January 2026 valuation date and do not guarantee future land prices. Standard sites were deliberately extracted from commercial land in locations where limited-service hotels tend to be built, and exclude ultra-high-price areas such as central Tokyo’s three wards. Scheduled completion years in the construction plan data are based on confirmation applications; the number of projects and rooms is expected to increase with further applications, so treat them as a lower bound on the currently confirmed pipeline. Decisions on individual projects require case-specific review based on the fixed asset tax ledger, credit terms and project scheme.
■ Market data
- MetroEngines Research & Consulting — Estimated settled ADR (business hotels, by prefecture, trailing 12 months); measured construction-start-to-completion periods from construction plan data (N=39)
■ Government statistics and public data
- MLIT Real Estate Information Library — Land Price Publication (2026, valuation date 1 January 2026), zoning and designated FAR
- Ministry of Internal Affairs and Communications, “Overview of Fixed Asset Tax” (tax rates, assessment, residential land special provision)
- Ministry of Internal Affairs and Communications, Local Tax Bureau, Fixed Asset Tax Division, “On the Burden Adjustment Measures” (22 May 2025)
- Japan Tourism Agency, “Accommodation Survey” — business hotel occupancy of 75.3% (January–December 2025, full year, JTA final figures for business hotels)
- MLIT, “Building Construction Dynamics Statistics Survey” (construction plan data)
- Bank of Japan, “Long-Term and Short-Term Prime Lending Rates (Major Banks)”
■ News and references
- “April long-term prime rate raised to 3%, highest in 29 years — Mizuho Bank” (Jiji Press, 9 April 2026, in Japanese)
- “Reading the 2026 Land Price Publication: the biggest rise since the bubble era, and deepening polarization” (LIFULL HOME’S PRESS, in Japanese)
- “2026 Official Land Prices — Tokyo residential and commercial land up for a fifth straight year” (PLAZA HOMES)