

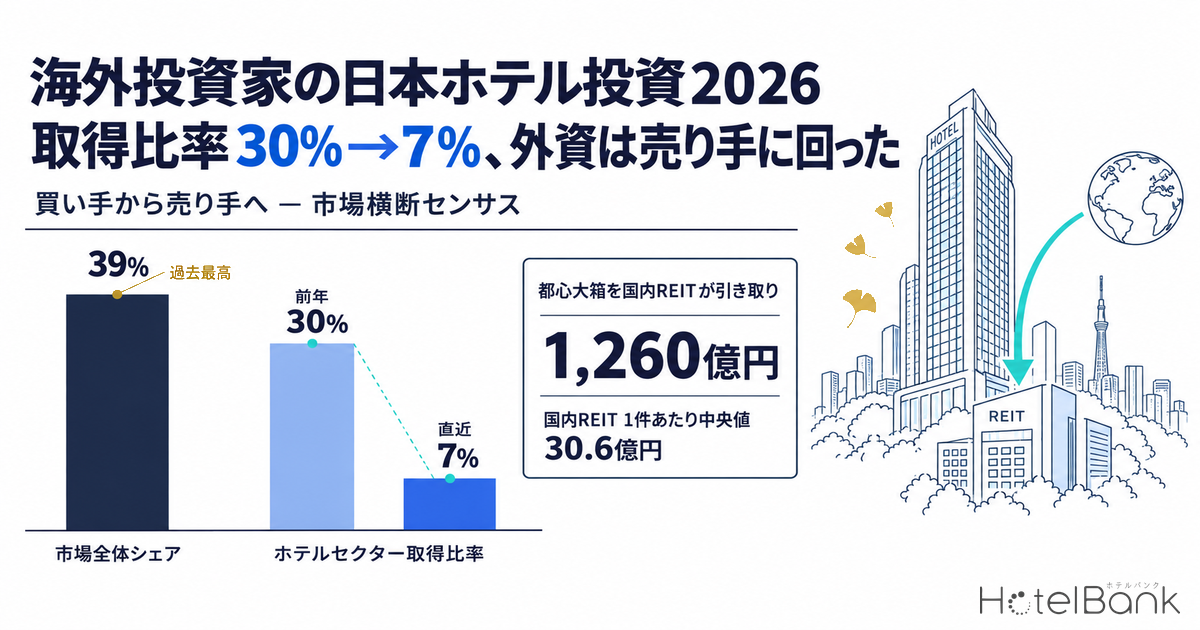
Foreign investment in Japanese hotels changed roles between 2025 and the first half of 2026. Total transaction volume sits near record highs, yet within the hotel sector specifically, overseas capital has shrunk as a buyer and become conspicuous as a seller, handing assets assembled around 2023 to domestic buyers. Rather than profiling individual players, this article stays with a market-wide census and confirms the shift in numbers.
How this article fits with our earlier coverage
Analysis at the level of individual players is covered in earlier articles — our work on GIC’s Japan hotel strategy, on Blackstone’s ¥2.4 trillion Japanese real estate programme and its hotel allocation, and on how foreign private-equity value-add strategies allocate to hotels. Building on those, this article lines buyers up by nationality, vehicle and ticket size, and overlays that on the distribution of actual domestic REIT acquisitions.
Metric definitions used in this article
- Acquisition price: the price disclosed by the investment corporation or the buyer (in millions of yen, excluding consumption tax). Deals with no disclosure are marked “not disclosed”; no estimate is asserted as fact. Figures that come from press reports are labelled as such.
- Acquisition price per room: acquisition price ÷ room count. For partial-building acquisitions or deals involving mixed-use assets, the hotel portion cannot be separated out, so the figure is a reference value.
- Foreign investor: nationality is stated on the basis of where the manager or fund is headquartered. Even where an acquisition runs through a Japanese entity, it is classified by the location of the ultimate managing entity. The definition and the underlying population differ by compiler (CBRE, JLL and others).
- Ownership master database: our database of properties held by the seven hotel-focused J-REITs. N=302 properties, of which 300 are domestic (52,337 rooms) after excluding two overseas properties; snapshot as of September 7, 2026.
- Data sources: MetroEngines Research & Consulting / investment corporation IR disclosures / CBRE / JLL
- — Foreign investors took a record 39% share of the market as a whole (JLL, 2025). Within the hotel sector alone, however, the foreign share of acquisitions fell from 30% in 2024 to 7% in 2025.
- — The falling share is not an exit. What pushed Q1 2026 hotel investment volume to a record was a domestic REIT paying ¥126.0bn for a large central-Tokyo asset that foreign capital had acquired in 2023.
- — The largest tickets come from domestic listed REITs. Across the 13 disclosed deals inventoried here, Singaporean buyers kept picking up small and mid-sized assets of several billion up to ¥30.0bn each, while the large deals went to domestic REITs.
- — The standard domestic REIT ticket is in the ¥3bn range. Across the 300 domestic properties held by the seven hotel-focused investment corporations (as of September 7, 2026), the median acquisition price per deal is ¥3.06bn; 41 deals (13.7%) are ¥10.0bn or more and only three (1.0%) are ¥50.0bn or more.
- — Exit implication: below ¥10.0bn the buyer pool is deep (86.3%). Above ¥50.0bn the asset becomes a timing product governed by appetite for a follow-on equity offering, with only three precedents on record.
Market size — in a ¥2tn quarterly investment market, only the hotel foreign share fell
Start with the overall picture. According to CBRE’s Japan Investment MarketView, commercial real estate investment in Q1 2026 came to ¥2,043.0bn, up 2% year on year — a record for a first quarter. Acquisitions of ¥100.0bn or more by foreign investors continued to appear, and acquisition volume from J-REITs and domestic investors held firm. By asset type, residential, logistics and hotels each posted double-digit growth year on year, and hotels set a quarterly record, helped by the largest J-REIT hotel acquisition to date.
In Q2 2026 volume was ¥1,121.0bn, up 17% year on year and the first second quarter to exceed ¥1tn since the financial crisis. By sector, however, offices and logistics posted double-digit growth while residential, retail and hotels turned negative year on year. Expected NOI yields on prime Tokyo assets hit new lows for both offices and hotels. Hotel figures swing sharply from quarter to quarter because, as set out below, the quarterly total is decided by whether or not a single large-ticket deal happens to close.
What stands out is that the market as a whole and the hotel sector move in opposite directions on foreign share. On JLL’s numbers, foreign investors accounted for 39% of Japan’s real estate investment market in 2025 — a record, above the 34% of 2007. Yet on the same JLL compilation, the foreign share of investment in the hotel sector fell from 30% in 2024 to 7% in 2025. Foreign capital took a record share of the overall market while stepping back from the buy side in hotels alone.
Source: compiled by MetroEngines Research & Consulting from JLL, “Review of and Outlook for the Japan Real Estate Investment Market”
That 7% figure does look different depending on who compiles it. Whether hotels inside mixed-use buildings are counted in the hotel sector, and whether the basis is value or deal count, moves the ratio considerably. Another market tracker in fact concludes that foreign investors accounted for more than half of hotel transactions in the first half of 2025, and the inventory below identifies several foreign-buyer deals. The reality is closer to “no foreign acquisition large enough on its own to move a quarterly total has come through” than to “foreign money has disappeared from hotels”.
Japan’s standing within Asia Pacific has not wavered. JLL puts Asia Pacific hotel investment in the first half of 2025 at US$4.7bn, with Japan at US$1.5bn — first in the region and roughly twice second-placed Greater China (US$744mn); the top five markets accounted for 84% of the region. For 2026, JLL expects Japan to account for 35–40% of Asia Pacific hotel investment.
Source: compiled by MetroEngines Research & Consulting from JLL data (first half of 2025)
Deal inventory — buyer nationality and vehicle across 13 disclosed transactions
We pulled Japanese hotel acquisitions disclosed between 2025 and the first half of 2026 from company releases, investment corporation timely disclosures and press reports, and put them into one table. For comparison, a large deal disclosed in December 2024 is appended at the end. Deals with no disclosed price are marked “not disclosed”; no estimate is treated as a stated acquisition price.
| Disclosure date | Property | Location type | Rooms | Buyer | Nationality | Acquisition vehicle | Disclosed price |
|---|---|---|---|---|---|---|---|
| Disclosed Feb 2026 (acquired March) | Hyatt Regency Tokyo Shinjuku, Tokyo | Central Tokyo, full-service | 712 | Japan Hotel REIT | Japan | Listed REIT | ¥126.0bn |
| Disclosed Jul 2026 | Limited-service hotel in Shinjuku Shinjuku, Tokyo | Central Tokyo, limited-service | 206 | SC Capital Partners | Singapore | Private fund | Not disclosed |
| Disclosed Mar 2026 | Six properties including five hotels Multiple cities | Urban limited-service and others | — | One REIT | Japan | Listed REIT | Approx. ¥29.9bn |
| 2025 | Grand Nikko Tokyo Daiba Minato, Tokyo | Central Tokyo, full-service | 882 | TPG Angelo Gordon × Kenedix | U.S. × Japan | PE fund JV | ¥106.0bn |
| 2025 | Bespoke Hotel Shinsaibashi Osaka City, Osaka | Tourist city, limited-service | 256 | Blackstone | U.S. | PE fund | ¥14.0bn |
| H1 2025 | Hotel Gajoen Tokyo (30% interest) Meguro, Tokyo | Central Tokyo, mixed-use | 60 | Brookfield | Canada | Asset manager | Not disclosed (interest in a mixed-use asset) |
| H1 2025 | Hundred Circus East Tower Tokyo | Central Tokyo | 106 | CapitaLand Investment | Singapore | Listed asset manager | ¥30.0bn |
| H1 2025 | Limited-service hotel by Kanazawa Station Kanazawa City, Ishikawa | Regional, limited-service | 392 | CapitaLand Ascott Trust | Singapore | Overseas-listed REIT | ¥5.0bn |
| H1 2025 | Oakwood Suites Yokohama (partial) Yokohama City, Kanagawa | Urban, serviced apartments | 175 | Lone Star | U.S. | PE fund | Not disclosed (reported at approx. ¥60mn per room) |
| 2025 | Hotel Oriental Express Kagoshima Tenmonkan Kagoshima City, Kagoshima | Regional, limited-service | 165 | SC Capital Partners | Singapore | Private fund | Not disclosed |
| 2025 | Hotel Universal Port Vita Osaka City, Osaka | Tourist city, full-service | 428 | ORIX JREIT | Japan | Listed REIT | ¥35.0bn |
| Disclosed Dec 2024 | Tokyo Garden Terrace Kioicho Chiyoda, Tokyo — mixed-use building including a 250-room hotel | Central Tokyo, mixed-use | 250 (hotel portion) | Blackstone | U.S. | PE fund | Approx. ¥400.0bn (entire mixed-use building) |
| Disclosed Dec 2024 | The Ritz-Carlton Okinawa / Kanehide Kise Beach Palace / Nest Hotel Osaka Shinsaibashi | Resort + tourist city | 97 / — / 302 | Blackstone | U.S. | PE fund | Not disclosed |
Source: compiled by MetroEngines Research & Consulting from company press releases, investment corporation timely disclosures and press reports (disclosed basis; not an exhaustive list)
Three structural points come out of this table.
First, the largest tickets come from domestic listed REITs. Japan Hotel REIT Investment Corporation’s acquisition of Hyatt Regency Tokyo (712 rooms), disclosed in February 2026, came to ¥126.0bn — the largest hotel acquisition by a domestic REIT on record. Our ownership master database registers the property as held by Japan Hotel REIT, matching at ¥126,000mn and 712 rooms. Note that the 712 rooms used here follows the timely disclosure for the acquisition, while Hyatt Hotels Japan’s April 2026 press material gives the hotel’s room count as 746. The scope of the acquisition and the way room categories are counted differ, so the room count varies by discloser. The investment corporation raised up to ¥69.5bn through a public offering and ¥65.0bn in bank borrowing to fund the purchase.
Second, the seller was foreign capital. Hyatt Regency Tokyo was acquired from Odakyu Electric Railway in March 2023 by KKR of the U.S. and Hong Kong-based Gaw Capital Partners; the price was not disclosed, though overseas media reported US$409.3mn. Roughly three years later it passed to a domestic REIT. In other words, the deal that pushed Q1 2026 hotel investment to a record came from a foreign sale, not a foreign purchase. A falling foreign share and foreign money withdrawing from Japanese hotels are not the same thing.
Third, Singaporean buyers keep coming in at the small and mid-sized end. SC Capital Partners announced in January 2026 that it had secured up to ¥112.8bn from a Canadian pension fund and other investors, then acquired a 206-room hotel in Shinjuku that July, having earlier taken a 165-room hotel in Kagoshima. CapitaLand entities acquired a 106-room Tokyo asset (¥30.0bn) and a 392-room Kanazawa asset (¥5.0bn). The pattern is a spread of central-Tokyo and regional limited-service assets in the range of several billion to several tens of billions of yen per deal.
Separately, brand and operating-contract activity that involves no acquisition is running in parallel. In 2026 IHG Hotels & Resorts announced a portfolio agreement with GCP Hospitality, the hospitality arm of the Gaw Capital group, covering 14 hotels and 1,063 rooms in Kyoto. Capital moving in and out and brands moving in and out are separate events and need to be kept apart.
Geographic spread — polarised between central-Tokyo full-service and resorts
The inventoried deals whose locations can be identified are plotted on the map below. Circle size shows room count and colour shows buyer nationality. The split is visible at a glance: large full-service assets in central Tokyo (Shinjuku, Daiba, Kioicho) on one side, and small to mid-sized assets in tourist cities, resorts and regional cities such as Osaka, Okinawa, Kagoshima and Yokohama on the other.
Source: company press releases and press reports; MetroEngines Research & Consulting
For reference, breaking the 300 domestic properties in our ownership master database down by location: Tokyo has 53 properties (median acquisition price ¥3.26bn per deal, ¥25.0mn per room), Hokkaido 26 (¥3.03bn, ¥24.5mn), Osaka 16 (¥4.35bn, ¥28.1mn) and Okinawa 10 (¥15.58bn, ¥40.6mn). Okinawa stands out for how large the per-deal price of REIT-held properties is. Resort assets are acquired together with their land and ancillary facilities, so the price is built differently from a central-Tokyo business location. That foreign resort deals such as The Ritz-Carlton Okinawa cluster among the non-disclosed transactions is not unrelated to the peculiarities of this price band.
Ticket size — where foreign bids land in the distribution of 300 REIT properties
From here we use our ownership master database to build the distribution of actual domestic REIT acquisitions. The population is the 300 domestic properties and 52,337 rooms held by the seven hotel-focused investment corporations, with acquisition prices totalling ¥1,804.2bn (two overseas properties excluded; as of September 7, 2026).
The distribution of acquisition price per deal has a median of ¥3.06bn, a first quartile of ¥1.36bn and a third quartile of ¥6.01bn. Forty-one properties (13.7%) are ¥10.0bn or more, 14 (4.7%) are ¥20.0bn or more, and only three (1.0%) are ¥50.0bn or more. The standard REIT ticket is around ¥3bn, which makes any acquisition above ¥10.0bn an exceptional event. How far these acquisition prices sit from current valuations is a separate question, and one we have examined elsewhere by reading the same ownership master database from the appraisal-value side.
Source: MetroEngines Research & Consulting (ownership master database, N=300 domestic properties only, as of September 7, 2026)
Overlaying the inventoried disclosed deals on that distribution shows how wide the gap is. At ¥126.0bn, Hyatt Regency Tokyo alone accounts for 7.0% of the combined acquisition price of all 300 domestic properties held by the seven investment corporations. Blackstone’s Tokyo Garden Terrace Kioicho, at roughly ¥400.0bn for the entire mixed-use building including its 250 hotel rooms, is equivalent to 22% of that same total. Foreign mixed-use deals are a size up even when measured against the entire portfolio of the hotel-focused REITs.
Plotting room count against acquisition price makes the thickness of the REIT mid-band obvious. Of the 300 properties, 109 (36.3%) have 100–200 rooms, and widening the band to 50–200 rooms captures 185 (61.7%). By contrast only 40 (13.3%) have 300 rooms or more, and just eight have 500 or more. REITs are built to stack up mid-sized limited-service assets in the middle of the price range; large full-service assets are thin on the ground. That is the opposite of the disclosed foreign deals, which concentrate on big boxes of 712 and 882 rooms.
Source: MetroEngines Research & Consulting (ownership master database, N=300 domestic properties only); disclosed deals from company releases and press reports
On a per-room basis the gap widens further. Across the 300 domestic properties the median is ¥24.4mn per room, with a first quartile of ¥12.2mn and a third quartile of ¥40.8mn. The disclosed deals, by contrast, come in at ¥177.0mn per room for Hyatt Regency Tokyo, ¥120.2mn for Grand Nikko Tokyo Daiba, ¥54.7mn for Bespoke Hotel Shinsaibashi and roughly ¥60mn for Oakwood Suites Yokohama on a reported basis. Per-room prices on large central-Tokyo deals sit three to four times above the REIT third quartile. We have separately examined how per-room valuation compares between physical assets and REIT acquisition prices.
Source: MetroEngines Research & Consulting (ownership master database, N=300 domestic properties only, as of September 7, 2026)
Differences in character between the investment corporations also show through. The lowest median per-room price belongs to Ichigo Hotel REIT (¥13.8mn per room, N=29), with a median room count of 144 — a design that holds a thick middle band of limited-service assets. At the high end are Mori Trust REIT (¥52.2mn per room, N=6) and Kasumigaseki Hotel REIT (¥45.3mn per room, N=15), but the two are built differently. Mori Trust REIT leans toward large, high-unit-price assets, with a median of ¥18.20bn per deal and a median of 266 rooms, while Kasumigaseki Hotel REIT runs a median of ¥1.74bn per deal and a median of 47 rooms — a small-property, large-room extended-stay profile that lifts the per-room price. A high per-room price means different things depending on whether it comes from a scarce big-box location or from spacious rooms in a small property. We have also recalculated per-room prices by property format rather than by investment corporation.
Exit implications — the buyer pool is limited to the top tenth of tickets
When assets acquired by foreign investors eventually pass to REITs, how large a ticket can the buyer side absorb? Dividing the acquisition track record in the ownership master database by price band gives the following.
| Price band | Deals | Share | Representative examples (acquisition price) |
|---|---|---|---|
| ¥50.0bn or more | 3 | 1.0% | Hyatt Regency Tokyo (¥126.0bn) / Hilton Fukuoka Sea Hawk (¥64.3bn) / Hilton Tokyo Odaiba (¥62.4bn) |
| ¥20.0–50.0bn | 11 | 3.7% | Shangri-La Tokyo (¥49.2bn) / Fusaki Beach Resort Hotel & Villas (¥40.2bn) / OMO7 Osaka (¥29.0bn) / Holiday Inn Osaka Namba (¥27.0bn) and others |
| ¥10.0–20.0bn | 27 | 9.0% | Oriental Hotel Tokyo Bay (¥19.9bn) / Hotel Okura Kobe (¥19.0bn) and others |
| ¥5.0–10.0bn | 53 | 17.7% | — |
| Under ¥5.0bn | 206 | 68.7% | — |
Source: MetroEngines Research & Consulting (ownership master database, N=300 domestic properties only, as of September 7, 2026)
Only three acquisitions reach ¥50.0bn or above — Hyatt Regency Tokyo (¥126.0bn), Hilton Fukuoka Sea Hawk (¥64.3bn) and Hilton Tokyo Odaiba (¥62.4bn) — and all three are held by Japan Hotel REIT Investment Corporation. The ¥20.0–50.0bn band holds Mori Trust REIT’s Shangri-La Tokyo (¥49.2bn), Invincible Investment Corporation’s Fusaki Beach Resort Hotel & Villas (¥40.2bn) and others. What the track record shows is that only a handful of investment corporations — those able to secure equity headroom and debt capacity at the same time — can take on a ¥100bn-class asset.
Japan Hotel REIT Investment Corporation did in fact announce a public offering of roughly ¥69.5bn in February 2026 and applied it to the Hyatt Regency Tokyo acquisition. Against the ¥126.0bn price, that is roughly 55% equity and roughly 52% debt, the two exceeding 100% because the total includes acquisition costs. What sets the size of the buyer pool is not the quality of the asset but the level of the unit price and the market’s appetite for a follow-on offering. For a year-by-year breakdown of J-REIT acquisitions, see Hotel Capital Allocation 2026: One Deal Took 27% of J-REIT Q1 Buying.
Three scenarios for buyer-pool ticket size, by equity-raising environment
Overlaying the funding structure on the track record above breaks down what determines the size of the buyer pool. Taking the structure Japan Hotel REIT Investment Corporation actually used for Hyatt Regency Tokyo (¥126.0bn) — a public offering of roughly ¥69.5bn plus ¥65.0bn of borrowing — as the mid-case reference point, the table below sets out three environments using the simple identity “equity raised ÷ (1 − loan-to-cost) = affordable ticket size”. This is an arithmetic exercise anchored on disclosed funding, not a forecast.
| Scenario | Assumed equity-raising environment | Equity raised | Affordable ticket | Corresponding band in the track record |
|---|---|---|---|---|
| Optimistic | Unit price above net asset value per unit; a public offering can be fully absorbed | Approx. ¥70.0bn | Approx. ¥140.0bn | ¥50.0bn or more (3 deals, 1.0%) |
| Mid | Normal conditions; roughly ¥20.0bn of equity per offering | Approx. ¥20.0bn | Approx. ¥40.0bn | ¥20.0–50.0bn (11 deals, 3.7%) |
| Pessimistic | Unit price depressed and an offering effectively unavailable; reliant on cash on hand and existing debt capacity | ¥5.0–10.0bn | Approx. ¥10.0–20.0bn | ¥10.0–20.0bn (27 deals, 9.0%) and below |
Source: MetroEngines Research & Consulting (ownership master database, N=300 domestic properties only, as of September 7, 2026); funding structure compiled from Japan Hotel REIT Investment Corporation timely disclosures
Sensitivity — equity raised × loan-to-cost
Extending the same identity across two axes shows which combinations reach which band. Darker shading corresponds to thinner bands in the track record, i.e. a narrower buyer pool. Figures are affordable ticket size in ¥ billion, excluding acquisition costs and taxes.
| Equity ╲ Loan-to-cost | 40% | 45% | 50% | 55% | 60% |
|---|---|---|---|---|---|
| ¥10bn | 16.7 | 18.2 | 20.0 | 22.2 | 25.0 |
| ¥20bn | 33.3 | 36.4 | 40.0 | 44.4 | 50.0 |
| ¥40bn | 66.7 | 72.7 | 80.0 | 88.9 | 100.0 |
| ¥70bn | 116.7 | 127.3 | 140.0 | 155.6 | 175.0 |
| ¥100bn | 166.7 | 181.8 | 200.0 | 222.2 | 250.0 |
Colour key: ¥50.0bn or more = 3 deals (1.0%) / ¥20.0–50.0bn = 11 deals (3.7%) / ¥10.0–20.0bn = 27 deals (9.0%) / under ¥10.0bn = 259 deals (86.3%). Deal counts are from the 300 domestic properties held by the seven hotel-focused J-REITs, as of September 7, 2026.
Source: MetroEngines Research & Consulting (ownership master database, N=300 domestic properties only, as of September 7, 2026); figures are an arithmetic estimate based on that data
Three implications follow.
(1) Assets below ¥10.0bn have a wide exit. In the ownership master database, 206 properties (68.7%) are under ¥5.0bn and 53 (17.7%) are ¥5.0–10.0bn — together 86.3% of the total. Singaporean funds picking up small and mid-sized assets on a continuing basis is consistent with the higher liquidity of this band.
(2) Above ¥50.0bn the asset becomes a timing product. With only three precedents, an exit in this band has to coincide with a period in which the unit price can support an offering. As CBRE shows, expected NOI yields on prime Tokyo hotels have hit new lows, so pricing itself favours the seller — but the funding environment on the buyer side can become the bottleneck.
(3) Mixed-use assets take a different route than a REIT exit. Where the hotel is only part of the whole asset — as with a mixed-use building containing 250 hotel rooms — the deal falls outside the investment scope of a hotel-focused REIT. Diversified REITs, operating companies, or foreign investors again become the buyer. In March 2026 One REIT Investment Corporation acquired six properties including five hotels for approximately ¥29.9bn, its first hotel acquisition. The pool of buyers outside the hotel-focused REITs is widening at the same time.
Conclusion — do not read a falling share as an exit
Japan’s hotel investment market from 2025 through the first half of 2026 can be summarised as follows. Across the market as a whole, the foreign investor share reached a record 39% (JLL, 2025), while within the hotel sector the foreign share of acquisitions fell from 30% to 7%. That decline does not mean foreign capital has moved away from Japanese hotels. What produced the record quarterly hotel investment volume in Q1 2026 was a domestic REIT paying ¥126.0bn for a large central-Tokyo asset a foreign fund had bought three years earlier. Foreign investors have shifted from the buy side to the sell side — that is closer to what is actually happening.
The gap in ticket size remains wide. A standard domestic REIT deal runs at an acquisition price in the ¥3bn range, around 140 rooms and a per-room price in the ¥24mn range, while disclosed foreign deals move at over ¥100bn, 800-room scale and per-room prices above ¥170mn. The difference is one of capital character, not quality. Long-horizon pension and sovereign money can concentrate in a single big box, whereas a REIT raising money through investment units has to reconcile diversification with scale. Anyone designing an exit should first check which band of the REIT track record their asset falls into. Below ¥10.0bn the buyer pool is deep; above ¥50.0bn there are only three precedents.
On data scope: the distributions of acquisition price and room count in this article are based on disclosed data from the seven hotel-focused J-REITs (Ichigo Hotel REIT Investment Corporation, Invincible Investment Corporation, Japan Hotel & Residential Investment Corporation, Japan Hotel REIT Investment Corporation, Hoshino Resorts REIT Investment Corporation, Mori Trust REIT Investment Corporation and Kasumigaseki Hotel REIT Investment Corporation). Properties held by diversified REITs, private REITs and operating companies are not included. The inventoried acquisitions are limited to those confirmable from disclosures and press reports and are not an exhaustive list.
Related reading
- GIC’s Japan Hotel Strategy: ¥150B Prince 31-Property Acquisition Decoded
- Hotel Capital Allocation 2026: One Deal Took 27% of J-REIT Q1 Buying
References and sources
■ Data sources
The distributions of acquisition price and room count are based on our ownership master database, which aggregates disclosed data from the seven hotel-focused J-REITs (Ichigo Hotel REIT, Invincible, Japan Hotel & Residential, Japan Hotel REIT, Hoshino Resorts REIT, Mori Trust REIT and Kasumigaseki Hotel REIT). The population is the 300 domestic properties, 52,337 rooms and ¥1,804.2bn of combined acquisition price that remain after excluding two overseas properties from N=302; the snapshot is as of September 7, 2026. Market-wide investment volume and the foreign investor share come from published CBRE and JLL compilations, and individual deals from company press releases, investment corporation timely disclosures and press reports.
■ Estimation assumptions
Acquisition price per room is calculated as acquisition price ÷ room count, and properties with no disclosed room count are excluded from that calculation. The three buyer-pool scenarios and the sensitivity grid use the identity “equity raised ÷ (1 − loan-to-cost) = affordable ticket size”, with the mid case anchored on the actual funding structure Japan Hotel REIT Investment Corporation used for Hyatt Regency Tokyo — a public offering of roughly ¥69.5bn plus ¥65.0bn of borrowing. Acquisition costs, taxes and operating expenses are not taken into account.
■ Limitations and caveats
The inventoried acquisitions are limited to those confirmable from disclosures and press reports and are not an exhaustive list. No estimated figure is assigned to deals whose price was not disclosed. Properties held by diversified REITs, private REITs and operating companies are outside the population, so the buyer pool across the whole market is wider than the distribution shown here. The foreign investor share is defined differently by different compilers, and the level moves with the treatment of hotels inside mixed-use buildings and with a value versus deal-count basis. The estimates in this article are an arithmetic range derived from funding structure, and do not forecast future transaction prices or the likelihood of a deal closing.
■ Market data
- MetroEngines Research & Consulting — J-REIT ownership master database (7 investment corporations, 302 properties, of which 300 domestic and 52,337 rooms; acquisition price, room count and location; as of September 7, 2026)
■ Market research reports
- CBRE, “Japan Investment MarketView Q2 2026”
- CBRE K.K. press release, “Japan Investment MarketView Q2 2026” (2026)
- JLL, “Review of and Outlook for the Japan Real Estate Investment Market”
- Travel Voice, “Japan led Asia Pacific hotel investment at US$1.5bn in H1 2025 (JLL)” (September 2, 2025)
- JLL, “Global hotel investment forecast to keep expanding in 2026” (March 3, 2026)
- Real Estate Asia, “Notable hotel investment transactions in Japan in H1”
■ Investment corporation IR and company releases
- Japan Hotel REIT Investment Corporation, portfolio list
- Kasumigaseki Hotel REIT Investment Corporation, portfolio list
- GIC, “GIC to acquire 31 hotel and leisure assets from Seibu Holdings”
- Hyatt Hotels Japan, press material, April 2026
- Gaw Capital Partners, “KKR and Gaw Capital Acquire Hyatt Regency Tokyo” (March 2023)
- SC Capital Partners, “Acquires Prime Hotel in Central Tokyo” (July 8, 2026)
- Blackstone, “Three further hotels added to the portfolio” (December 19, 2024)
- Blackstone, “Acquisition of Tokyo Garden Terrace Kioicho announced” (December 2024)
- IHG Hotels & Resorts, “IHG signs landmark 14-hotel portfolio deal in Japan” (2026)
■ Press coverage
- Nikkei, “Domestic REIT makes record hotel acquisition: Hyatt Tokyo for ¥126.0bn” (February 25, 2026)
- Nikkei, “KKR of the U.S. acquires Hyatt Regency Tokyo with a Hong Kong fund” (March 2023)
- Bloomberg, “Blackstone acquires the former Akasaka Prince site building from Seibu HD for ¥400bn” (December 12, 2024)
- Mingtiandi, “KKR, Gaw Sold Hyatt Regency Tokyo to JHR”
- Mingtiandi, “SC Capital Buys Central Tokyo Hotel” (July 2026)
- estie, “One REIT Investment Corporation acquires six properties including five hotels for approx. ¥30bn to diversify its portfolio” (March 19, 2026)