

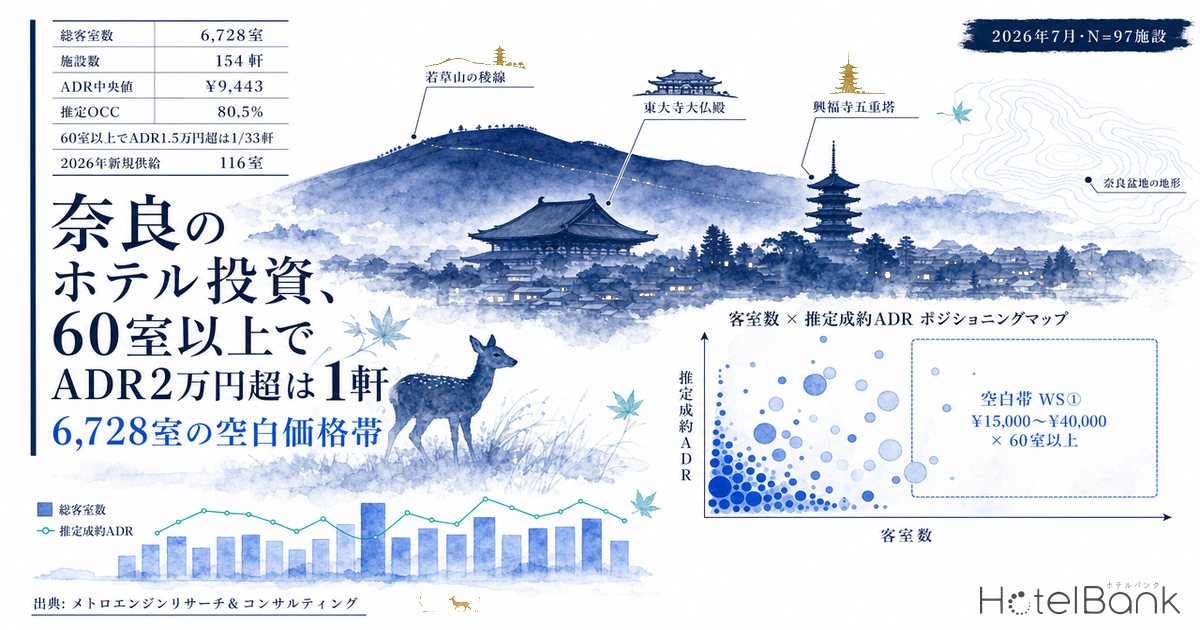
Nara Prefecture has 154 lodging properties with 6,728 rooms listed on OTAs (July 2026). Ranked by prefecture, that is the third-smallest supply in Japan after Tokushima (6,088 rooms) and Saga (6,476 rooms), and just 13% of neighboring Kyoto’s 52,693 rooms. Even so, occupancy in July 2026 (estimated, based on OTA-listed inventory) reached 80.5%, peaking at 96.4% on July 18. Supply is among the smallest in Japan, yet the rooms are filling up. For an investor, that translates into a concrete question: which price bands and which property sizes are missing? This article pinpoints Nara’s price-band whitespace using estimated settled ADR and room counts for 97 properties in the prefecture, sell-through data for the four days of Obon, and the residential and employment structure around four major stations.
Metric Definitions Used in This Article
- ADR (Average Daily Rate) = estimated settled rate (tax-exclusive equivalent), calculated by applying a category-specific adjustment factor to each property’s lowest publicly listed plan on OTAs (per room, 2 guests, tax-inclusive). Checked against property-level results disclosed by listed hotel REITs (91 properties, most recent 3 months), the median error is about 7%. These are estimates and differ from each property’s actual transaction prices and accounting figures. Area-level ADR is the median of the target properties (the level of a typical property in the area).
- Listed price (all-plan average) = the average published price across all plans, from room-only to meal-inclusive (per room, 2 guests, tax-inclusive). Because the basis differs from estimated settled ADR, it is labeled separately in this article.
- OCC (Occupancy) = share of rooms sold out of total rooms in an area (estimated from OTA sales inventory; consistency checks against monthly REIT disclosures show accuracy within a few percentage points). It is based on the sell-through of inventory sold on OTAs and differs from a property’s actual overall occupancy. It is used only at the prefecture and municipality level; occupancy is not calculated for individual properties.
- Room occupancy (Japan Tourism Agency) = actual figures published in the Japan Tourism Agency’s Overnight Travel Statistics Survey. The survey body, population and definition differ from the estimated OCC above, so the two are not compared directly.
- LT (lead time) = days until check-in. LT0 = same day. Early sell-out LT = the lead time at which remaining rooms first reached zero (larger values mean an earlier sell-out). Sold-out days observed = total number of days during the observation period on which zero remaining rooms were confirmed.
- Data sources = MetroEngines Research & Consulting / Japan Tourism Agency, Overnight Travel Statistics Survey / MLIT National Land Numerical Information and Land Price Publication / MIC & METI Economic Census
- — 154 properties, 6,728 rooms. Nara’s OTA-listed inventory ranks 45th in Japan, only 13% of neighboring Kyoto’s 52,693 rooms (July 2026).
- — Estimated OCC of 80.5%. Supply is among Japan’s smallest, yet July was full, reaching 96.4% on July 18 (estimated, based on OTA-listed inventory).
- — Only 1 of 33 properties with 60+ rooms has an estimated settled ADR above ¥15,000. There are zero properties at ¥15,000–¥40,000 with 60+ rooms; this is whitespace WS1 in this article (N=97 properties, 6,695 rooms).
- — Southern ryokan are expensive; northern urban areas are cheap. Tenkawa Village (¥19,700) and Yoshino Town (¥19,300) compare with ¥10,000 in Nara City, the reverse of the usual pattern in which cities lead on rate.
- — A 100-room upper-midscale hotel yields a 5.2% Stage 2 GOP yield. It still holds 4.4% under a downside of ADR -10% and occupancy -5pt (simplified estimate).
How This Differs from Earlier Coverage: The Next Question for a Day-Trip Prefecture
We have already touched on Nara’s lodging structure from a nationwide angle. An earlier HotelBank analysis of day-trip-heavy prefectures in 2025 showed that Nara ranks first in Japan on day-trip dominance, with just 0.35 overnight stays per visit. That analysis, however, compared all 47 prefectures side by side and did not look inside Nara Prefecture: how many properties exist in which municipalities, in which price bands, and at what size.
The closest in method is our Shiga hotel development analysis, where 2026 new supply equals 1.5% of existing rooms, but the prefecture and its demand structure are different. Shiga rests on corporate demand in the Konan area, a market where weekday business occupancy supports pricing. Nara’s demand is mainly tourism centered on World Heritage sites, temples and shrines, and most of it has been consumed as day trips from Kyoto and Osaka. Both are “thin-supply prefectures,” but the reasons for the thinness, and the ways to fill it, differ. This article breaks down that difference using supply-side data.
Supply: 6,728 Rooms, 13% of Kyoto, at 44 Rooms per Property
First, the absolute volume of supply. The OTA-listed properties in Nara Prefecture that MetroEngines Research & Consulting confirmed as operating in July 2026 total 154 properties and 6,728 rooms. Ranked by room count across all 47 prefectures, that is third from the bottom. For a simple comparison with neighbors: Kyoto 52,693 rooms, Osaka 110,295, Wakayama 10,784, Shiga 10,434 and Mie 18,660. Nara has the fewest rooms of the six prefectures in the Kansai region.
The other thing to check is property size. 6,728 rooms ÷ 154 properties = 43.7 rooms. Tokyo, the largest market, has 182,896 rooms ÷ 1,354 properties = 135.1 rooms, and Osaka has 110,295 ÷ 698 = 158.0 rooms, so Nara’s average property is less than a third the size of those in major cities. In other words, Nara’s thin supply combines “few properties” with “small properties.” This structure ties directly to the price-band gap discussed below.
| Prefecture | Listed properties | Listed rooms | Rooms per property | Estimated OCC |
|---|---|---|---|---|
| Tokushima | 138 | 6,088 | 44.1 | 83.9% |
| Saga | 156 | 6,476 | 41.5 | 85.4% |
| Nara | 154 | 6,728 | 43.7 | 80.5% |
| Kochi | 157 | 7,859 | 50.1 | 87.2% |
| Tottori | 171 | 8,129 | 47.5 | 84.0% |
| Shimane | 239 | 8,708 | 36.4 | 85.3% |
| Fukui | 240 | 8,916 | 37.2 | 88.5% |
| Shiga | 208 | 10,434 | 50.2 | 86.0% |
| Akita | 191 | 10,436 | 54.6 | 90.4% |
| Wakayama | 318 | 10,784 | 33.9 | 85.6% |
| (Reference) Kyoto | 943 | 52,693 | 55.9 | 83.8% |
| (Reference) Osaka | 698 | 110,295 | 158.0 | 86.5% |
Demand: 42nd in Guest Nights, but Growing +12.1%
Is supply thin because demand is thin? Reading the time-series tables of the Japan Tourism Agency’s Overnight Travel Statistics Survey (published with the July 2026 data) directly, Nara Prefecture recorded 3,177,210 guest nights in 2025, ranking 42nd nationwide, a 0.48% share of the national total of 661.10 million. That is, however, +12.1% from 2,834,450 the previous year, and +16.5% versus 2,726,320 in pre-COVID 2019. With the national total up only +0.3% year on year (659.06 million to 661.10 million), Nara’s growth rate is clearly in the upper tier.
Foreign guest nights in 2025 were 520,130, 16.4% of the prefecture’s total. They have not yet fully recovered to the 535,290 of 2019 (-2.8%). While foreign guest nights nationwide grew +55.6%, from 115.65 million in 2019 to 179.92 million in 2025, Nara’s inbound stays have not captured that growth. Visitors come, but they don’t stay, and the statistics show this structure clearly.
Supporting this, Nara City’s tourist arrivals survey (Tourism Strategy Division, Nara City Tourism and Economy Department, released June 26, 2025) counted 2.038 million overnight visitors against 14.87 million total tourists in 2024. The overnight ratio is 13.7%, and the remaining roughly 12.83 million were day-trippers. Foreign visitors that year reached 2.977 million (+61.4% year on year), but foreign overnight visitors numbered 445,000, again only 15.0% of visits. The 2.038 million overnight visitors is the highest in 15 years, surpassing the 1.956 million of 2010, when the 1300th Anniversary of the Nara Heijo-kyo Capital was held. Stays are growing. But the underlying day-trip-heavy structure has not changed.
Occupancy: Behind a 50.9% Prefecture Average, Business and City Hotels Beat the National Average
By the Japan Tourism Agency’s room occupancy, Nara Prefecture recorded 50.9% in 2025, 37th in Japan and 10.7pt below the national average of 61.6%. On the numbers alone, it looks like a low-occupancy prefecture. Break it down by property type, however, and the picture changes.
| Property type | 2024 | 2025 | Change | Apr 2026 | Japan, Apr 2026 |
|---|---|---|---|---|---|
| Business hotels | 64.9% | 69.3% | +4.4pt | 78.0% | 74.1% |
| City hotels | 65.4% | 69.0% | +3.6pt | 79.5% | 71.7% |
| Resort hotels | 54.2% | 65.7% | +11.5pt | 49.1% | 53.7% |
| Ryokan | 30.4% | 33.4% | +3.0pt | 39.7% | 37.7% |
| Simple lodgings | 17.2% | 18.9% | +1.7pt | 24.6% | 24.6% |
| Prefecture total | 46.2% | 50.9% | +4.7pt | 60.1% | 59.1% |
In April 2026, Nara’s business hotels (78.0%) and city hotels (79.5%) both exceeded the national averages (74.1% and 71.7%). The prefecture total comes out low because ryokan, at 33.4% occupancy, make up most of the properties, and simple lodgings at 18.9% drag the figure down. In other words, what Nara lacks is probably not demand, but the types of rooms that can absorb it. Urban-style rooms are already nearly full, and spare capacity is concentrated in small, low-occupancy properties.
Rates: Trailing 12-Month Estimated Settled ADR of ¥13,241, +5.2% Year on Year
Next, price. Nara Prefecture’s estimated settled ADR (median of target properties) for the trailing 12 months (August 2025–July 2026) was ¥13,200, +5.2% from ¥12,600 in the prior-year period (August 2024–July 2025). On listed prices (all-plan average), the same period went from ¥22,000 to ¥25,900, +17.5%, but that includes the effect of unsold high-priced plans remaining on OTAs, so we use estimated settled ADR as the indicator of transaction levels.
Monthly, seasonality is clear. The peak is November, during autumn foliage, at ¥16,600 in 2025, followed by April at ¥14,800 (2026). The trough is June, at ¥9,800 in June 2026. Note that early summer 2026 fell below the prior year: June 2026 was -17.7% from ¥11,900 a year earlier, and July fell from ¥12,000 to ¥10,400 (-13.3%). April 2026, by contrast, rose +3.4% from ¥14,300 to ¥14,800. Strong in spring, weak in early summer: this 2026 pattern matches the one we observed in Kyoto, where city and business hotel ADR broke in early summer. It is most naturally read as a phenomenon across the wider Kansai region.
Category Mix: Only 7 City Hotels and 5 Resorts
Now to the main point. Breaking down Nara’s listed properties by category shows the market’s skew in numbers. Listed prices (all-plan average) and property counts as of August 2026 are as follows.
| Category | Listed properties | Listed price (all-plan average) |
|---|---|---|
| Ryokan | 82 | ¥48,800 |
| Guesthouses | 45 | ¥35,000 |
| Vacation rentals | 32 | ¥48,900 |
| Business hotels | 31 | ¥16,200 |
| Minshuku (family inns) | 17 | ¥22,900 |
| Hostels | 9 | ¥14,100 |
| Machiya townhouses | 7 | ¥25,800 |
| City hotels | 7 | ¥24,700 |
| Resort hotels | 5 | ¥41,800 |
| Pensions | 4 | ¥33,100 |
| Auberges | 3 | ¥99,100 |
| Farm stays | 3 | ¥22,500 |
Ryokan (82), guesthouses (45) and vacation rentals (32) account for 65% of the 245 properties shown (59% of the prefecture’s 271), while urban supply is limited to 31 business hotels and 7 city hotels. Overlay the occupancy data from the previous section and the meaning becomes clear. There are only 7 city hotels in the prefecture running at 69–80% occupancy (Japan Tourism Agency, 2025 actuals to April 2026 actuals), versus 82 ryokan at 33.4% (Japan Tourism Agency, 2025 actuals). The category that draws demand has the thinnest supply.
ADR Hierarchy by Municipality: 44% of Listed Properties Are in Nara City
Spatial distribution within the prefecture is also skewed. Of 314 listed properties as of July 2026 (all properties, including small ones with fewer than 10 rooms), Nara City accounts for 138, or 43.9%. Tenkawa Village is second with 21 and Yoshino Town third with 16; all others have fewer than 20.
| Municipality | Listed properties | Listed price (all-plan average) | Estimated settled ADR | Properties with settled estimate |
|---|---|---|---|---|
| Nara City | 138 | ¥21,700 | ¥10,000 | 58 |
| Tenkawa Village | 21 | ¥33,000 | ¥19,700 | 15 |
| Yoshino Town | 16 | ¥29,100 | ¥19,300 | 7 |
| Sakurai City | 14 | ¥19,300 | ¥6,800 | 6 |
| Uda City | 11 | ¥30,700 | — | 1 |
| Kashihara City | 11 | ¥16,400 | ¥7,100 | 5 |
| Tenri City | 11 | ¥11,500 | ¥7,100 | 7 |
| Asuka Village | 10 | ¥27,900 | — | 0 |
| Totsukawa Village | 9 | ¥31,800 | ¥11,700 | 6 |
| Gojo City | 9 | ¥29,300 | — | 2 |
| Kashiba City | 9 | ¥7,000 | — | 0 |
| Ikoma City | 7 | ¥19,500 | ¥5,000 | 3 |
Nara City’s estimated settled ADR of ¥10,000 is low among the prefecture’s main municipalities, while Tenkawa Village (¥19,700) and Yoshino Town (¥19,300) rank high because southern hot-spring ryokan and half-board properties sell higher-priced products. Conversely, the northern areas closer to business districts, Tenri City (¥7,100), Kashihara City (¥7,100) and Ikoma City (¥5,000, 3 properties), are dominated by low-priced limited-service hotels. The prefecture’s price hierarchy, “southern ryokan are expensive, northern urban areas are cheap,” is the reverse of the usual pattern in which cities lead on rate.
Positioning Analysis: Of 33 Properties with 60+ Rooms, Only 1 Exceeds ¥15,000 ADR
This is the core of the article. We plot the 97 properties in Nara Prefecture that have 10 or more rooms and a calculable estimated settled ADR (6,695 rooms in total, July 2026) on two axes: room count and estimated settled ADR. The median estimated settled ADR of the 97 properties is ¥9,400.
| Estimated settled ADR | 10–29 rooms | 30–59 rooms | 60–119 rooms | 120+ rooms |
|---|---|---|---|---|
| Up to ¥10,000 | 18 | 11 | 10 | 14 |
| ¥10,000–¥15,000 | 7 | 6 | 1 | 7 |
| ¥15,000–¥20,000 | 5 | 2 | 0 | 0 |
| ¥20,000–¥30,000 | 5 | 3 | 0 | 0 |
| ¥30,000–¥50,000 | 4 | 1 | 0 | 1 |
| ¥50,000+ | 0 | 2 | 0 | 0 |
The matrix makes the gap very clear.
Of the 33 properties with 60+ rooms (5,034 rooms), only one has an estimated settled ADR above ¥15,000. That property is JW Marriott Hotel Nara (JWマリオット・ホテル奈良; 158 rooms, ¥41,200), and the next highest drops straight to ¥13,400. In other words, not a single property exists in the ¥15,000–¥40,000 × 60+ rooms band. There is effectively no mid-to-large urban property in the prefecture achieving midscale-to-upper-midscale rates.
Among 30–59-room properties, six exceed ¥20,000. They are Fufu Nara (ふふ奈良; 30 rooms, ¥75,000), Shisui, a Luxury Collection Hotel, Nara (紫翠ラグジュアリーコレクションホテル奈良; 43 rooms, ¥52,900), Nara Manyo Wakakusa no Yado Mikasa (奈良・万葉若草の宿 三笠; 34 rooms, ¥32,200), Setre Naramachi (セトレならまち; 32 rooms, ¥28,200), Kasuga Hotel (春日ホテル; 30 rooms, ¥22,700) and Asukaso (飛鳥荘; 30 rooms, ¥20,400), all small at 30–43 rooms. The luxury and small-boutique ends are already taken, while only the middle, “upper-midscale with economies of scale,” remains open.
One more fact: properties with an estimated settled ADR below ¥10,000 number 53 with 4,205 rooms, 62.8% of the rooms analyzed. More than 60% of Nara’s room stock is stuck below ¥10,000.
Crowded Occupied territory
Up to ¥10,000 × all sizes
53 properties, 4,205 rooms (62.8% of rooms analyzed). Crowded with limited-service hotels and ryokan; new entrants are likely to face price competition.
WS1 Mid-size upper-midscale
¥15,000–¥40,000 × 60+ rooms
0 properties. An urban band with above-national-average occupancy, where economies of scale and rate can be captured together, is completely empty.
WS2 30-room-class upper-midscale
¥20,000–¥30,000 × 30–59 rooms
Only 3 properties. There is a step up to small luxury (2 properties above ¥50,000). Suited to conversions of machiya townhouses or sites near temples and shrines.
Sell-Through Speed: The Low-Price Band Sells Out First
Would rooms priced in the whitespace actually fill? To test this, we use sell-through data for August 13–16, 2026 (Obon, a period already past, so results are final). For these four days, we tracked remaining rooms by lead time for properties in the prefecture. Of 800 properties in the prefecture, 165 had observation data; excluding those whose OTA allocation is under 30% of total rooms leaves 130 properties in the sample. Of these, the 43 with a calculable estimated settled ADR are plotted on two axes: rate and sell-through speed.
The two axes show a weak negative correlation (ρ=-0.34, N=43). Looking at groups is easier: the 8 properties with an early sell-out LT of 40+ days had a median estimated settled ADR of ¥6,600 (median 37.5 rooms), while the 14 properties with an early sell-out LT under 10 days had ¥10,700 (median 24 rooms). The properties selling out fastest in the prefecture are mid-size, low-priced properties, the segment with the most supply.
Individually, this demand strength is clearly visible. Kashihara Oak Hotel (橿原オークホテル) in Kashihara City (36 rooms, city hotel) recorded zero remaining rooms on all four Obon days, with an average LT of 54.5 and 76 sold-out days observed. Hotel Route-Inn Sakurai Ekimae (ホテルルートイン桜井駅前) in Sakurai City (175 rooms) averaged LT 49.8 with 168 sold-out days, reaching zero remaining rooms for August 14 at LT 75. Toyoko Inn Kintetsu Nara Ekimae (東横INN近鉄奈良駅前; 128 rooms), in front of Kintetsu Nara Station, also sold out all four days, with zero rooms remaining for August 14 and 15 from LT 90 onward. Onyado Nono Nara (御宿 野乃 奈良), one of the prefecture’s largest with 216 rooms, also sold out all four days, with zero rooms remaining for August 13 from LT 76. Popular low-to-mid-priced properties run out of inventory one to two months or more ahead of demand peaks like Obon.
| Property | Rooms | Category | Avg early sell-out LT | Sold-out days observed | Estimated settled ADR |
|---|---|---|---|---|---|
| Riverside Hotel (リバーサイドホテル; Totsukawa Village) | 55 | Ryokan | 57.5 | 181 | ¥5,400 |
| Kashihara Oak Hotel (橿原オークホテル; Kashihara City) | 36 | City hotel | 54.5 | 76 | ¥7,100 |
| Hotel Route-Inn Sakurai Ekimae (ホテルルートイン桜井駅前; Sakurai City) | 175 | Business hotel | 49.8 | 168 | ¥7,800 |
| Toyoko Inn Kintetsu Nara Ekimae (東横INN近鉄奈良駅前; Nara City) | 128 | Business hotel | 48.5 | 101 | ¥6,900 |
| Hotel Asyl Nara (ホテルアジール・奈良; Nara City) | 39 | Ryokan | 43.5 | 94 | ¥6,300 |
| Iroha Grand Hotel Kintetsu Nara Ekimae (いろはグランホテル近鉄奈良駅前; Nara City) | 143 | Business hotel | 31.2 | 54 | ¥8,700 |
| Onyado Nono Nara (御宿 野乃 奈良; Nara City) | 216 | Business hotel | 20.5 | 49 | ¥10,000 |
| Kamenoi Hotel Yamato Heguri (亀の井ホテル 大和平群; Heguri Town) | 42 | Ryokan | 17.5 | 68 | ¥13,000 |
This result supports pricing into WS1 (¥15,000–¥40,000 × 60+ rooms). Demand volume is indeed in the low-price band, but that band is already saturated and sells out one to two months ahead at peak times. What it misses are less price-sensitive guests: long-distance travelers, with the Kanto region accounting for 36.5% of overnight tourists led by Tokyo (15.4%) and Aichi (9.0%) according to the Nara Prefecture Tourist Behavior Survey (2024), and international visitors, whose overnight rate is still only 15.0%. For guests who travel far and stay the night, the prefecture offers almost nothing between ¥7,000 limited-service hotels and luxury above ¥50,000.
Location Assessment: Demand Types from Resident and Employment Structure around Four Stations
Where should a property filling the whitespace go? For four major station areas in Nara Prefecture, we compared residential population within a 1,500m radius (MLIT National Land Numerical Information, 250m mesh future population estimates) with employment structure within a 1,000m radius (MIC & METI Economic Census).
| Station | Residents (2025 est., 1.5km) | Change to 2040 | Seniors share | Establishments (1km) | Employees | Office-type share | Demand type |
|---|---|---|---|---|---|---|---|
| Kintetsu Nara | 40,992 | -11.3% | 31.4% | 1,937 | 16,291 | 25.3% | Tourism-led with mixed business |
| JR Nara | 59,213 | -10.6% | 30.6% | 2,457 | 25,146 | 20.9% | Business plus regional transport hub |
| Yamato-Saidaiji | 31,838 | -11.8% | 30.3% | 744 | 8,513 | 13.3% | Residential / local hub |
| Kintetsu Koriyama | 29,617 | -19.3% | 30.7% | 785 | 5,872 | 11.2% | Residential / local commerce |
Three points stand out.
First, the JR Nara Station area is the prefecture’s largest employment cluster, with 25,146 employees, well above the Kintetsu Nara Station area’s 16,291. Its office-type share, however, is 20.9%, lower than Kintetsu Nara’s 25.3%. The JR Nara area has many establishments (2,457), but spans a wide range of industries including wholesale, retail and services; it is not a pure office district. With its strong role as a regional transport hub where the Kansai Main Line and Sakurai Line meet, it reads as a location that can capture both weekday business demand and weekend tourism demand. Indeed, limited-service hotels of 230, 226 and 330 rooms are clustered in this station area.
Second, the Kintetsu Nara Station area is a tourism-led location. It has walking access to Todaiji, Kofukuji, Kasuga Taisha and Nara Park; while its 25.3% office-type share is the highest of the four stations, its 16,291 employees are just over 60% of the JR Nara area’s. This is not a location built on business demand; its value as a tourist arrival point determines rates. WS1 (¥15,000–¥40,000 × 60+ rooms), identified above, is most likely to work in this station area.
Third, the Yamato-Saidaiji and Kintetsu Koriyama station areas offer little basis for lodging demand. Their office-type shares are low at 13.3% and 11.2%, and employee counts are less than a third of the JR Nara area’s. The Kintetsu Koriyama area is projected to lose 19.3% of its residents by 2040, the largest decline of the four. Any new development in these two areas would need to base its demand case not on the station area’s resident and employment structure, but on proximity to nearby tourist assets such as Horyuji, Yakushiji and Toshodaiji.
The mesh map shows that residents around Kintetsu Nara Station are concentrated west and southwest of the station (along Sanjo-dori to Omiya-dori), while the Nara Park and Mt. Kasuga area to the east is almost uninhabited. Realistic hotel sites are limited to the west and southwest of the station; there is almost no developable private land on the park side. This geographic constraint also explains why the supply pipeline discussed below is concentrated in specific blocks.
Land Prices: Flat Prefecture-Wide, but +9.01% in Front of Kintetsu Nara Station
Next, land costs. In the 2026 official land price publication, Nara Prefecture averaged ¥69,500/㎡ for residential land (-0.1% year on year), ¥161,400/㎡ for commercial land and ¥85,900/㎡ across all uses (+0.1%), essentially flat. By municipality, Nara City ranks first at ¥157,600/㎡ (+2.00%).
Notably, the highest-priced point in the prefecture, which also posted the highest increase, is 1-4 Nakasuji-cho, Nara City (nearest station: Kintetsu Nara) at ¥992,000/㎡, +9.01% year on year. While the prefecture average is flat, this single point in front of the station rose 9%. Land prices reflect the scarcity of sites and the strength of development appetite concentrated there. Put the other way, land acquisition costs near Kintetsu Nara Station can exceed six times the prefecture average.
On the map, of the 44 properties (3,647 rooms) within 2km of the station, 8 have an estimated settled ADR above ¥20,000: Fufu Nara (30 rooms, ¥75,000), Shisui, a Luxury Collection Hotel, Nara (43 rooms, ¥52,900), ANDO HOTEL Nara Wakakusayama (ANDOHOTEL奈良若草山; 21 rooms, ¥39,400), Kotonoyado Musashino (古都の宿むさし野; 12 rooms, ¥37,200), Nara Manyo Wakakusa no Yado Mikasa (34 rooms, ¥32,200), Setre Naramachi (32 rooms, ¥28,200), Kasuga Hotel (30 rooms, ¥22,700) and Asukaso (30 rooms, ¥20,400). The largest has 43 rooms. Meanwhile, the 19 properties with 60+ rooms top out at ¥12,700 (Piazza Hotel Nara (ピアッツァホテル 奈良), 137 rooms), with every one below ¥13,000 ADR. The combination “near the station, large, upper-midscale” does not exist anywhere on the map.
Supply Pipeline: 116 New Rooms in 2026, 302 Rooms in Announced Plans
Is the whitespace still open, or already filling? We check supply-side observations from two sources.
First, new openings in 2026 confirmed through OTA listings total 12 properties and 116 rooms, just 1.7% of the existing 6,728 rooms. Moreover, 10 of the 12 are vacation rentals or guesthouses with 1–10 rooms; only 2 have 40 or more rooms. Second, the building plan database based on MLIT’s Building Dynamics Statistics Survey has zero lodging projects registered for Nara Prefecture.
Note on reading supply data: New-opening data based on confirmed OTA listings may increase for recent and future months as listings appear, since properties are typically listed several months before opening. Building plan data is based on building confirmation applications as of the survey date; because applications are usually filed one to two years before opening, counts and room numbers are expected to increase as new applications are added. Zero for Nara Prefecture does not mean “no plans exist” but that “no confirmation applications are currently registered in the database”; treat it as the lower bound of the confirmed pipeline at present. In fact, as shown below, several plans have been announced in the press.
Organizing the plans announced in press reports and company releases, we can confirm the following three.
| Property | Company | Rooms | Scheduled opening | Expected price range |
|---|---|---|---|---|
| Hiyori Hotel Kintetsu Nara Ekimae (日和ホテル近鉄奈良駅前) | NTT West Asset Planning (development) / Sun Frontier Hotel Management (operation) | 177 | Spring 2027 (completion scheduled February 2027) | Midscale |
| Luxury ryokan (on Todaiji-owned land near Nara Park) | Kintetsu-Miyako Hotels International | approx. 25 | Autumn 2028 | Luxury |
| Hotel NEI Nara (ホテル 寧 奈良; The Unbound Collection by Hyatt) | JR Central / JR Central Real Estate / JR Central Hotels | approx. 100 | FY2030 | Luxury |
The three total 302 rooms, a 4.5% increase over the existing 6,728. Their content shows that operators already recognize the upper-midscale gap. Hiyori Hotel Kintetsu Nara Ekimae, opening in spring 2027, is a six-story, approx. 5,400㎡ midscale plan with 177 rooms, a restaurant and a large communal bath, a size and grade aimed squarely at the WS1 band. This one property alone would raise the number of “60+ rooms with ADR above ¥15,000” properties in the prefecture from one to two.
For Hotel NEI Nara, JR Central announced in April 2025 an expansion from about 70 to about 100 rooms, on a site of approx. 4,160㎡ with four floors above ground (partly five) and one basement, approx. 8,630㎡ of floor area, two minutes’ walk from Kintetsu Nara Station. It is positioned as the first western Japan entry of Hyatt’s luxury brand The Unbound Collection by Hyatt. Hyatt Hotels Japan’s “Press Materials, April 2026” also lists Hotel NEI Nara under The Unbound Collection by Hyatt in the Kansai area of its domestic pipeline (with opening year and room count shown as undecided at that time); the same material shows 22 hotels across 9 brands and 5,066 rooms operating in Japan. With 100 luxury rooms added in Nara by FY2030, properties above ¥40,000 in the prefecture will rise from the current 3 to 4.
All three are in Nara City, and concentrated within walking distance of Kintetsu Nara Station. As the mesh map showed, developable private land is limited to the west and southwest of the station, so the geographic clustering of the pipeline is a structural consequence. Conversely, the JR Nara Station area (25,146 employees) and tourism hubs in the south of the prefecture have almost no announced new plans.
Development Scenarios: Building in Construction Inflation Cuts Yields by About 1pt
We roughly estimate the feasibility of a property in WS1 under three scenarios. All are hypothetical models assuming the Kintetsu Nara Station area and do not refer to any specific site or project. The assumptions are as follows.
Construction costs are presented in two stages. Stage 1 uses 2025 actual cost per tsubo based on MLIT’s Building Construction Starts Statistics (steel frame ¥2.405 million / reinforced concrete ¥2.026 million; by hotel type, budget ¥2.0–2.4 million, midscale ¥2.3–2.5 million, upper-midscale ¥2.4–2.6 million, luxury ¥3.1–3.5 million). Stage 2 builds in inflation during construction: using Turner & Townsend’s construction cost forecasts (+5.3% in 2026, +5.0% in 2027) and, from 2028, this article’s assumption of +4.5% reflecting the firm’s outlook that “increases will moderate after 2027”, compounded to the midpoint of construction worked back from the scheduled opening year (cumulative factor 1.181). Land is uniformly set at site area × ¥300,000/㎡ (about twice the Nara City average of ¥157,600/㎡, assuming commercial land near a station). Occupancy is set at 60–72% by scenario, with reference to Japan Tourism Agency actuals for Nara business hotels of 69.3% in 2025. GOP margin is 35% in all cases.
| Item | A. Limited-service | B. Upper-midscale WS1 | C. Small luxury |
|---|---|---|---|
| Rooms | 120 | 100 | 40 |
| Area per room | 20㎡ | 27㎡ | 45㎡ |
| Gross floor area | 3,529㎡ (1,068 tsubo) | 4,355㎡ (1,317 tsubo) | 3,273㎡ (990 tsubo) |
| Assumed ADR (tax-exclusive equivalent) | ¥13,000 | ¥22,000 | ¥50,000 |
| Assumed occupancy | 72% | 70% | 60% |
| Annual revenue (incl. 15% ancillary) | ¥471M | ¥646M | ¥504M |
| GOP (35% margin) | ¥165M | ¥226M | ¥176M |
| Construction cost, Stage 1 (2025 actuals) | ¥2,456M (¥2.3M/tsubo) | ¥3,293M (¥2.5M/tsubo) | ¥3,267M (¥3.3M/tsubo) |
| Land | ¥360M | ¥420M | ¥480M |
| Total investment, Stage 1 | ¥2,816M | ¥3,713M | ¥3,747M |
| GOP yield, Stage 1 | 5.9% | 6.1% | 4.7% |
| Construction cost, Stage 2 (after inflation) | ¥2,900M (¥2.72M/tsubo) | ¥3,889M (¥2.95M/tsubo) | ¥3,858M (¥3.9M/tsubo) |
| Total investment, Stage 2 | ¥3,260M | ¥4,309M | ¥4,338M |
| GOP yield, Stage 2 | 5.1% | 5.2% | 4.1% |
| Simple payback (Stage 2) | 19.8 years | 19.0 years | 24.6 years |
Of the three scenarios, B (upper-midscale) has the highest yield: 6.1% at Stage 1 and 5.2% at Stage 2. The gap with A (limited-service) is only about 0.2pt, but with 20 fewer rooms B tends to have an edge in productivity per operating staff. C (small luxury) falls to 4.1% at Stage 2. The 45㎡ rooms and ¥3.3 million per tsubo construction spec push up investment, and it is a band already held by Shisui, a Luxury Collection Hotel, Nara and Fufu Nara. For a new entrant, WS1, sitting between A and B, is the most realistic option.
One more point: the impact of construction inflation cannot be ignored. With the same spec, yields fall 0.6–0.9pt between Stage 1 and Stage 2, and payback lengthens by two to three years. But this also works to restrain new supply. In a market like Nara with only 6,728 existing rooms, as long as construction costs keep rising, competitors will also be slow to enter, which is an upside factor: an early mover’s scarcity value is preserved for longer.
Sensitivity Analysis: High-4% Yield Holds Even If ADR Falls to ¥19,800
For Scenario B, we check yields when ADR and occupancy fall short of assumptions.
| Assumption | GOP | Yield, Stage 1 | Yield, Stage 2 |
|---|---|---|---|
| Base: ADR ¥22,000 / occupancy 70% | ¥226M | 6.1% | 5.2% |
| ADR -10% (¥19,800) / occupancy 70% | ¥204M | 5.5% | 4.7% |
| ADR ¥22,000 / occupancy -5pt (65%) | ¥210M | 5.7% | 4.9% |
| Both (¥19,800 / 65%) | ¥189M | 5.1% | 4.4% |
| Occupancy \ ADR | ¥18,000 | ¥20,000 | ¥22,000 | ¥24,000 | ¥26,000 |
|---|---|---|---|---|---|
| Occ. 60% | 3.7% | 4.1% | 4.5% | 4.9% | 5.3% |
| Occ. 65% | 4.0% | 4.4% | 4.9% | 5.3% | 5.8% |
| Occ. 70% | 4.3% | 4.8% | 5.3% | 5.7% | 6.2% |
| Occ. 75% | 4.6% | 5.1% | 5.6% | 6.1% | 6.6% |
| Occ. 80% | 4.9% | 5.5% | 6.0% | 6.5% | 7.1% |
On two axes, Stage 2 yields of 5% or more are achievable in the region of ADR ¥20,000+ and occupancy 65%+. Hitting the assumed ADR of ¥22,000 at 70% occupancy gives 5.2%, but if ADR falls to ¥18,000, even 80% occupancy yields only 4.9%; making up for a rate shortfall with occupancy is difficult. In this project, where ADR is set matters more to yield than occupancy, and the two-way grid confirms the same conclusion as the previous section.
Even in the toughest case (ADR -10% and occupancy -5pt), the Stage 2 yield holds at 4.4%. An assumed ADR of ¥19,800 is consistent with the level of the 7 existing properties in the ¥15,000–¥20,000 band in the prefecture, so it is not an unattainable assumption. For downside resilience, the ADR assumption is more sensitive than the occupancy assumption (ADR -10% cuts yield by 0.6pt; occupancy -5pt by 0.4pt). In Nara’s market, where the rate can be set determines feasibility.
Key Issues to Consider
| Area | Detail | Implication |
|---|---|---|
| Market | Overnight ratio 13.7% (Nara City, 2024): 2.038 million overnight visitors against 14.87 million total tourists | Total demand is large, with substantial room to convert to stays. Designing stay value is a precondition for rate |
| Market | Estimated settled ADR in June–July 2026 down -17.7% / -13.3% year on year | Early-summer demand softened across Kansai. Plans need to reflect monthly swings, not annual averages |
| Land | Commercial land next to Kintetsu Nara Station at ¥992,000/㎡ (+9.01%). Developable land limited to west and southwest of the station | Land costs tend to overshoot. Land cost assumptions in the scenarios vary widely with site conditions |
| Construction | Construction costs up a cumulative +18.1% from 2025 actuals to the construction midpoint | Confirm feasibility on a Stage 2 basis. Also a factor restraining competitor entry |
| Demand | Foreign guest nights -2.8% vs 2019, still recovering (Japan: +55.6%) | Large room to capture inbound stays. Multilingual and long-stay services are upside |
| Supply | Announced plans: 177 rooms in spring 2027, approx. 25 rooms in autumn 2028, approx. 100 rooms in FY2030 | WS1 will be partly filled from 2027. For early movers, decisions in 2026–2027 are the turning point |
| Population | Residents projected to fall -10% to -19% by 2040 in all four station areas | Business plans must assume regional and international demand, not local demand |
Conclusion: Not a Prefecture Where You Can’t Stay, but One Without Options to Stay
Here is a summary of the facts established in this article.
Nara Prefecture has 154 OTA-listed properties with 6,728 rooms, 45th in Japan, at a small 43.7 rooms per property. Yet estimated OCC in July 2026 was 80.5%, and Japan Tourism Agency actuals show business hotels at 78.0% and city hotels at 79.5% (April 2026), above national averages. Guest nights grew to 3.17 million in 2025, +12.1% year on year, far above the national +0.3%. Demand is solid.
The upside lies in the shape of supply. Of the 97 properties with a calculable estimated settled ADR, only one of the 33 properties with 60+ rooms (5,034 rooms) exceeds ¥15,000 (JW Marriott Hotel Nara), and the ¥15,000–¥40,000 × 60+ rooms band has zero properties. Fifty-three properties with 4,205 rooms (62.8% of rooms analyzed) are concentrated below ¥10,000. And Obon results show that it is exactly this low-price band that sells out fastest: the 8 properties that sold out at a lead time of 40+ days had a median estimated settled ADR of ¥6,600. The volume zone is already saturated, and there is no mid-price band to absorb the overflow.
Then there is the day-trip ratio. In Nara City in 2024, 2.038 million of 14.87 million total tourists stayed overnight, a ratio of 13.7%. Of 2.977 million foreign visitors, only 445,000 stayed (15.0%). The data in this article support reading this not as “Nara is not worth staying in,” but as “the prefecture has almost no rooms in the price bands and sizes that long-distance travelers and affluent international visitors would choose.” The gap between ¥7,000 limited-service hotels and luxury above ¥50,000 is missing.
Operators are beginning to recognize this gap. A 177-room midscale hotel in spring 2027, a luxury ryokan of about 25 rooms in autumn 2028 and a luxury hotel of about 100 rooms in FY2030 have been announced, 302 rooms in total (4.5% of existing). Even so, the prefecture’s total room count would stay at around 7,000, and its relationship to Kyoto at 13–14% would not change. Thin supply is a constraint, but for entrants it is also a condition of limited competition. With construction costs rising around 5% a year, whether one can enter this band first will be the turning point for the next several years.
⚠ Note on future dates and projections: Estimated settled ADR for August 2026 onward in this article is based on selling prices published on OTAs at the time of the survey and will change as check-in dates approach. Room counts and scheduled opening dates in the supply pipeline are plans as of each company’s announcement and may change. The development scenarios are simplified estimates based on public data; actual investment decisions require a detailed feasibility study.
Related Articles
References and Sources
■ Data sources
MetroEngines Research & Consulting OTA listed price and inventory data (as of July 2026: Nara Prefecture 154 listed properties, 6,728 rooms; estimated settled ADR for N=97 properties, 6,695 rooms, with 10+ rooms and a calculable estimate; municipalities limited to those with 7+ listed properties), Japan Tourism Agency Overnight Travel Statistics Survey (published with July 2026 data, second preliminary estimates), MLIT National Land Numerical Information, Land Price Publication and Building Construction Starts Statistics, MIC & METI Economic Census for Business Activity, and company announcements.
■ Estimation assumptions
Development scenarios use a uniform 35% GOP margin, 15% ancillary revenue and 60–72% assumed occupancy. Construction costs are presented in two stages: Stage 1 (2025 actual cost per tsubo by structure) and Stage 2 (inflation during construction compounded to the construction midpoint, cumulative factor 1.181). Land is fixed at site area × ¥300,000/㎡. Yield is a simple GOP ÷ total investment yield and excludes interest, depreciation, corporate tax and FF&E replacement.
■ Limitations
Estimated OCC is based on the sell-through of inventory sold on OTAs; its survey body, population and definition differ from a property’s actual overall occupancy and from the Japan Tourism Agency’s room occupancy. Estimated settled ADR applies category-specific adjustment factors to published prices (median error of about 7% against listed REIT disclosures) and differs from actual transaction prices and accounting figures. The development scenarios are hypothetical models assuming the Kintetsu Nara Station area and do not refer to any specific site or project. Municipalities with few listed properties or few settled-rate estimates are not treated as representative.
■ Market data
- MetroEngines Research & Consulting — OTA listed price data (estimated settled ADR, listed prices), estimated occupancy (OCC), sell-through data, new-opening data (based on confirmed OTA listings)
■ Government statistics and public data
- Japan Tourism Agency, Overnight Travel Statistics Survey, time-series tables (published with July 2026 data) — guest nights, foreign guest nights and room occupancy by property type, by prefecture
- MLIT Land Price Publication (2026)
- MLIT National Land Numerical Information, “250m Mesh Future Population Estimates (2024 National Policy Bureau estimates)”
- MIC & METI, “Economic Census for Business Activity (2021)” (boundaries = 2020 Census small areas)
- MLIT, “Building Construction Starts Statistics” (2025 actual cost per tsubo by structure) / “Building Dynamics Statistics Survey” (building plans)
■ Local government statistics
- Nara City, “2024 Nara City Tourist Arrivals Survey” (mayoral press conference, released June 26, 2025; Japanese)
- Nara Prefecture Tourism Bureau, Tourism Strategy Division, “Nara Prefecture Tourist Behavior Survey Report (January–December 2024)” (Japanese)
- Nara Prefecture, “Tourist Behavior Survey” (Japanese)
■ Company announcements and press
- Nikkei, “NTT West subsidiary to develop Hiyori Hotel Kintetsu Nara Ekimae in Nara City, opening spring 2027” (Japanese)
- Nara Shimbun Digital, “New midscale hotel planned in front of Kintetsu Nara Station amid wave of hotel openings, completion March 2027” (May 14, 2025; Japanese)
- Nikkei, “Kintetsu-Miyako Hotels to open luxury ryokan on Todaiji-owned land in Nara City in autumn 2028” (Japanese)
- Nara Shimbun Digital, “Hotel NEI Nara planned by JR Central and others expands to 100 rooms, opening FY2030” (April 13, 2025; Japanese)
- Nikkei, “JR Central expands luxury Hotel NEI Nara in Nara City, opening FY2030” (Japanese)
- Diamond Real Estate Research Institute, “Nara Prefecture Official Land Prices and Price per Tsubo Ranking (2026)” (compiled from MLIT Land Price Publication; Japanese)
- Turner & Townsend, “International Construction Market Survey” (construction cost forecasts)
Source: Hyatt Hotels Japan, “Press Materials, April 2026”