

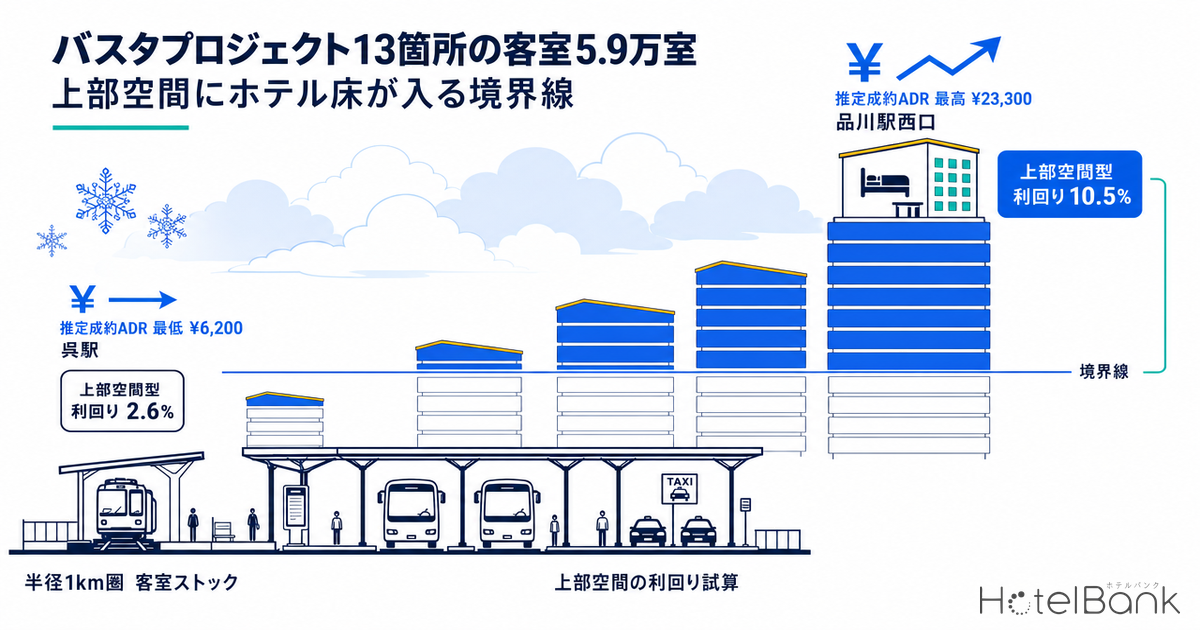
The Busta Project, led by Japan’s Ministry of Land, Infrastructure, Transport and Tourism (MLIT), is a public-private program to build integrated transport terminals that bring rail, bus and taxi services together in one place. Starting with Busta Shinjuku in April 2016, 8 sites have been formally commissioned and another 5 sites are under study (MLIT Road Bureau published materials, as of September 2026). These are not simple bus-station rebuilds. What sets them apart is that they are planned as vertical mixed-use developments, with retail, office and hotel floors stacked on top of the terminal function.
In this article we measure how much hotel room stock sits within a 1km radius of each of the 13 sites, and how much those rooms earn. We then quantify the line that decides whether hotel floors make it into the space above a transport hub, using three numbers: land cost, construction cost and room revenue.
How this differs from our earlier coverage. Our transport infrastructure × room stock series has previously covered the opening timelines of two new lines, the Naniwasuji Line and the Haneda Airport Access Line, as well as the impact of the Hokkaido Shinkansen extension delay on four stations along the route. Both pieces followed the same axis: “how demand at nodes along a route shifts when a new line opens.” This article takes a different axis. The question is not the line, but “whether floors can be stacked in the space above the hub itself.” Even at stations on existing lines, terminal redevelopment can create new floor area. The Busta Project is one of the few real-world sets of examples of this, and a rare development type in which hotel floors can be secured without acquiring land.
Metric Definitions Used in This Article
- ADR (Average Daily Rate) = an estimated settled rate (tax-exclusive equivalent), calculated by applying a property-type adjustment factor to each property’s lowest publicly listed OTA plan (per room, two guests, tax-inclusive). Checked against property-level results disclosed by listed hotel REITs (91 properties, most recent 3 months), the median error is about 7%. These are estimates and differ from each property’s actual transaction prices and accounting figures. Area-level ADR is the median of the covered properties (the level of a typical property in the area).
- OCC (Occupancy) = rooms sold as a share of total rooms in the area (an estimate based on OTA sales inventory; consistency checks against monthly REIT disclosures show accuracy within a few percentage points). This article uses prefecture-level values only and does not calculate OCC for individual properties.
- RevPAR = ADR × OCC. Annual room revenue per room = RevPAR × 365 days.
- Room stock = total rooms at lodging properties with a registered room count located within a 1km radius of each site’s center point. Aggregated from each property’s registered coordinates.
- Data sources: MetroEngines Research & Consulting / MLIT Real Estate Information Library / National Land Numerical Information / Economic Census (Ministry of Internal Affairs and Communications and Ministry of Economy, Trade and Industry)
- — The 1km radii around the 13 sites hold 59,148 rooms across 492 properties. The top four (Sapporo, Shinjuku, Kobe Sannomiya and Shinagawa) account for 66% of the total, more than 300 times the smallest site, Oppama Station, with just 41 rooms.
- — Estimated settled ADR ranges from ¥23,300 at Shinagawa Station West Exit to ¥6,200 at Kure Station, a 3.8x spread. Multiplied by OCC, the RevPAR gap widens to 4.1x.
- — Even in the air-rights model, where land cost is effectively zero, only 4 sites exceed a 5% indicative yield (Shinagawa 10.5%, Shinjuku 7.8%, Sapporo 6.8%, Kobe Sannomiya 5.0%). The remaining 8 sit at 2.6–3.7%.
- — The benefit of building above the terminal, namely avoiding land cost, adds 1pt or more to yield only at the 4 sites where commercial land prices exceed ¥1 million/㎡. At regional hubs, building in air-rights space adds little to the investment case in itself.
- — The split between Sapporo and Kobe Sannomiya, where hotel floors are in the plans, and Kure, where medical and residential floors were chosen instead, follows the order of our model. The three conditions are ADR of ¥10,000+, commercial land prices of ¥1 million/㎡+, and 3,000+ rooms within a 1km radius.
The Busta Project’s 13 Sites: 8 Commissioned, 5 Under Study
The sites published by the MLIT Road Bureau comprise 8 commissioned projects, including the operating Busta Shinjuku, and 5 at the survey and study stage. By year of commissioning, Shinagawa Station West Exit came first in FY2019, followed by Niigata Station and Kobe Sannomiya Station in FY2020, Oppama Station, Kintetsu Yokkaichi Station and Kure Station in FY2021, and Sapporo Station in FY2023. Within roughly three years, the program spread rapidly to regional core cities. The 5 sites under study include prefectural-capital-class locations (Omiya Station West Exit, Matsuyama Station and Nagasaki Station) plus two in Okinawa: Nago City and the Goya district (Okinawa City).
Media reports sometimes cite targets such as “100 sites nationwide.” However, as of writing, neither MLIT Road Bureau’s official Busta Project page nor the published materials of its promotion study council state a specific target number of sites. This article counts only the published site list and does not use any target figure. The promotion study council has met eight times, from its first meeting in September 2020 to its eighth in March 2026, and in June 2026 MLIT published the “Planning Guidelines for Strengthening the Functions of Transport Hubs, Ver 1.1.”
Room Stock Across the 13 Sites: 59,148 Rooms in 492 Properties, With the Top Two Holding 38%
Drawing a 1km radius around each site’s center point and totaling the lodging properties with a registered room count gives 492 properties and 59,148 rooms across the 13 sites. The 8 commissioned sites account for 48,424 rooms (82%) and the 5 sites under study for 10,724 rooms (18%).
The distribution is extremely skewed. The largest is Sapporo Station with 12,801 rooms, followed by Busta Shinjuku (9,915), Kobe Sannomiya Station (8,746) and Shinagawa Station West Exit (7,614). These top four alone account for 66% of the total. At the other end, Oppama Station has just 41 rooms (3 properties), followed by the Goya district (451), Nago City (672) and Kure Station (1,095). All of them carry the same “Busta” label, yet the depth of the surrounding lodging market differs by a factor of more than 300.
Average property size also reveals structural differences. Shinagawa Station West Exit stands out at 380.7 rooms per property, reflecting its cluster of large full-service hotels. By contrast, the Goya district averages 13.3 rooms and Oppama Station 13.7, dominated by ryokan and small inns. Areas where property counts are high but room counts do not follow, such as Nagasaki Station (4,137 rooms in 65 properties, averaging 63.6) and the Goya district (451 rooms in 34 properties), suggest that the market is not yet mature enough to absorb large hotel floors. We applied the same lens (how many rooms sit within a radius of a transport node) to highway interchanges in our analysis of room stock within 10km of 50 smart interchanges under development, which shows how the depth of supply varies by hub type.
| Site | Prefecture | Status | Properties | Rooms | Avg. rooms | Est. settled ADR | OCC | Largest property |
|---|---|---|---|---|---|---|---|---|
| Busta Shinjuku (Shinjuku Sta. South Exit) | Tokyo | Operating (Apr 2016) | 55 | 9,915 | 180.3 | ¥17,459 | 93.1% | Keio Plaza Hotel (京王プラザホテル) / 1,438 rooms |
| Shinagawa Sta. West Exit | Tokyo | Commissioned (Apr 2019) | 20 | 7,614 | 380.7 | ¥23,348 | 93.1% | Shinagawa Prince Hotel (品川プリンスホテル) / 2,384 rooms |
| Oppama Sta. | Kanagawa | Commissioned (Apr 2021) | 3 | 41 | 13.7 | — | 85.6% | Natsushimaen (夏島園) / 16 rooms |
| Niigata Sta. | Niigata | Commissioned (Apr 2020) | 34 | 5,865 | 172.5 | ¥6,931 | 85.3% | APA Hotel & Resort Niigata Ekimae Odori (アパホテル&リゾート〈新潟駅前大通〉) / 1,001 rooms |
| Kintetsu Yokkaichi Sta. | Mie | Commissioned (Apr 2021) | 26 | 2,347 | 90.3 | ¥7,412 | 82.7% | Toyoko Inn Kintetsu Yokkaichi Station North Exit (東横INN近鉄四日市駅北口) / 220 rooms |
| Kobe Sannomiya Sta. | Hyogo | Commissioned (Apr 2020) | 84 | 8,746 | 104.1 | ¥11,746 | 88.7% | Toyoko Inn Kobe Sannomiya No.2 (東横INN神戸三ノ宮2) / 335 rooms |
| Kure Sta. | Hiroshima | Commissioned (Apr 2021) | 27 | 1,095 | 40.6 | ¥6,152 | 86.8% | Toyoko Inn Kure Station (東横イン呉駅) / 218 rooms |
| Sapporo Sta. | Hokkaido | Commissioned (Apr 2023) | 76 | 12,801 | 168.4 | ¥15,249 | 92.3% | Sapporo Hotel by Granbell (札幌ホテル by グランベル) / 605 rooms |
| Omiya Sta. West Exit | Saitama | Under study | 27 | 3,183 | 117.9 | ¥10,025 | 87.6% | Toyoko Inn Omiya Station East Exit (東横INN大宮駅東口) / 382 rooms |
| Matsuyama Sta. | Ehime | Under study | 23 | 2,281 | 99.2 | ¥7,596 | 84.6% | APA Hotel Matsuyama-shi Ekimae (アパホテル〈松山市駅前〉) / 213 rooms |
| Nago City | Okinawa | Under study | 18 | 672 | 37.3 | ¥8,407 | 91.0% | Green Rich Hotel Okinawa Nago (グリーンリッチホテル沖縄名護) / 155 rooms |
| Nagasaki Sta. | Nagasaki | Under study | 65 | 4,137 | 63.6 | ¥8,930 | 81.7% | Toyoko Inn Nagasaki Ekimae (東横INN長崎駅前) / 418 rooms |
| Goya district (Okinawa City) | Okinawa | Under study | 34 | 451 | 13.3 | ¥6,792 | 91.0% | Hotel Koza (ホテル コザ) / 80 rooms |
Where the 13 Sites Are, and How Much Room Stock Surrounds Them
Plotting the 13 sites on a map shows hubs from Sapporo in the north to Nago in the south, with completely different population sizes and rail network densities, all sitting within the same program framework. Circle size represents the number of rooms within a 1km radius.
A 3.8x Gap in Earning Power: Estimated Settled ADR From ¥23,300 Down to ¥6,200
Whether to stack hotel floors above a terminal ultimately comes down to the revenue those floors generate. Lining up estimated settled ADR for the 13 sites (median of property-level averages, September 2025–August 2026), the highest is about ¥23,300 at Shinagawa Station West Exit (N=14 properties) and the lowest about ¥6,200 at Kure Station (N=15 properties), a 3.8x spread. Busta Shinjuku follows at about ¥17,500, Sapporo Station at about ¥15,200 and Kobe Sannomiya Station at about ¥11,700. Below Omiya Station West Exit at about ¥10,000, the rest cluster in the ¥6,000–¥9,000 range.
Factoring in occupancy widens the gap further. Prefecture-level OCC (July 2026) ranges by more than 10pt: Tokyo 93.1%, Hokkaido 92.3%, Okinawa 91.0% and Hyogo 88.7%, against Nagasaki 81.7% and Mie 82.7%. On a RevPAR basis (ADR × OCC), Shinagawa Station West Exit earns about ¥21,700 against about ¥5,300 at Kure Station, a 4.1x gap.
A scatter plot of room stock against rate shows Shinagawa, Shinjuku, Sapporo and Sannomiya clustered in the upper right (deep stock, high rates), with Oppama, Goya, Nago and Kure in the lower left (thin stock, low rates). Omiya, Nagasaki, Niigata, Matsuyama and Yokkaichi sit in between. The two measures correlate cleanly, which shows that the depth of room stock works as a proxy for the depth of demand.
A Gap That Zero Land Cost Cannot Close: Modeling Air-Rights Yields
The defining investment feature of Busta-type development is that floor area is created without acquiring land. Because the floors are secured above existing roads and station plazas, or through rights conversion in urban redevelopment projects, the burden of land cost, which in a standalone development can make up more than half of total investment, is greatly reduced. So at which hubs does that advantage actually matter?
We set up a simple model. For construction cost, we took MLIT’s Construction Starts Statistics 2025 actual (steel frame: ¥2.405 million per tsubo), multiplied it by 40㎡ of gross floor area per room (about 12 tsubo, including common areas), and added one year of +5% inflation assuming completion around 2027, giving about ¥30.3 million per room. The land share was calculated by multiplying the median commercial land price at each site by the land area implied by dividing 40㎡ of floor area per room by the maximum floor area ratio. For GOP, we used a conservative 40% of room revenue.
The results are clear. Yield on construction cost alone (the air-rights model) runs 10.5% at Shinagawa Station West Exit, 7.8% at Busta Shinjuku, 6.8% at Sapporo Station and 5.0% at Kobe Sannomiya Station. Below Omiya Station West Exit at 4.2%, the remaining 8 sites sink to 2.6–3.7%. Given the returns typically required of development projects, there is a clear step between the top four or five sites and the rest.
More importantly, the size of the “air-rights benefit” itself differs by an order of magnitude from hub to hub. Comparing against yields that include the land share, the difference is large at Shinagawa Station West Exit (+4.2pt), Busta Shinjuku (+3.5pt) and Sapporo Station (+1.2pt). At Niigata Station, Kintetsu Yokkaichi Station and Matsuyama Station, it is only +0.1pt, and at Kure Station, Nago City and the Goya district only about +0.2pt. Where land prices are low, land is only a small fraction of total investment to begin with, so building in air-rights space barely improves the economics.
| Site | Annual room revenue / room | GOP / room | Land share / room | Total investment / room | Air-rights model | Including land |
|---|---|---|---|---|---|---|
| Busta Shinjuku (Shinjuku Sta. South Exit) | ¥5,932,710 | ¥2,373,084 | ¥25,236,364 | ¥55,536,364 | 7.8% | 4.3% |
| Shinagawa Sta. West Exit | ¥7,934,005 | ¥3,173,602 | ¥20,342,857 | ¥50,642,857 | 10.5% | 6.3% |
| Oppama Sta. | — | — | ¥1,880,000 | — | — | — |
| Niigata Sta. | ¥2,157,880 | ¥863,152 | ¥1,656,667 | ¥31,956,667 | 2.8% | 2.7% |
| Kintetsu Yokkaichi Sta. | ¥2,237,450 | ¥894,980 | ¥621,000 | ¥30,921,000 | 3.0% | 2.9% |
| Kobe Sannomiya Sta. | ¥3,802,935 | ¥1,521,174 | ¥4,755,556 | ¥35,055,556 | 5.0% | 4.3% |
| Kure Sta. | ¥1,949,100 | ¥779,640 | ¥1,573,333 | ¥31,873,333 | 2.6% | 2.4% |
| Sapporo Sta. | ¥5,137,375 | ¥2,054,950 | ¥6,450,000 | ¥36,750,000 | 6.8% | 5.6% |
| Omiya Sta. West Exit | ¥3,205,430 | ¥1,282,172 | ¥4,605,714 | ¥34,905,714 | 4.2% | 3.7% |
| Matsuyama Sta. | ¥2,345,490 | ¥938,196 | ¥1,460,000 | ¥31,760,000 | 3.1% | 3.0% |
| Nago City | ¥2,792,250 | ¥1,116,900 | ¥1,591,000 | ¥31,891,000 | 3.7% | 3.5% |
| Nagasaki Sta. | ¥2,663,040 | ¥1,065,216 | ¥3,526,667 | ¥33,826,667 | 3.5% | 3.1% |
| Goya district (Okinawa City) | ¥2,256,065 | ¥902,426 | ¥1,650,000 | ¥31,950,000 | 3.0% | 2.8% |
Sensitivity Analysis 1: Three Scenarios With Shifted Assumptions
The model above is a point estimate using single values for construction cost, GOP margin and ADR. In practice, all three can move in the same direction, so a range is needed. The pessimistic case assumes construction cost +10% (¥33.33 million per room), a 35% GOP margin and ADR −5%. The optimistic case assumes construction cost −5% (¥28.79 million per room), a 45% GOP margin and ADR +5%. The base case keeps the assumptions used above (¥30.3 million per room, 40% GOP, measured ADR). All figures are air-rights model yields (excluding land share).
| Site | Pessimistic | Base | Optimistic | Range |
|---|---|---|---|---|
| Shinagawa Sta. West Exit | 7.9% | 10.5% | 13.0% | 5.1pt |
| Busta Shinjuku (Shinjuku Sta. South Exit) | 5.9% | 7.8% | 9.7% | 3.8pt |
| Sapporo Sta. | 5.1% | 6.8% | 8.4% | 3.3pt |
| Kobe Sannomiya Sta. | 3.8% | 5.0% | 6.2% | 2.4pt |
| Omiya Sta. West Exit | 3.2% | 4.2% | 5.3% | 2.1pt |
| Nagasaki Sta. | 2.7% | 3.5% | 4.4% | 1.7pt |
| Kure Sta. | 1.9% | 2.6% | 3.2% | 1.3pt |
The ranking does not change. Even in the pessimistic case, Shinagawa Station West Exit holds 7.9% and Busta Shinjuku 5.9%, while Kure Station reaches only 3.2% even in the optimistic case. Because the range scales with ADR, it is 5.1pt at Shinagawa Station West Exit and 1.3pt at Kure Station, so conclusions for top-tier hubs are more sensitive to the assumptions. Put the other way, no matter how optimistic the assumptions, the bottom 8 sites do not reach the break-even line for hotel floors. That is what makes this article’s conclusion robust.
Sensitivity Analysis 2: ADR × OCC Grid
Breaking it down one step further, we fix construction cost at ¥30.3 million per room and the GOP margin at 40%, and look at how combinations of ADR and OCC move the air-rights model yield. Darker shading indicates higher yield.
| Est. settled ADR \ OCC | 80.0% | 84.5% | 88.0% | 91.5% | 95.0% |
|---|---|---|---|---|---|
| ¥6,000 | 2.3% | 2.4% | 2.5% | 2.6% | 2.7% |
| ¥10,000 | 3.9% | 4.1% | 4.2% | 4.4% | 4.6% |
| ¥14,000 | 5.4% | 5.7% | 5.9% | 6.2% | 6.4% |
| ¥18,000 | 6.9% | 7.3% | 7.6% | 7.9% | 8.2% |
| ¥23,000 | 8.9% | 9.4% | 9.8% | 10.1% | 10.5% |
The takeaway is that ADR matters far more than OCC. Moving ADR from ¥6,000 to ¥23,000 shifts yield by more than 8pt, from 2.3% to 10.5%. Raising OCC by 15pt, from 80% to 95%, moves yield by only 0.4–1.6pt at the same ADR level. In our measurements, OCC across the 13 sites falls within an 11.4pt band of 81.7–93.1%, so the gap between hubs is driven almost entirely by ADR. Whether hotel floors can be stacked above a terminal is decided first by the rate the hub can command, not by how far occupancy can be pushed.
Where Hotel Floors Made It Into the Plans, and Where They Did Not
How well does the model line up with real plans? Comparing three published project plans makes the location of the dividing line clear.
Hotel floorsKobe Sannomiya Sta.
Kobe Sannomiya Kumoidori 5-chome Type 1 Urban Redevelopment Project. A mixed-use complex of 32 floors above ground, about 163m tall with about 99,000㎡ of floor area, with the new bus terminal “Busta Kobe Sannomiya,” a cultural hall and a library on the lower floors, offices on the middle floors and a hotel on the upper floors. Completion is scheduled for December 2027. Our building-plan data also shows a hotel use of about 70 rooms on the same block. Estimated settled ADR is about ¥11,700 and air-rights yield 5.0%.
Hotel floorsSapporo Sta.
Sapporo Station Exchange Hub, Kita 5 Nishi 1 and Nishi 2 Districts Urban Redevelopment Project. Nishi 2-chome, centered on retail and the bus terminal, is set for completion in FY2030. Nishi 1-chome, a 43-story tower about 245m tall including offices and hotels, is set for completion in FY2034. The bus terminal will be on the lower floors, with hotels under two brands planned for the middle floors and the top floors. Estimated settled ADR is about ¥15,200 and air-rights yield 6.8%.
No hotel floorsKure Sta.
Kure Station Area Comprehensive Development. District A is the transport terminal. District B is a 7-story mixed-use building (1F bus terminal, 2F–4F retail and offices, 5F medical mall, 5F–6F childcare support, 6F futsal court). District C is a 20-story residential tower (184 units, including 30 rental units for seniors). It is scheduled to open in 2027, and hotel floors are not part of the plan. Estimated settled ADR is about ¥6,200 and air-rights yield 2.6%, the lowest of the 13 sites.
The three cases line up exactly in the order the model predicts. At Sapporo Station and Kobe Sannomiya Station, where air-rights yields exceed 5%, hotel floors made it into the plans. At Kure Station, at 2.6%, high public-benefit uses (medical, childcare support and housing) were chosen instead. This is in no way a judgment on the Kure plan. When construction costs are heavy relative to the earning power that ADR and OCC indicate, housing and public floors meet local needs more reliably and are easier to fill. The natural reading is that the project sponsors made exactly that call.
At Shinagawa Station West Exit as well, a hotel is planned in District A (scheduled to open in FY2029) alongside offices, retail and MICE facilities, and District B-1 is also envisioned as a mix of offices, hotel and housing. Its estimated settled ADR of about ¥23,300 and air-rights yield of 10.5%, the highest of the 13 sites, are consistent with these plans.
Measuring Location Fundamentals: Land Prices, Floor Area Ratios, Station Ridership and Employment
Underpinning each floor’s earning power is the volume of demand. Setting station ridership from National Land Numerical Information (FY2023) alongside employee counts from the Economic Census (1km radius) shows how deep the demand base is at each hub.
Among core stations, Shinjuku Station is far ahead with 1.934 million passengers per day, followed by Shinagawa Station (853,000), Sannomiya (615,000 across the three stations JR Sannomiya, Kobe-Sannomiya and subway Sannomiya), Sapporo (324,000 across JR Sapporo Station and the subway’s Sapporo Station) and Omiya Station (172,000). Nago City and the Goya district, on the other hand, have no rail station within 1.5km at all. Reflecting transport conditions on Okinawa Island, both are pure bus hubs outside the monorail network. For these two sites, using rail ridership as a demand indicator is not appropriate in the first place.
By employment, the Shinjuku Station South Exit area is the largest with 299,000 employees (10,294 establishments, 31.9% office-type), followed by Sapporo Station (160,000), Kobe Sannomiya Station (139,000), Shinagawa Station West Exit (134,000) and Omiya Station West Exit (92,000). The higher a hub’s share of office-type employment, the deeper its base of business demand, in the order Shinjuku 31.9%, Shinagawa 33.2%, Sapporo 28.3%, Matsuyama 28.1% and Nagasaki 26.9%. By contrast, Oppama Station is at 7.1%, the Goya district 11.5% and Nago City 12.3%, trade areas centered on housing and daily-life services rather than business demand.
Land prices and floor area ratios define the value of the air-rights space itself. Median official commercial land prices are highest at Busta Shinjuku (¥6.94 million/㎡), followed by Shinagawa Station West Exit (¥3.56 million/㎡), Sapporo Station (¥1.29 million/㎡) and Kobe Sannomiya Station (¥1.07 million/㎡). Year-on-year, the top four show rises approaching double digits or higher: Shinagawa Station West Exit +17.1%, Busta Shinjuku +12.0%, Sapporo Station +9.4% and Kobe Sannomiya Station +8.3%. Kure Station (+0.8%), Matsuyama Station (+1.4%) and Nagasaki Station (+2.1%) are more subdued. Maximum designated floor area ratios are also highest at the top sites, at 1,100% for Busta Shinjuku, 900% for Kobe Sannomiya Station and 800% for Sapporo Station, meaning more floor area can be stacked.
| Site | Commercial land price (median) | YoY | Max. FAR | Core station ridership | Employees | Office-type share |
|---|---|---|---|---|---|---|
| Busta Shinjuku (Shinjuku Sta. South Exit) | ¥6,940,000 | +12.0% | 1100% | 1,934,214 | 299,387 | 31.9% |
| Shinagawa Sta. West Exit | ¥3,560,000 | +17.1% | 700% | 853,436 | 133,651 | 33.2% |
| Oppama Sta. | ¥188,000 | +2.2% | 400% | 37,879 | 17,223 | 7.1% |
| Niigata Sta. | ¥248,500 | +3.6% | — | 66,376 | 46,338 | 23.8% |
| Kintetsu Yokkaichi Sta. | ¥93,150 | +2.6% | 600% | 45,506 | 29,045 | 21.6% |
| Kobe Sannomiya Sta. | ¥1,070,000 | +8.3% | 900% | 614,743 | 138,567 | 21.2% |
| Kure Sta. | ¥236,000 | +0.8% | 600% | 17,914 | 15,841 | 12.3% |
| Sapporo Sta. | ¥1,290,000 | +9.4% | 800% | 324,340 | 160,223 | 28.3% |
| Omiya Sta. West Exit | ¥806,000 | +6.4% | 700% | 171,751 | 91,862 | 20.9% |
| Matsuyama Sta. | ¥182,500 | +1.4% | 500% | 15,159 | 27,779 | 28.1% |
| Nago City | ¥79,550 | +5.5% | 200% | No rail station | 4,646 | 12.3% |
| Nagasaki Sta. | ¥529,000 | +2.1% | 600% | 26,426 | 34,540 | 26.9% |
| Goya district (Okinawa City) | ¥165,000 | +5.8% | 400% | No rail station | 8,385 | 11.5% |
Demand-Side Support: Pooled Rates Across the 13 Sites Are Rising Year on Year
It is also worth confirming that the room rates behind the model are not a temporary blip. Overlaying the monthly median estimated settled ADR for all covered properties across the 13 sites, year by year, shows seasonality and changes in level at the same time.
In 2026, ADR was about ¥9,500 in January (+11.1% YoY), about ¥10,100 in February (+6.2%) and about ¥10,000 in March (+7.1%), running above the prior year throughout the first half. Only April, at about ¥8,900, came in slightly below the prior year. From May onward it moved back into positive territory, at +1.2% in May, +0.4% in June and +2.2% in July. August peaked for the year at about ¥11,300, essentially flat year on year at −1.6%.
The seasonal pattern is clear, with August as the peak and January and April as the troughs in every year. This shape is consistent with the 13 sites being transport hubs driven by business and travel demand rather than tourist destinations. The small swing across the year also makes it easier to forecast revenue when placing hotel floors above a terminal.
Conclusion: Three Conditions for Hotel Floors Above a Transport Hub
Based on our measurements at the 13 sites, the conditions for hotel floors to work in the space above a transport hub come down to three points.
1. Estimated settled ADR of ¥10,000 or more
Shinagawa, Sapporo and Kobe Sannomiya, where hotel floors are in the plans, are all at ¥11,700 or above. Omiya Station West Exit at ¥10,000 is the effective watershed, and at the 8 sites below it, room revenue struggles to keep up with construction costs. Conversely, hubs above this level also have deep existing stock, meaning demand is already proven, so risk is relatively low.
2. Commercial land prices of ¥1 million/㎡ or more
The benefit of building in air-rights space (avoiding land cost) adds 1pt or more to yield only at Shinagawa, Shinjuku, Sapporo and Kobe Sannomiya, where median land prices exceed ¥1 million/㎡. At hubs with low land prices, building in air-rights space adds almost nothing to the investment case, and the project’s aim shifts from economics toward meeting local needs.
3. 3,000 or more rooms within a 1km radius
The three sites with hotel floors in the plans all have more than 7,600 rooms, and Omiya Station West Exit has 3,183. At hubs with existing stock below 3,000 rooms, the market is likely not yet deep enough to absorb large hotel floors. In those cases, a separate framework is needed to assess room for small-scale or specialized entry.
Of the 13 sites, four meet all three conditions: Shinagawa Station West Exit, Busta Shinjuku, Sapporo Station and Kobe Sannomiya Station. Omiya Station West Exit meets conditions 1 and 3 and is close on condition 2, making it worth watching as the next frontier. Among the 5 sites under study, the four other than Omiya Station West Exit (Matsuyama Station, Nago City, Nagasaki Station and the Goya district) have more upside in building small-scale lodging into a mix anchored by housing, public-benefit and retail uses, rather than making hotel floors the main use.
The implication for development professionals is clear. Busta-type air-rights space is rare in that it offers floor area without buying land, but that rarity turns into investment returns only in high-land-price urban areas. When looking for sites at regional hubs, it is faster to first assess the depth of surrounding room stock and ADR levels than to spend effort acquiring air-rights. For funds and regional banks tracking PPP projects, the first-pass screening metric is not the news of a project being commissioned, but whether that hub’s room rates exceed ¥10,000.
Related Articles
- Naniwasuji & Haneda Access Lines 2031: Hotel Investment Timelines
- Shinkansen 15 Stations × Hotel ADR: Does the Direct-Access Premium Really Exist?
- Japan’s 50 Smart Interchanges: Median 1,130 Hotel Rooms Within 10km
- Urbannet Sapporo Link Tower: Mixed-Use GOP Split & Hyatt Centric 2026
References and Sources
■ Data sources
Room stock is the total of lodging properties with a registered room count located within a 1km radius of each site’s center point (N=492 properties). Estimated settled ADR is the median of property-level averages for September 2025–August 2026 (N=343 properties), and OCC is the prefecture-level value for July 2026. Official land prices and zoning are from the MLIT Real Estate Information Library (2026), station ridership from National Land Numerical Information FY2023, and employee and establishment counts from the Economic Census (1km radius). The site list is based on MLIT Road Bureau published materials (as of September 2026).
■ Model assumptions
Construction cost is about ¥30.3 million per room for all sites, calculated from the 2025 Construction Starts Statistics actual for steel frame (¥2.405 million/tsubo) × 40㎡ of floor area per room (about 12 tsubo, including common areas), plus one year of +5% inflation assuming completion around 2027. GOP is 40% of room revenue. Annual room revenue = estimated settled ADR × OCC × 365 days. Land share = median official commercial land price × (40㎡ of floor area ÷ maximum floor area ratio). Air-rights model yield = GOP ÷ construction cost; yield including land = GOP ÷ (construction cost + land share). Sensitivity analysis shows the range through three scenarios (construction cost +10% to −5%, GOP margin 35–45%, ADR ±5%) and an ADR × OCC grid.
■ Limitations and caveats
Estimated settled ADR is an estimate that applies property-type adjustments to publicly listed OTA prices and differs from each property’s actual transaction prices and accounting figures (median error of about 7% against property-level disclosures by listed hotel REITs). OCC is a prefecture-level estimate based on OTA sales inventory, not the occupancy of individual properties or of the 1km radius. Because room stock is based on properties with confirmed activity on OTAs, ryokan, minshuku and simple lodging not listed on OTAs are not included. The yield model is a simple model with common assumptions for all sites, and actual figures move significantly depending on rights conversion terms, cost-sharing for co-located public facilities, floor height and structural constraints, and operating structure (lease vs. management contract). Investment decisions require a site-specific feasibility study.
■ Market data
- MetroEngines Research & Consulting — Estimated settled ADR based on publicly listed OTA prices (N=343 properties), estimated occupancy (OCC), room stock aggregation (N=492 properties)
- MetroEngines Research & Consulting — Building-plan data (derived from MLIT’s Building Dynamics Statistics Survey, based on building confirmation applications)
■ Government and public data
- MLIT Road Bureau, “Busta Project” (Japanese)
- MLIT, “Busta Project Promotion Study Council” (meetings 1–8, 8th meeting held March 27, 2026) (Japanese)
- MLIT press release, “Guidelines for transport hubs formulated; Busta Project to be rolled out nationwide” (April 8, 2021) (Japanese)
- MLIT Real Estate Information Library — Official land prices (2026), zoning (Japanese)
- National Land Numerical Information, “Station Ridership” (FY2023)
- MLIT, “Construction Starts Statistics Survey” — Construction cost per tsubo (2025 actual: steel frame ¥2.405 million/tsubo, reinforced concrete ¥2.026 million/tsubo)
- Ministry of Internal Affairs and Communications and Ministry of Economy, Trade and Industry, “Economic Census” — Establishments and employees (1km radius)
■ Project plans and news coverage
- City of Kobe, “New Bus Terminal” (Kobe Sannomiya Kumoidori 5-chome Type 1 Urban Redevelopment Project) (Japanese)
- MLIT Sapporo Development and Construction Department, “National Route 5 Sapporo Station Transport Terminal Development” (Japanese)
- Travel Watch, “JR Hokkaido: ‘Sapporo Station Front Redevelopment’ on former ESTA site to complete in FY2034; bus terminal to open ahead from FY2030 onward” (Japanese)
- Chugoku Shimbun Digital, “Kure Station front redevelopment takes shape: frame reaches top floor of retail building, targeting 2027 opening” (Japanese)
- City of Niigata, “Niigata Station Bus Terminal Development Project” (Japanese)
- Keikyu Corporation, “(Tentative) Shinagawa Station West Exit District A New Construction Plan” (Japanese)