

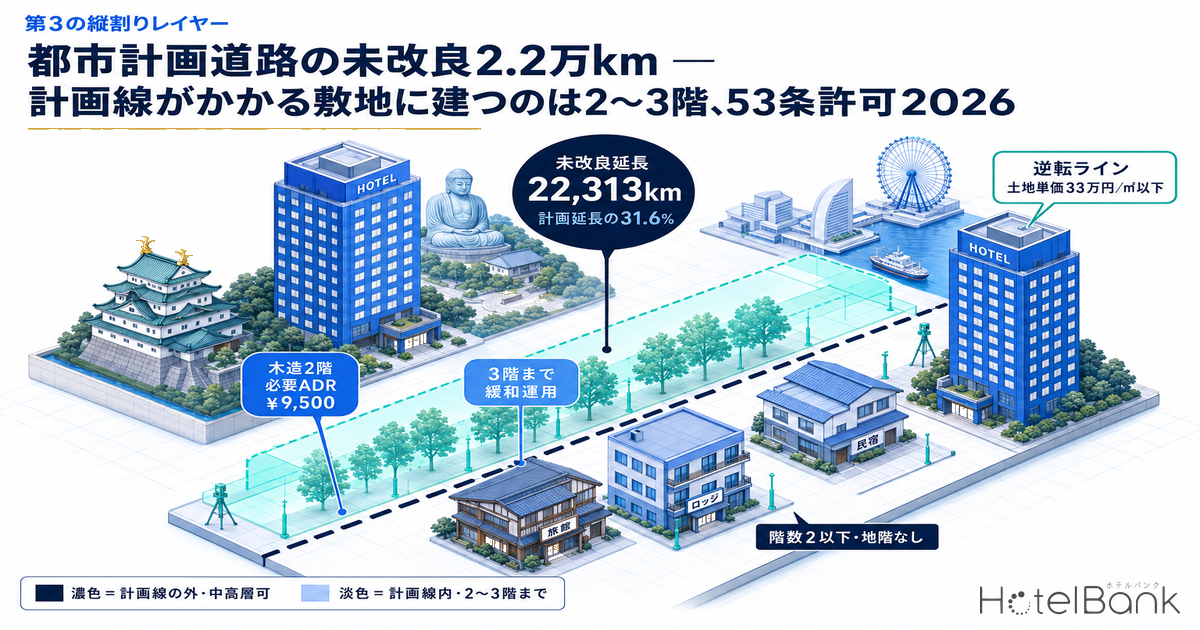
You check the zoning, you check the floor-area ratio and the height limits, and there are still sites where you cannot build. That is the case when the alignment of a planned city road (都市計画道路) crosses the site. Inside that area a permit under Article 53 of the City Planning Act (都市計画法53条) is required, and in principle only buildings that “can be easily relocated or removed” are allowed: no more than two storeys, no basement, and a timber or steel frame. A mid- or high-rise hotel stops before it ever reaches building confirmation.
This article covers that “third regulatory layer.” Height limits and below-ground obstacles such as soil contamination and buried cultural properties have been covered in earlier HotelBank pieces. The restriction that applies inside the area of planned urban facilities such as roads had not yet been covered, and this piece fills that gap. We totaled the national unimproved road length from the Ministry of Land, Infrastructure, Transport and Tourism (MLIT) “City Planning Status Survey,” compared how nine municipalities run their permit systems, and back-calculated which lodging formats work on a site crossed by a planned road and the ADR they require.
Metric Definitions Used in This Article
- Planned length: The length of planned city roads (all types combined) under a formal city planning decision.
- Improved length: The length of sections completed to the planned width and specification.
- Unimproved length: Planned length minus improved length. This article uses it as a rough measure of “length where the planned road alignment may still fall on private sites.” Sections MLIT separately counts as “roughly completed” (概成済: functioning as roads but not yet at the planned width) are included on the unimproved side, because the planned alignment still applies to them.
- ADR (Average Daily Rate): An estimated contracted rate (tax-excluded equivalent), calculated by applying format-specific adjustment factors to the lowest-priced plan level each property publishes on OTAs (per room, two guests, tax included). Checked against property-level results disclosed by listed hotel REITs (91 properties, most recent 3 months), the median error is about 7%. These are estimates and differ from each property’s actual contracted rates and accounting figures. The “required ADR” in this article is a back-calculated investment figure and a separate concept from these observed values.
- Data sources: MLIT “City Planning Status Survey” (as of March 31, 2024); MLIT “Review Status of Municipalities with Unstarted Planned City Roads” (as of end of March 2025); MetroEngines Research & Consulting
- — Japan’s planned city roads have 22,313km still unimproved, 31.6% of the planned length. If a planned alignment on these sections crosses a site, an Article 53 permit is required, separate from zoning and height limits.
- — The statutory standard is two storeys or fewer, no basement. However, all nine municipalities we could confirm from published documents allow up to three storeys, and three of them exclude priority routes. Checks must be made route by route, not city by city.
- — At a land price of ¥300,000/㎡, a two-storey timber hotel with 34 rooms needs an ADR of ¥9,500, below the ¥9,800 required by a seven-storey RC hotel with 114 rooms. The gap in unit construction cost outweighs the penalty of lost floor area.
- — The reversal holds at land prices of ¥330,000/㎡ or below. This crossover does not depend on occupancy or GOP margin, so the conclusion stands: the planned-road penalty remains in central commercial districts, while low-rise formats have the edge in regional and suburban markets.
- — 53.9% of municipalities have already abolished or changed plans, and over 80% including those still reviewing. As reviews progress the floor-area constraint is lifted, so their progress drives a site’s latent value.
Article 53 of the City Planning Act — Another Permit Before Building Confirmation
Under Article 53 of the City Planning Act, anyone who intends to build within the area of a planned urban facility or the implementation area of an urban development project must obtain a permit from the prefectural governor or equivalent authority. Planned urban facilities include roads, parks, rivers and sewers, but by both area and length the most widely distributed are planned city roads.
The permit standards are set out in Article 54, item 3 of the same Act. The national baseline has three elements: the building has no more than two storeys and no basement; its main structural parts are timber, steel, concrete block or a similar structure; and it is recognized as easy to relocate or remove. The idea behind the standard is a building that will not get in the way once the road project starts.
What this means is clear. No basement can be dug, and mid- or high-rise reinforced concrete is not allowed. The standard form of an urban limited-service hotel — “RC frame, a dozen-plus floors above ground, full use of the floor-area ratio” — drops off the list of options once a planned alignment touches the site. Even if the zoning is commercial and the floor-area ratio is 600%, this restriction applies independently, from a separate system. That is why we call it a third layer alongside use and height regulations. Read together with Hotel Development Capacity 2026: Zoning, FAR & Land Price in 5 Markets, which asks the same question from the zoning and floor-area-ratio side, it gives a three-dimensional view of how many layers of restriction can stack on a single site.
Three-Storey Allowances Are Spreading — Permit Standards in Nine Municipalities
Not every municipality keeps strictly applying the statutory baseline. For routes where no project start is in sight for a long time, rules raising the storey limit to three have been introduced in many places. The table below lists the standards of the nine municipalities we were able to confirm from published documents.
| Municipality | Storey limit | Height limit | Scope and conditions | In effect since |
|---|---|---|---|---|
| Sendai | 3 storeys | — | Sections not designated as high priority under the “New Arterial Road Network” plan | Feb 2011 |
| Sasebo | 3 storeys | — | Areas where a considerable period has passed since the decision and no project start is expected in the near future | Aug 2014 |
| Kamakura | 3 storeys | — | Planned city road areas and urban redevelopment project areas. In high-intensity use districts, three storeys may not be possible because of the floor-area ratio | Mar 2015 |
| Chofu | 3 storeys | 10m | All planned city road areas, including priority routes (unstarted areas) | Apr 2016 |
| Nagoya | 3 storeys | — | Areas not designated as priority routes under the “Second Development Program,” etc. An area confirmation document must be submitted in advance | Mar 2017 |
| Yokohama | 3 storeys | 12m | Areas where no project approval has been publicly announced. Separate relaxations for completed roads and setback garages | — |
| Meguro City | 3 storeys | 10m | Within planned city road areas | — |
| Nakano City | 3 storeys | 10m | Three storeys or fewer in planned city roads. Differs by facility type: three storeys or fewer in planned parks, two or fewer in planned rivers | — |
| Edogawa City | 3 storeys | 10m | Planned city road areas. Priority routes are excluded from this relaxation and follow the Article 54 standard | — |
Source: Compiled by MetroEngines Research & Consulting from published documents of each municipality (municipal websites, viewed September 2026) (N=9 municipalities)
Broadly, the relaxation schemes fall into three types. The first draws the line by development priority (Sendai, Nagoya, Edogawa). On sections designated as priority routes the statutory two-storey standard is kept, and three storeys are allowed elsewhere. The second draws the line by elapsed time and the likelihood of a project start (Sasebo): a considerable period must have passed since the decision, and no project start must be expected in the near future. The third allows three storeys across the board without limiting the area (Chofu, Yokohama, Meguro, Nakano, Kamakura).
For pre-acquisition screening, the first type matters most in practice. Because the storey limit can change route by route within the same city, the check has to go beyond “does this city allow three storeys?” down to “is this route designated as a priority route?” Nagoya’s requirement to submit an area confirmation document in advance is exactly the procedure for the city to fix this line. Some municipalities, like Nakano, also set different storey limits for roads, parks and rivers, so the answer changes depending on whether it is a road or a river that crosses the site.
Source: Compiled by MetroEngines Research & Consulting from published municipal documents
22,313km Unimproved Nationwide — Planned Alignments Remain on 31.6% of the Plan
So how large is the area this restriction could apply to? We totaled all 47 prefectural files of the MLIT “City Planning Status Survey” (as of March 31, 2024). Nationwide, planned city roads (all types combined) have a planned length of 70,598.6km, of which 48,285.9km is improved. The remaining unimproved length is 22,313km, or 31.6% of the planned length. Of this, 8,140.8km is “roughly completed” — sections that broadly function as roads but have not reached the planned width — and the planned alignment still covers the parts to be widened.
Ranked by unimproved length, the top prefectures overlap with population centers. Aichi (1,156.7km), Tokyo (1,129.8km) and Chiba (1,101.0km) each exceed 1,000km. However, absolute length scales with prefectural area and total planned length, so the ratio is what matters for investment decisions. By unimproved ratio, Shiga (53.6%), Gifu (46.5%), Nara (43.7%), Tokushima (43.5%) and Mie (43.3%) top the list, with more than 40% of their plans still unimproved. By contrast, Okinawa (14.0%), Shimane (15.8%) and Hiroshima (17.7%) are well advanced, and the chance of hitting a planned alignment there is relatively low.
Source: Compiled by MetroEngines Research & Consulting from MLIT “City Planning Status Survey” (as of March 31, 2024) (all 47 prefectures totaled; top 20 by unimproved length shown)
One caution on how to read this. A long unimproved length does not mean the market is hard to use. Planned city roads are decided along major traffic corridors, so a region with a long unimproved length is also a region where “relatively more land along arterial roads has not yet been intensively developed.” For roadside or suburban lodging, a planned alignment is a landmine to avoid, but it is also the reason land comes up at lower prices. In fact, the low-rise, small-room-count roadside hotel models that HotelBank has examined elsewhere are structurally a good fit with the Article 53 permit standard.
Formats That Work at Two Storeys Now Make Up 56.6% of New Supply
Which lodging formats meet the conditions of two to three storeys, no basement, and a timber or steel frame? Checking against our new-opening data, these conditions match the most common opening format in Japan today.
Among the 1,425 properties confirmed as opening in 2026, vacation rentals (貸別荘) lead with 683, followed by cottages (65), minshuku guesthouses (23), pensions (14), glamping sites (13) and lodges (8). These formats, typically single-storey to two-storey, total 806 properties, or 56.6% of the whole. The pattern was the same in 2025, when 961 of 1,743 openings (55.1%) fell into this group. The average room count of new openings was 26 rooms in 2026 and 24 in 2025. In volume terms, the center of the market is already on the low-rise, small-scale side.
Source: MetroEngines Research & Consulting (based on confirmed OTA listings, confirmed 2026 openings N=1,425 properties)
These figures do have an observation limit. The opening data is based on confirmed OTA listings, and listings only appear a few months before opening, so counts for the latest months will rise as more listings appear. The 2026 monthly breakdown — 241 in January falling to around 20 a month from September onward — reflects this observation lead time, not a slowdown in supply, and the full-year total will grow from here. The category mix should also be read on the assumption that the base will expand.
Conversely, formats that assume mid- or high-rise buildings — 188 business hotels and 43 city hotels — together account for only 16.2% of the total. A realistic way to frame a site crossed by a planned road is not “land where hotels can’t be built,” but “land where you can build in the form that 806 of 1,425 openings have taken.”
Required ADR Back-Calculation — Two-Storey Timber at ¥9,500 Beats Seven-Storey RC at ¥9,800
This is the core of the investment decision. On a site where floor area cannot be stacked, how much heavier does land cost per room become, and how high does the ADR needed to make it work rise? We modeled four cases on a common 1,000㎡ site.
The assumptions are as follows: 35㎡ of gross floor area per room including common areas, 75% occupancy (full-year, model assumption), a 45% GOP margin and a 5% target NOI yield. For the GOP margin we took a point between the 38.9% actually achieved across 91 operating properties disclosed by Invincible Investment Corporation (fiscal period ended December 2024) and the industry benchmark of 50–60% for limited-service hotels (Invincible Investment Corporation IR presentation), and conservatively adopted 45% given the operating efficiency of low-rise, small-room-count properties. Construction cost per tsubo uses the 2025 structure-specific averages for hotel and ryokan use based on MLIT’s “Statistics on Building Construction Starts” (RC ¥2.026 million, steel ¥2.405 million, timber ¥1.382 million). The 35㎡-per-room assumption is examined in detail in a separate HotelBank analysis that back-calculated per-room construction cost from 31 actual building plans.
| Case | Floor area | Rooms | Construction cost | Total investment / room | Required ADR |
|---|---|---|---|---|---|
| A. No planned road / RC, 7 storeys (400% FAR used) | 4,000㎡ | 114 | ¥2.45bn | ¥24.1m | ¥9,800 |
| C. Municipality allowing 3 storeys / steel, 3 storeys | 1,800㎡ | 51 | ¥1.31bn | ¥31.3m | ¥12,700 |
| B. Statutory standard / steel, 2 storeys | 1,200㎡ | 34 | ¥0.87bn | ¥34.2m | ¥13,900 |
| W. Statutory standard / timber, 2 storeys | 1,200㎡ | 34 | ¥0.50bn | ¥23.4m | ¥9,500 |
Assumptions: 1,000㎡ site, land price ¥300,000/㎡, 35㎡ per room, 75% occupancy (full-year, model assumption), 45% GOP margin, 5% target NOI yield. Source: Modeled by MetroEngines Research & Consulting from MLIT “Statistics on Building Construction Starts” (2025, cost per tsubo by structure) and Invincible Investment Corporation disclosures
The result is counterintuitive. Looking at land cost per room alone, Case B with a planned road balloons 3.3 times, from ¥2.62 million to ¥8.75 million. That is natural: the same land cost is spread over fewer rooms because floor area cannot be stacked. Yet in total investment per room, Case W (timber, 2 storeys) is the lightest at ¥23.4 million, below Case A (RC, 7 storeys) at ¥24.1 million. The required ADR is also lower — ¥9,500 versus ¥9,800 — so the two-storey timber hotel works at a lower rate.
The reason lies in unit construction cost. Timber at ¥1.382 million per tsubo is only 68% of RC (¥2.026 million) and 57% of steel (¥2.405 million). There is a range in which the construction-cost advantage of a lighter structure outweighs the land-cost penalty of lost floor area. This is the structural reason investment opportunities arise on sites crossed by planned roads.
Source: Modeled by MetroEngines Research & Consulting (same assumptions as the table above; only the land price varies)
This reversal does have a valid range, though. Solving for the crossover by varying the land price, the two-storey timber case beats the seven-storey RC case at roughly ¥330,000/㎡ or below. Above that, land cost outweighs the construction-cost gap and Case A, which can stack floor area, takes the lead. At ¥1 million/㎡ the gap widens: required ADR is ¥12,300 for Case A, versus ¥17,800 for Case W and ¥22,200 for Case B. Put simply, hitting a planned road has a large impact in central commercial districts and a small one in regional and suburban areas.
The value of a three-storey allowance can also be quantified here. Compared with Case B, Case C (steel, 3 storeys) increases the room count by 50% from 34 to 51, and lowers the required ADR by 8.6% from ¥13,900 to ¥12,700. In markets with rules like those of the nine municipalities in the table above, the viability threshold loosens by close to 10% for the same planned road. That is the practical reason to check the municipality’s permit standards at the site-screening stage. How realistic a three-storey limit is for timber is a structural question; HotelBank’s separate analysis of 7,432 building starts, which measured the storey heights actually reached by each structure type, found that timber construction typically tops out at three storeys.
Three Scenarios and Two-Axis Sensitivity — How Far Required ADR Can Swing
The required ADRs so far are point estimates based on a single set of assumptions: 75% occupancy (full-year, model assumption), a 45% GOP margin and a 5% target NOI yield. In actual site screening, you also need to see how far the result swings when operating assumptions miss. The first table below varies the operating assumptions across three levels.
| Scenario | Assumptions | W. Timber, 2 storeys 34 rooms |
B. Steel, 2 storeys 34 rooms |
C. Steel, 3 storeys 51 rooms |
A. RC, 7 storeys 114 rooms |
|---|---|---|---|---|---|
| Downside | 65% occupancy (full-year), 40% GOP, construction cost +10.6% | ¥13,100 | ¥19,400 | ¥17,900 | ¥13,900 |
| Base | 75% occupancy (full-year), 45% GOP, 2025 actual costs | ¥9,500 | ¥13,900 | ¥12,700 | ¥9,800 |
| Upside | 85% occupancy (full-year), 50% GOP, 2025 actual costs | ¥7,500 | ¥11,000 | ¥10,100 | ¥7,800 |
Source: Modeled by MetroEngines Research & Consulting from MLIT “Statistics on Building Construction Starts” (2025, cost per tsubo by structure) and Turner & Townsend construction cost forecasts
Even in the downside scenario the ranking does not change: two-storey timber (¥13,100) still comes in below seven-storey RC (¥13,900). Because occupancy and GOP margin apply in the same proportion to both cases, which structure wins is decided not by operating assumptions but only by the relationship between land price and unit construction cost. Put the other way, both cases fail at the same time on the downside; having a planned road on the site does not create a difference in downside resilience.
Next, we expanded the required ADR for the two-storey timber case along two axes: land price and occupancy. The further toward the top left (low land price, high occupancy), the lower the viability threshold.
| Occupancy \ Land price | ¥100k/㎡ | ¥200k/㎡ | ¥300k/㎡ | ¥500k/㎡ | ¥700k/㎡ | ¥1m/㎡ |
|---|---|---|---|---|---|---|
| 65% | ¥8,200 | ¥9,600 | ¥11,000 | ¥13,700 | ¥16,400 | ¥20,500 |
| 70% | ¥7,600 | ¥8,900 | ¥10,200 | ¥12,700 | ¥15,200 | ¥19,000 |
| 75% (base assumption) | ¥7,100 | ¥8,300 | ¥9,500 | ¥11,900 | ¥14,200 | ¥17,800 |
| 80% | ¥6,700 | ¥7,800 | ¥8,900 | ¥11,100 | ¥13,300 | ¥16,700 |
| 85% | ¥6,300 | ¥7,300 | ¥8,400 | ¥10,500 | ¥12,600 | ¥15,700 |
Source: Modeled by MetroEngines Research & Consulting (same assumptions as Table 2; only occupancy and land price vary)
There are two ways to read this. First, required ADR is inversely proportional to occupancy, so a 10-point drop in occupancy from 75% to 65% raises required ADR by about 15%. At ¥300,000/㎡ that is a move from ¥9,500 to ¥11,000 — roughly the same burden as the land price rising by ¥100,000/㎡ on the same site. The accuracy of operating assumptions carries as much weight as the accuracy of land pricing.
Second, the ¥330,000/㎡ crossover with the seven-storey RC case does not change in any row of this table. Occupancy and GOP margin apply equally to both cases, so the ratio-driven crossover is independent of operating assumptions. It also means that at the site-screening stage, you can make a first call on low-rise versus mid/high-rise suitability from the land price alone, before pinning down occupancy.
Factoring In Construction Inflation Raises Required ADR by Just Under 10%
The tables above are models based on actual 2025 building-start statistics. Real development takes several years for design, building confirmation and construction, so the rise in construction cost between groundbreaking and completion needs to be factored in.
Turner & Townsend’s construction cost forecast puts Japan’s annual increase at +5.6% in 2025, +5.3% in 2026 and +5.0% in 2027, and expects costs to stay elevated after 2027 even as the pace of increase eases. Assuming a 2028 opening and a 12-month build, the construction midpoint falls in mid-2027, implying an increase of about 10.6% over the two years from mid-2025. The required ADRs with this reflected are as follows.
| Case | Construction cost (2025 actual) | Required ADR | Construction cost (after inflation) | Required ADR |
|---|---|---|---|---|
| A. RC, 7 storeys | ¥2.45bn | ¥9,800 | ¥2.71bn | ¥10,700 |
| C. Steel, 3 storeys | ¥1.31bn | ¥12,700 | ¥1.45bn | ¥13,800 |
| B. Steel, 2 storeys | ¥0.87bn | ¥13,900 | ¥0.97bn | ¥15,000 |
| W. Timber, 2 storeys | ¥0.50bn | ¥9,500 | ¥0.55bn | ¥10,100 |
Source: Modeled by MetroEngines Research & Consulting from MLIT “Statistics on Building Construction Starts” (2025) and Turner & Townsend construction cost forecasts. Land price assumption: ¥300,000/㎡
Required ADR rises 6–9% in every case, but the ranking does not change. If anything, rising construction costs weigh more heavily in absolute terms on the mid/high-rise side, so the edge of low-rise timber widens slightly. Soaring construction costs also restrain new supply itself. JLL’s analysis puts Japan’s new supply rate at 1.7%, far below other Asia-Pacific markets such as Vietnam, the highest at 21.3%, which adds the upside of easing competition with existing stock.
Reviews Turn Into Latent Value — 53.9% of Municipalities Have Abolished or Changed Plans
A planned alignment is not permanent. If the city planning decision is reviewed (abolished or changed), the restriction is lifted and the site returns to land that can use its full floor-area ratio. What drives a site’s latent value is how far this review has progressed.
According to MLIT’s annually published “Review Status of Municipalities with Unstarted Planned City Roads” (as of end of March 2025), the national picture is as follows. “All plans abolished or changed” accounts for 34.0% and “partly abolished or changed” for 19.9%, so 53.9% of municipalities have carried out some abolition or change. A further 2.4% are “in city planning procedures,” 8.5% have “selected candidate routes” and 17.3% are “selecting candidate routes”; including municipalities that have begun reviewing, the share exceeds 80%. Only 8.1% have “review timing undecided.”
Source: MLIT “Review Status of Municipalities with Unstarted Planned City Roads” (as of end of March 2025)
Totaling the municipality-level list in the same document (the 1,266 rows read for this article, with Tokyo’s wards counted as one row, “23 wards”), progress varies by prefecture. The share of municipalities that have abolished or changed plans is highest in Hyogo (89.7%, 35/39), Fukuoka (82.2%, 37/45), Osaka (77.5%, 31/40) and Mie (77.3%, 17/22). In these markets, the institutional cleanup of long-unbuilt routes is close to a full round.
Other markets are still mid-review. In Tokyo, 29 of the 31 rows counted are classified as “selecting candidate routes for abolition or change” (the remaining two are “all routes completed or started”), and review work is under way across both the wards and the Tama area. Combined with the second-largest unimproved length in the country, 1,129.8km (32.7% unimproved), Tokyo can be positioned as a market where future review outcomes will have a relatively large effect on land value. In Hokkaido, “review timing undecided” accounts for 37 of 98 rows, but this includes municipalities with only a few fully unstarted routes and those waiting for alignment with wider regional road plans, and each municipality publishes its reasons individually.
Whether an asset manager is checking whether an existing property can be rebuilt or a regional bank is assessing rebuildability for collateral valuation, the order of checks is the same. First, does a planned alignment cross the site (city planning maps, National Land Numerical Information planned city road data)? Second, is that route designated as a priority route (the municipality’s development program)? Third, does the municipality have a relaxation allowing up to three storeys? Fourth, what stage of the review process is the municipality at? Only with all four in hand can “how much can be built now” and “how much might be buildable in future” be assessed separately.
Summary
The alignment of a planned city road is a third filter that applies separately from use and height regulations. Japan’s unimproved length totals 22,313km, 31.6% of the planned length, and the unimproved ratio ranges nearly fourfold, from 53.6% in Shiga to 14.0% in Okinawa. A site crossed by a planned alignment needs an Article 53 permit, and the statutory standard is limited to two storeys or fewer, no basement, and easily relocated or removed structures such as timber or steel. Yet all nine municipalities we confirmed have rules allowing up to three storeys. Some revert to the statutory standard on priority routes, however, so checks must be made route by route rather than city by city.
For investment decisions, the turning point is whether structure choice can offset the inability to stack floor area. At a land price of ¥300,000/㎡, a two-storey timber hotel with 34 rooms needs an ADR of ¥9,500, below the ¥9,800 of a seven-storey RC hotel with 114 rooms. The crossover sits at around ¥330,000/㎡, and in regional and suburban markets below that, low-rise formats have the lower viability threshold. The volume center of the market is already on that side: of the 1,425 properties confirmed as opening in 2026, 806 (56.6%) were formats such as vacation rentals and cottages that are typically single-storey to two-storey.
And planned alignments are not fixed. 53.9% of municipalities have already abolished or changed plans, and more than 80% including those still reviewing. These are sites whose floor-area constraint may be lifted as reviews progress, and how you read that progress determines the land’s latent value. Not “land where you can’t build,” but “land you can use if you pick a format that fits the restriction, and that gains value as reviews progress” — that is the real picture of a site crossed by a planned road.
Note on methodology and sources: Planned and improved lengths of planned city roads were totaled from all 47 prefectural files of MLIT’s “2024 City Planning Status Survey” (reference date: March 31, 2024), and the national total matches the survey’s published figures (planned 70,598.6km / improved 48,285.9km). The national distribution of review status is quoted from the published figures of the Ministry’s “Review Status of Municipalities with Unstarted Planned City Roads” (as of end of March 2025); the prefectural breakdown totals the 1,266 rows read from that document’s municipality-level list (Tokyo’s wards counted as one row, “23 wards”). Municipal permit standards are based on nine published municipal documents (viewed September 2026). New-opening data was compiled by MetroEngines Research & Consulting based on confirmed OTA listings: 2026 confirmed openings N=1,425 properties, 2025 N=1,743 properties. Because listings appear a few months before opening, counts for the latest months are expected to rise with future listings; please treat them as current lower bounds. The required ADR figures are simplified models based on the assumptions set out in this article; actual investment decisions require a detailed feasibility study.
Related Reading
References and Sources
■ Data sources
Planned and improved lengths of planned city roads: all 47 prefectural files of MLIT’s “2024 City Planning Status Survey” (reference date: March 31, 2024) totaled. Review status: published figures of the Ministry’s “Review Status of Municipalities with Unstarted Planned City Roads” (as of end of March 2025) and 1,266 rows of its municipality-level list (Tokyo’s wards counted as one row, “23 wards”). Municipal permit standards: nine published municipal documents (viewed September 2026, N=9 municipalities). Construction cost per tsubo: structure-specific averages for hotel and ryokan use in the Ministry’s “Statistics on Building Construction Starts,” 2025. New-opening data: MetroEngines Research & Consulting (based on confirmed OTA listings, 2026 N=1,425 properties / 2025 N=1,743 properties).
■ Model assumptions
Base case: 1,000㎡ site, 35㎡ per room (gross floor area including common areas), 75% occupancy (full-year, model assumption), 45% GOP margin, 5% target NOI yield, land price ¥300,000/㎡. The GOP margin sits between the 38.9% achieved across 91 operating properties disclosed by Invincible Investment Corporation (fiscal period ended December 2024) and the 50–60% industry benchmark for limited-service hotels, with 45% adopted given the operating efficiency of low-rise, small-room-count properties. Construction inflation applies +10.6% over two years, derived from Turner & Townsend’s forecast annual increases for Japan (2025 +5.6% / 2026 +5.3% / 2027 +5.0%). The three scenarios combine 65/75/85% occupancy with 40/45/50% GOP margin, with construction inflation applied to the downside only. Required ADR was back-calculated as total investment × target NOI yield ÷ GOP margin ÷ (rooms × 365 × occupancy).
■ Limitations
Required ADR is a simplified back-calculation based on the assumptions in this article and differs from both observed property ADRs and actual contracted rates or accounting figures. Room counts are theoretical values (floor area ÷ area per room) and do not reflect actual design, setback-line restrictions or mandatory parking provisions. Ancillary costs other than land acquisition (design and supervision fees, development costs, opening costs) and financing terms are not included. Unimproved length is a rough measure of “length where the planned alignment may still fall on private sites”; whether a planned alignment crosses a specific site must be confirmed on city planning maps. Municipal permit standards are drawn from N=9 published documents and do not represent the national distribution of practice. Because OTA listings appear a few months before opening, new-opening counts for the latest months will rise and are current lower bounds. Actual investment decisions require a detailed feasibility study.
■ Government statistics and public data
- MLIT “2024 City Planning Status Survey: National, Prefectural and Municipal Data” (reference date March 31, 2024)
- MLIT “Review of Planned City Roads” — review guidelines / review status by prefecture and municipality (as of end of March 2025)
- MLIT National Land Numerical Information download site (planned city road data)
- MLIT “Statistics on Building Construction Starts” (estimated construction cost and floor area by structure)
■ Municipal permit standards (City Planning Act Article 53)
- Yokohama City: Building Permits under Article 53 of the City Planning Act (Japanese)
- Meguro City: Building within Planned City Road Areas (Article 53 Permits) (Japanese)
- Nagoya City: Building Restrictions Due to Planned City Roads (Japanese)
- Kamakura City: Building Permits under Article 53 of the City Planning Act (review policy for planned city roads finalized August 2013) (Japanese)
- Sendai City: Building Permits within Planned Urban Facility Areas (Japanese)
- Sasebo City: Relaxation of the Article 54 (Building Permit) Standards (Japanese)
- Chofu City: New Relaxed Building Restriction Standards within Planned City Road Areas (Japanese)
- Edogawa City: Relaxed Building Restriction Standards within Planned City Road Areas (Article 53 Permits) (Japanese)
- Nakano City: Article 54 Permit Standards for Constructing Buildings (Japanese)
■ Construction cost, GOP and market data
- archi-book “Construction Cost per Tsubo” 2025 edition (structure-specific costs based on building-start statistics) (Japanese)
- Invincible Investment Corporation disclosures (GOP results of operated hotels)
- JLL “Japan Hotel Investment Market” (new supply rate and construction cost trends)
- Turner & Townsend “International Construction Market Survey” (construction cost forecasts)
- MetroEngines Research & Consulting — new-opening data (based on confirmed OTA listings, 2026 N=1,425 properties / 2025 N=1,743 properties)