

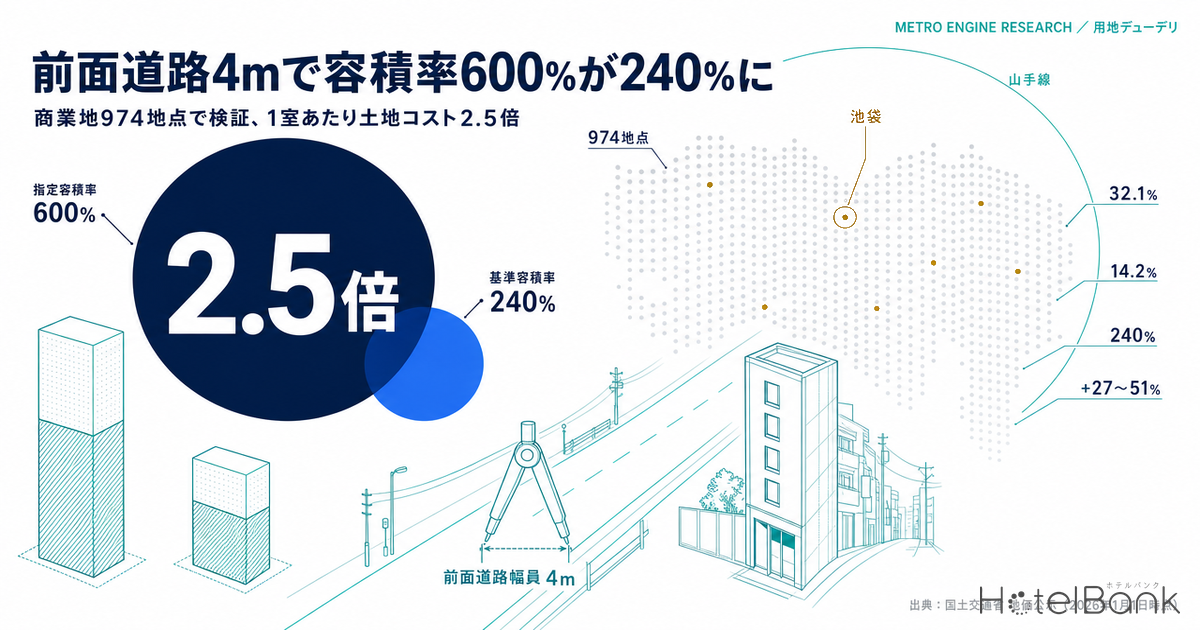
When a site package lands on your desk, the first things most people check are the zoning district and the designated floor area ratio (FAR). If it says “Commercial District, 600%,” you multiply the site area by six to get gross floor area and back out a room count from there. That ten-minute mental math can change dramatically depending on a single variable: the width of the frontage road. Article 52(2) of Japan’s Building Standards Act provides that for sites fronting a road narrower than 12m, the applicable FAR is the lower of the designated FAR and the road width (m) multiplied by a statutory coefficient. Even on commercial land designated at 600%, a 4m frontage road limits you to 4 × 0.6 = 240%.
In this article, we aggregated 974 Land Price Publication benchmark sites in commercial-type zoning districts across six major markets (Tokyo, Osaka, Nagoya, Fukuoka, Sapporo and Kyoto) and counted how many of them actually cannot use their full designated FAR. We then worked backwards, assuming a 100-room limited-service hotel, to estimate how much road width moves land cost per room and the required room rate. The bottom line: sites with roads under 12m account for 32.1% of the 974, and 44.1% of those were actually capped. And the intuition that “a narrow road means cheaper land, so it evens out” does not hold below 6m.
Metric Definitions Used in This Article
- ADR (Average Daily Rate): An estimated settled rate (tax-excluded equivalent), calculated by applying a segment-specific adjustment factor to the lowest-plan price level each property publishes on OTAs (per room, 2 guests, tax included). Cross-checked against property-level results disclosed by listed hotel REITs (91 properties, most recent 3 months), the median error is approximately 7%. These are estimates and differ from each property’s actual settled prices and accounting figures. Area-level ADR is the median of the target properties (the level of a typical property in the area).
- Designated FAR: The upper limit on floor area ratio set by city planning. Effective FAR: The lower of the designated FAR and the limit derived from frontage road width (Building Standards Act Article 52(2)). This article refers to the latter as the “FAR you can actually use.”
- Land cost per m² of gross floor area: Land price (¥/m²) ÷ (effective FAR / 100). A metric for comparing how much land cost is needed to build the same amount of floor area.
- Data sources: Land prices, zoning districts and frontage road widths are from the MLIT Real Estate Information Library, “Land Price Publication” (2026, as of January 1, 2026). Room rates are from MetroEngines Research.
- — Of 974 commercial-type benchmark sites in six major markets, 32.1% front roads narrower than 12m, and 14.2% cannot actually use their full designated FAR
- — The FAR reduction at capped sites has a median of 20%. In Tokyo, 19.4% of 475 sites are affected — the highest share among the six markets
- — “Narrow road, cheaper land” broadly holds at 6m and above but breaks down below 4m (land cost per m² of floor area is 1.9x that of 12m+ roads)
- — In a 100-room, 3,000m² model, a 4m road requires 2.5x the site area and pushes land cost per room up 2.5x
- — The required ADR uplift is +27–51% at 4m and +4.5–8.5% at 8m. The uplift barely moves when assumptions are flexed; the dividing line is around 6m
Article 52(2) in Three Lines — The Lower of Width × Coefficient and Designated FAR
The rule itself is short. If the frontage road is 12m or wider, you can use the designated FAR as-is. If it is narrower than 12m, you compare the road width (m) multiplied by a statutory coefficient against the designated FAR, and the lower figure becomes the cap. The statutory coefficient is, in principle, 4/10 for residential-type zoning districts and 6/10 for all others (Neighborhood Commercial, Commercial, Quasi-Industrial, Industrial and Exclusively Industrial).
Putting numbers on it makes the effect clear. With the 6/10 coefficient in a Commercial District, a road only reaches 600% at 10m. At 8m it is 480%, at 6m 360%, and at 4m 240%. The 4/10 coefficient for residential districts is even harsher: 160% at 4m, 240% at 6m and just 400% at 10m. Even in a Category 1 Residential District designated at 400%, a 6m frontage road allows only 240%.
| Frontage road width | Other districts (6/10) | Residential (4/10) | Share of 600% retained (Commercial) |
|---|---|---|---|
| 4m | 240% | 160% | 40% |
| 5m | 300% | 200% | 50% |
| 6m | 360% | 240% | 60% |
| 8m | 480% | 320% | 80% |
| 10m | 600% | 400% | 100% |
| 12m or wider | No limit (designated FAR) | No limit (designated FAR) | 100% |
974 Commercial Sites in Six Markets — 32.1% Front Roads Under 12m, and 44.1% of Those Are Capped
Understanding the rule is one thing; what practitioners really want to know is how much land like this is out there. The benchmark sites in the Land Price Publication (2026, as of January 1, 2026), published through the MLIT Real Estate Information Library, record each site’s zoning district, designated FAR and frontage road width. This makes it possible to recalculate the effective FAR site by site.
Covering central Tokyo, Osaka, Nagoya, Fukuoka, Sapporo and Kyoto, we extracted 974 benchmark sites located in Commercial and Neighborhood Commercial Districts. 313 sites (32.1%) front roads narrower than 12m. Of those, 138 actually fell below their designated FAR — 14.2% of all 974 sites. The median FAR reduction at capped sites was 20%.
More than half of the sites with roads under 12m are not capped because their designated FAR is low to begin with. In a Neighborhood Commercial District designated at 300%, even a 6m road allows 360%, so the limit never bites. Put the other way, road width bites hardest in high-intensity areas where the designated FAR is set high.
| Market | Benchmark sites | Road under 12m | Capped sites | Capped share | Median road width | Median designated FAR |
|---|---|---|---|---|---|---|
| Tokyo | 475 | 183 | 92 | 19.4% | 16.0m | 600% |
| Osaka | 157 | 55 | 25 | 15.9% | 21.8m | 600% |
| Nagoya | 147 | 34 | 10 | 6.8% | 24.5m | 400% |
| Fukuoka | 53 | 17 | 3 | 5.7% | 20.0m | 400% |
| Sapporo | 66 | 0 | 0 | 0.0% | 25.0m | 300% |
| Kyoto | 76 | 24 | 8 | 10.5% | 21.9m | 400% |
| Total | 974 | 313 | 138 | 14.2% | — | — |
The gap between markets is wide. In Tokyo, 92 of 475 sites (19.4%) are capped, and its median road width of 16.0m is the narrowest of the six markets. Osaka follows at 15.9%, then Kyoto at 10.5%, Nagoya at 6.8% and Fukuoka at 5.7%. In Sapporo, all 66 sites front roads 12m or wider, and none are capped. The difference between cities laid out on wide grid streets and cities where narrow lanes survive shows up directly in the numbers.
One caveat is important, however. Land Price Publication benchmark sites are selected as typical land for their area, so they include a relatively high proportion of sites along arterial roads. Small sites that actually come to market are more likely than benchmark sites to front narrower roads. The 32.1% and 14.2% figures are therefore best read as a floor for real-world conditions.
“Narrow Road, Cheaper Land” Breaks Down Below 6m — Land Cost per m² of Floor Area
Land on a narrow road is cheaper. So even if you lose floor area, doesn’t it balance out if you can buy the land for less? It is a common argument on the acquisitions side, and it can be tested. Dividing the land price by the effective FAR gives “the land cost required to build the same 1m² of floor area.” Lining up road-width bands on this metric draws a clear line between where the intuition holds and where it does not.
| Frontage road width | Sites | Median designated FAR | Median effective FAR | Median land price (¥/m²) | Land cost per m² of floor area | vs. 12m+ |
|---|---|---|---|---|---|---|
| Under 4m | 4 | 550% | 180% | 1,400,000 | ¥777,778 | +92% |
| 4m to under 6m | 21 | 500% | 312% | 1,390,000 | ¥445,513 | +10% |
| 6m to under 8m | 67 | 500% | 400% | 1,700,000 | ¥425,000 | +5% |
| 8m to under 12m | 133 | 500% | 480% | 1,880,000 | ¥391,667 | -3% |
| 12m or wider | 541 | 600% | 600% | 2,430,000 | ¥405,000 | — |
Sites on roads 12m or wider have a median land price of ¥2.43 million/m² and an effective FAR of 600%, for a land cost of ¥405,000 per m² of floor area. By comparison, the 8m-to-under-12m band comes in at about ¥391,700 — actually slightly cheaper. The 6m-to-under-8m band is ¥425,000 (+5%), and the 4m-to-under-6m band about ¥445,500 (+10%). Up to this point, the land discount broadly absorbs the loss of floor area.
It breaks down below 4m. The median land price falls to ¥1.4 million/m² — a little under 60% of arterial-road levels — but the effective FAR drops to 180%, so land cost per m² of floor area jumps to about ¥777,800, 1.9x that of 12m+ roads. With only N=4 sites we avoid drawing firm conclusions, but the direction is clear. The apparent bargain of a back-street site effectively balances out as long as the floor-area loss stays around 20% or less; beyond that, it no longer does.
This threshold matters in practice. When you come across a parcel on a road narrower than 6m in a high-intensity area designated at 500–600%, you need to check first not whether it is cheap, but whether it is cheap per unit of buildable floor area. An asking price that looks attractive per tsubo can drop down the ranking the moment you re-divide it by the floor area you can actually build.
Mapping Tokyo’s 475 Sites — Capped Sites Cluster in the Urban Core
We plotted Tokyo’s 475 commercial-type benchmark sites on a map. Blue marks sites where frontage road width does not limit the designated FAR; red marks sites where the effective FAR falls below the designated FAR. Circle size corresponds to the reduction rate.
The red dots cluster inside the Yamanote Line loop and around terminal stations such as Ikebukuro, Shinjuku, Shibuya and Ueno. The more concentrated the commercial area and the higher its designated FAR, the more likely road width falls short and caps the site. Conversely, in outer areas where the designated FAR is around 300%, even an 8m road does not trigger the limit.
Looking at individual sites with the largest reductions shows just how steep the drop can be. A benchmark site in Nakano Ward (300m from Nakano Station) is designated at 600% but fronts a 2.7m road, giving an effective FAR of 162%. A Toshima Ward site 100m from Ikebukuro Station is designated at 800% but fronts a 4.0m road, for an effective 240%. In Osaka, a site 220m from Shinsaibashi Station is designated at 1,000% but fronts a 6.0m road, for an effective 360% — 640 percentage points that cannot be used. All of these are close to stations with high land prices, and judging by designated FAR on paper alone, they are prime locations.
| Market / ward | Frontage road | Designated → effective | Reduction | Land price (¥/m²) | Nearest station |
|---|---|---|---|---|---|
| Tokyo / Nakano Ward | 2.7m | 600% → 162% | -73% | 2,360,000 | 300m from Nakano |
| Tokyo / Toshima Ward | 4.0m | 800% → 240% | -70% | 2,560,000 | 100m from Ikebukuro |
| Tokyo / Bunkyo Ward | 3.0m | 600% → 180% | -70% | 1,520,000 | 60m from Yushima |
| Tokyo / Chiyoda Ward | 3.0m | 500% → 180% | -64% | 1,270,000 | 170m from Jimbocho |
| Osaka / Chuo Ward | 6.0m | 1000% → 360% | -64% | 19,900,000 | 220m from Shinsaibashi |
| Osaka / Chuo Ward | 6.0m | 1000% → 360% | -64% | 11,700,000 | 160m from Namba |
| Tokyo / Toshima Ward | 4.0m | 600% → 240% | -60% | 1,320,000 | 510m from Ikebukuro |
| Osaka / Tennoji Ward | 4.0m | 600% → 240% | -60% | 267,000 | 270m from Tamatsukuri |
Working Backwards with a 100-Room Model — A 4m Road Makes Land Cost per Room 2.5x
Now we bring this into a business plan. We set a standard configuration — 100 rooms, limited-service, 30m² of gross floor area per room (3,000m² total) — built on Commercial District land with a 600% designated FAR. The average floor area per room across the construction plans we have compiled is 35.0m², so 30m² is close to the lower end for limited-service hotels. Because the required site grows in proportion to floor area per room, the gaps below are conservative estimates. For the same back-calculation where the cap is set by absolute height rather than FAR, see Kyoto’s 20m Height Cap Adds 25% to Land Cost Per Hotel Room.
| Frontage road width | Effective FAR | Required site area | Ratio vs. 12m+ |
|---|---|---|---|
| 4m | 240% | 1,250m² | 2.5x |
| 6m | 360% | 833m² | 1.7x |
| 8m | 480% | 625m² | 1.2x |
| 10m | 600% | 500m² | 1.0x |
| 12m or wider | 600% | 500m² | 1.0x |
With a 4m road, you need 2.5x the site area of a 12m+ road to build the same floor area. Multiplying this site-area difference by the median Land Price Publication value for Commercial Districts in each market gives the land cost per room in the table below.
| Market | Median land price (¥/m²) | Road 12m+ | Road 8m | Road 6m | Road 4m | 4m / 12m |
|---|---|---|---|---|---|---|
| Tokyo / Taito Ward | 1,740,000 | ¥8.7M | ¥10.9M | ¥14.5M | ¥21.8M | 2.5x |
| Tokyo / Toshima Ward | 2,565,000 | ¥12.8M | ¥16.0M | ¥21.4M | ¥32.1M | 2.5x |
| Osaka / Chuo Ward | 2,430,000 | ¥12.2M | ¥15.2M | ¥20.2M | ¥30.4M | 2.5x |
| Nagoya / Nakamura Ward | 2,280,000 | ¥11.4M | ¥14.2M | ¥19.0M | ¥28.5M | 2.5x |
| Fukuoka / Hakata Ward | 2,050,000 | ¥10.2M | ¥12.8M | ¥17.1M | ¥25.6M | 2.5x |
| Sapporo / Chuo Ward | 1,100,000 | ¥5.5M | ¥6.9M | ¥9.2M | ¥13.8M | 2.5x |
| Kyoto / Shimogyo Ward | 1,440,000 | ¥7.2M | ¥9.0M | ¥12.0M | ¥18.0M | 2.5x |
In Tokyo’s Toshima Ward, land cost per room rises from ¥12.8 million on a 12m+ road to ¥32.1 million on a 4m road. The difference is ¥19.3 million per room, or ¥1.9 billion across 100 rooms. Osaka’s Chuo Ward goes from ¥12.2 million to ¥30.4 million. Sapporo’s Chuo Ward has lower land prices and thus smaller absolute amounts, but the multiple is the same 2.5x, from ¥5.5 million to ¥13.8 million.
Translating to Break-Even ADR — A 4m Road Raises the Required Rate by 27–51%
Next, we translate the land cost gap into room rates. For construction cost, we use the 2025 steel-frame cost of ¥2.405 million per tsubo based on MLIT’s Building Construction Starts Statistics, giving ¥2.183 billion for 3,000m² (907.5 tsubo). Adding design and supervision fees, FF&E and pre-opening costs at 15% of construction cost (¥327 million), the building-side investment is fixed at ¥2.51 billion. We then add land cost by road width and back out the required ADR at 85% occupancy, a 35% GOP margin and a 5.0% target NOI yield (all full-year modeling assumptions aligned with prevailing ADR from September 2025 to August 2026). The 35% GOP margin is a conservative figure relative to the 38.9% actual reported by Invincible Investment Corporation across 91 operated properties (fiscal period ended December 2024). For how far the required ADR swings as interest rates move, see our market-by-market analysis in Policy Rate 1.00%: Break-Even ADR Across Japan’s 8 Hotel Markets.
| Market | Prevailing ADR (last 12 months) | Required ADR road 12m+ | Required ADR road 8m | Required ADR road 6m | Required ADR road 4m | Uplift at 4m |
|---|---|---|---|---|---|---|
| Tokyo / Taito Ward | ¥14,304 | ¥15,563 | ¥16,565 | ¥18,234 | ¥21,572 | +39% |
| Tokyo / Toshima Ward | ¥12,345 | ¥17,462 | ¥18,939 | ¥21,399 | ¥26,321 | +51% |
| Osaka / Chuo Ward | ¥12,155 | ¥17,152 | ¥18,550 | ¥20,881 | ¥25,544 | +49% |
| Nagoya / Nakamura Ward | ¥10,414 | ¥16,806 | ¥18,119 | ¥20,306 | ¥24,680 | +47% |
| Fukuoka / Hakata Ward | ¥14,182 | ¥16,277 | ¥17,457 | ¥19,423 | ¥23,356 | +43% |
| Sapporo / Chuo Ward | ¥14,219 | ¥14,090 | ¥14,723 | ¥15,778 | ¥17,888 | +27% |
| Kyoto / Shimogyo Ward | ¥15,428 | ¥14,872 | ¥15,701 | ¥17,083 | ¥19,845 | +33% |
The uplift ranges from 27% to 51% depending on the market. The higher the land price, the larger the share of total investment taken by land, and so the bigger the road-width penalty. Tokyo’s Toshima Ward shows +50.7%, Osaka’s Chuo Ward +48.9% and Nagoya’s Nakamura Ward +46.9%. Sapporo’s Chuo Ward, with relatively low land prices, stays at +27.0%, and Kyoto’s Shimogyo Ward at +33.4%.
In this model, some markets require an ADR above the prevailing ADR even with a 12m+ road. That does not mean new hotels cannot work in city centers. Land Price Publication benchmark sites skew toward high-intensity land along arterial roads, so the median runs higher than the price range at which hotel sites actually trade. The prevailing ADR is also the median across the area’s entire existing stock, which differs from the price range a new build would target. What matters here is not the absolute figure but the relative difference — by what percentage road width moves the required ADR.
8m road — limited impact
480% against a 600% designated FAR. The required ADR uplift stays at 4.5–8.5%, within the range that price negotiation in the same area can absorb.
6m road — the plan’s assumptions change
Effective FAR of 360%. Required ADR rises 12.0–22.5%. To keep the same room count, you either need 1.7x the site area or must revise the room count downward.
4m road — rebuild it as a different business
Effective FAR of 240%. Required ADR rises 27.0–50.7%. This is the point to drop the 100-room premise and consider switching to a different business model, such as a smaller, higher-rate concept.
Flexing the Assumptions — How Far Yield, GOP Margin and Occupancy Swing the Required ADR
The required ADRs so far are based on a single set of assumptions: a 5.0% target NOI yield, a 35% GOP margin and 85% occupancy (full-year modeling assumptions aligned with prevailing ADR from September 2025 to August 2026). The effect of road width itself does not change when assumptions move, but the level question — “does this work in this market?” — can flip depending on the assumptions chosen. We flex the Taito Ward model in two directions.
| Target NOI yield | Road 12m+ | Road 8m | Road 6m | Road 4m |
|---|---|---|---|---|
| 4.0% | ¥12,451 ○ | ¥13,252 ○ | ¥14,587 × | ¥17,258 × |
| 4.5% | ¥14,007 ○ | ¥14,908 × | ¥16,411 × | ¥19,415 × |
| 5.0% (base case) | ¥15,563 × | ¥16,565 × | ¥18,234 × | ¥21,572 × |
| 5.5% | ¥17,120 × | ¥18,221 × | ¥20,058 × | ¥23,730 × |
| 6.0% | ¥18,676 × | ¥19,878 × | ¥21,881 × | ¥25,887 × |
○ = required ADR at or below Taito Ward’s prevailing ADR (estimated settled ADR, September 2025 – August 2026 average of ¥14,304, N=168 properties, median monthly property count); × = above. Land price is the median of Taito Ward’s Commercial District benchmark sites, ¥1.74 million/m² (Source: MLIT Real Estate Information Library, “Land Price Publication,” 2026, as of January 1, 2026, N=45 sites). Building-side investment of ¥2.51 billion is held constant regardless of road width. Estimates: MetroEngines Research & Consulting
Lowering the yield to 4.0% brings the 12m+ road (¥12,451) and 8m road (¥13,252) inside the prevailing ADR of ¥14,304. The 6m-and-narrower bands, however, still exceed the prevailing rate even at a 4.0% yield. In other words, 4m and 6m parcels cannot close the gap at benchmark land price levels even with a looser cap rate assumption — you need either to buy the land below the median or to change the room count and floor-area-per-room design.
Flexing GOP margin and occupancy as well widens the range further.
| Scenario | GOP margin | Occupancy | Target NOI yield | Required ADR road 12m+ | Required ADR road 4m | Uplift at 4m |
|---|---|---|---|---|---|---|
| Upside | 38.9% | 88% | 4.5% | ¥12,173 | ¥16,873 | +39% |
| Base | 35.0% | 85% | 5.0% | ¥15,563 | ¥21,572 | +39% |
| Downside | 31.0% | 80% | 5.5% | ¥20,537 | ¥28,466 | +39% |
Basis for scenario assumptions: Upside = GOP margin from Invincible Investment Corporation’s 91 operated properties (fiscal period ended December 2024, 38.9%), 88% occupancy (likewise a modeling assumption on a September 2025 – August 2026 basis), falling cap rate environment / Base = the base case in the article; GOP margin is conservative relative to the 38.9% actual / Downside = 31% GOP margin, 80% occupancy (same basis), rising cap rate environment. Estimates: MetroEngines Research & Consulting
In the upside scenario, the required ADR for a 12m+ road falls to ¥12,173, below the prevailing rate, but the 4m road still falls short at ¥16,873. In the downside scenario, even the 12m+ road requires ¥20,537, and no band works. What stands out is that the 4m uplift stays stable at around +39% across all three scenarios. However the assumptions are set, the ratio by which road width pushes up the required ADR barely moves. Road width should be read not as a variable that sensitivity analysis can erase, but as one fixed at the outset as an initial condition of the project.
Note that all scenarios use the median of Land Price Publication benchmark sites, which by nature skew toward high-intensity land along arterial roads. The price range at which hotel sites actually trade is often lower, so the ○/× marks in the table should be read as a judgment of “if bought at this price.”
Three Ways to Recover Road Width — Arterial Road Relaxation, Setbacks and Dual Frontage
Land with insufficient road width is not without remedies. In practice, there are three things to check first.
First, relaxation for proximity to a designated arterial road (Building Standards Act Article 52(9); Enforcement Order Article 135-18). A site within 70m of a road 15m or wider (a “designated arterial road,” or tokutei doro) that fronts a road between 6m and under 12m wide can add a value to its frontage road width based on its distance to that arterial road. The addition is calculated as (12 − frontage road width) × (70 − distance to the arterial road) ÷ 70. A site on a 6m road that is 35m from an arterial road gains 3.00m, recovering to an effective 9.00m = 540%. At 20m from the arterial road, it gains 4.29m for an effective 10.29m, reaching the designated 600%. Even a back-street site can look very different if it is close to a main road.
| Frontage road width | Distance to arterial road | Addition | Effective width | Resulting FAR (6/10) |
|---|---|---|---|---|
| 6m | 20m | +4.29m | 10.29m | 600% |
| 6m | 35m | +3.00m | 9.00m | 540% |
| 6m | 50m | +1.71m | 7.71m | 463% |
| 6m | 70m | +0.00m | 6.00m | 360% |
| 8m | 30m | +2.29m | 10.29m | 600% |
Second, using the widest road for sites fronting two or more roads. For corner sites or sites with frontage on two roads, the widest of the adjoining roads can be used. Even if a site has only a 4m lane at the back, a 12m road at the front can be used for the calculation. In our aggregation, cases where a side road is wider than the frontage road were likewise treated using the maximum width.
Third, setbacks on Article 42(2) roads. Roads under Article 42(2) of the Building Standards Act are deemed to be 4m wide once buildings are set back 2m from the centerline. However, the setback portion is excluded from the site area, so both the numerator and the denominator of the FAR calculation move at the same time. Even if the road width recovers from 2.7m to 4.0m, the increase in floor area is smaller than it looks if the site area shrinks.
The First 10 Minutes of Site Due Diligence — Road Width Is Not Measured the Same Way Everywhere
This is where mistakes are most likely: how road width is measured. The statute says only “width,” but its application is left to the handling guidelines of each designated administrative agency. Because it is not uniform nationwide, you must always consult the published materials of the municipality where the site is located.
Minato Ward in Tokyo publishes the following four points as its handling practice. (1) Width is judged comprehensively over the stretch from intersection to intersection (between nodes), not just in front of the site. (2) The minimum width within the road section from the 2m (minimum frontage length) contact portion to the intersection is used. (3) If there are multiple such minimum widths, the largest one is used. (4) Where the certified width and the actual width of a ward road differ, the smaller is used, and corner cut-offs are not included in road width. A road that widens only directly in front of the site is judged by the minimum width between nodes, so the desk-top figure cannot be relied on.
Osaka City likewise publishes its “Method for Calculating FAR Based on Frontage Roads” and the “Osaka City Building Standards Act Handling Guidelines,” which specify how frontage roads of different widths are treated and how to judge whether a planned road qualifies as a designated arterial road (even if its planned width is 15m or more, it does not qualify unless it falls under the roads listed in Article 42(1)). Even under the same Article 52(2), the operational details cannot be confirmed without reading municipal materials.
There is one more regulation specific to hotels. Article 9, Item 5 of the Tokyo Metropolitan Building Safety Ordinance classifies “hotels, ryokan and simple lodging facilities” as special buildings, and Article 10-3 requires a minimum road frontage length according to the floor area used for that purpose: 4m for 500m² or less, 6m for over 500m² up to 1,000m², 8m for over 1,000m² up to 2,000m², and 10m for over 2,000m². A 100-room, 3,000m² model must therefore have at least 10m of road frontage. This regulates the length of the site’s contact with the road rather than road width, but on narrow flag-shaped parcels it bites before FAR does. Parking space requirements for hotels, which likewise vary widely by municipality, are another early-stage item worth checking within the same 10 minutes.
| # | Item | Where to check |
|---|---|---|
| 1 | Zoning district and statutory coefficient (residential 4/10 or other 6/10) | Municipal city planning information / Real Estate Information Library |
| 2 | Certified vs. actual width of the frontage road (many municipalities use the smaller) | Road register of the road administrator |
| 3 | Minimum width between nodes (beware roads that are wide only in front of the site) | Municipal Building Standards Act handling guidelines |
| 4 | Whether a designated arterial road (15m or wider) lies within 70m | Road register / on-site inspection |
| 5 | Whether the site has dual frontage, and the maximum width | Cadastral map / on site |
| 6 | Road frontage length requirements for special buildings (in Tokyo, 10m for over 2,000m² of floor area) | Prefectural and municipal building safety ordinances |
Over 30% Capped in Residential Districts — The Weight of the 4/10 Coefficient
For reference, we applied the same method to 685 sites in residential-type zoning districts across the same six markets. 220 sites, or 32.1%, were capped. That is 2.3x the 14.2% share for commercial-type sites, and the median reduction of 27% also exceeds the 20% for commercial sites. Beyond the 4/10 coefficient, residential sites more often front local streets.
When searching for sites in Category 1 Residential, Category 2 Residential or Quasi-Residential Districts — where ryokan/hotel business is permitted under zoning — even land designated at 200% can use only 160% if it fronts a 4m road. The fact that residential districts are, in sheer numbers, more likely to hit this constraint than commercial ones should be factored in when sketching initial massing.
Conclusion — The Designated FAR in the Site Package Is Not Yet the FAR You Can Use
Of 974 commercial-type benchmark sites in six major markets, 313 (32.1%) front roads narrower than 12m, and 138 (14.2%) cannot actually use their full designated FAR. The median reduction at capped sites is 20%, and in Tokyo 19.4% of sites are affected. Because Land Price Publication benchmark sites tend to sit along arterial roads, it is reasonable to assume this share is even higher for the small parcels that come to market.
Tested on land cost per m² of floor area, the intuition that “a narrow road means cheaper land” broadly holds at 6m and above and fails below 4m. At sites under 4m, land prices fell to a little under 60% of 12m+ road levels, yet land cost per unit of floor area was 1.9x higher.
In the 100-room, 3,000m² model, a 4m road requires 2.5x the site area of a 12m+ road and raises the required ADR by 27–51%. At 8m, the uplift is 4.5–8.5%, within the range of price negotiation. The dividing line is around 6m; below it, proceeding with the same business plan becomes difficult.
That said, this is not a case of “this land can’t be bought.” Once three variables come into play — distance to a designated arterial road, whether there is dual frontage, and road width after setback — the conclusion can change even for the same 4m frontage. Put another way, building road width into initial massing lets you screen sites on the premise that the break-even line differs even at the same land price. Start by re-sorting a candidate list ranked only by designated FAR, this time by road width.
Related Articles
- Hotel Development Capacity 2026: Zoning, FAR & Land Price in 5 Markets
- Policy Rate 1.00%: Break-Even ADR Across Japan’s 8 Hotel Markets
- Kyoto’s 20m Height Cap Adds 25% to Land Cost Per Hotel Room
- Hotel Construction Cost ¥20.67M/Room: 35.0m² Floor Area in 31 Plans
- Hotel Site Archaeology Risk: 8.2% of 68,333 Filings Face Excavation
References and Sources
■ Data Sources
Land prices, zoning districts, designated FAR and frontage road widths are from the MLIT Real Estate Information Library, “Land Price Publication” (2026, as of January 1, 2026). The aggregation covers 974 benchmark sites in Commercial and Neighborhood Commercial Districts in central areas of six major markets (Tokyo, Osaka, Nagoya, Fukuoka, Sapporo and Kyoto), plus 685 sites in residential-type zoning districts as a reference aggregation. Construction cost per tsubo is the 2025 steel-frame figure from MLIT’s “Building Construction Starts Statistics.” Prevailing ADR (estimated settled ADR) is MetroEngines Research’s monthly municipal-level data (12-month average, September 2025 – August 2026).
■ Modeling Assumptions
100 rooms, limited-service, 30m² of floor area per room (3,000m² total), Commercial District with 600% designated FAR. Construction cost of ¥2.405 million per tsubo (¥2.183 billion for 907.5 tsubo), with design and supervision fees, FF&E and pre-opening costs at 15% of construction cost (¥327 million), for a building-side investment of ¥2.51 billion held constant regardless of road width. Land cost = median land price of Commercial District benchmark sites in each ward × required site area. The base required ADR is backed out at a 5.0% target NOI yield, 35% GOP margin and 85% occupancy (full-year modeling assumptions aligned with prevailing ADR from September 2025 to August 2026); the sensitivity analysis flexes target NOI yield from 4.0% to 6.0%, GOP margin from 31.0% to 38.9%, and occupancy from 80% to 88%. The 35% GOP margin is conservative relative to the 38.9% actual reported by Invincible Investment Corporation across 91 operated properties (fiscal period ended December 2024).
■ Limitations and Caveats
Land Price Publication benchmark sites are selected as typical land for their area and therefore skew toward high-intensity land along arterial roads, tending to show wider roads and higher land prices than the small sites that actually trade. The 32.1% and 14.2% shares in this article are best read as a floor for real-world conditions and the absolute required ADRs as the upper end; what is meaningful is the relative difference between road-width bands. The under-4m band has only N=4 and is shown for reference. Setback-line (slant plane) restrictions, shadow regulations, building coverage ratio, FAR exclusions for apartment buildings and similar, and additional restrictions under district plans are not considered. The method for certifying road width is left to each designated administrative agency’s handling guidelines and is not uniform nationwide. Estimated settled ADR is an estimate; cross-checked against property-level results disclosed by listed hotel REITs (91 properties, most recent 3 months), the median error is approximately 7%. Actual investment decisions require a feasibility study for the individual site.
■ Market Data
- MetroEngines Research & Consulting — Estimated settled ADR (by municipality, September 2025 – August 2026), required ADR estimates
■ Government Statistics and Public Data
- MLIT Real Estate Information Library, “Land Price Publication” (2026, as of January 1, 2026) — Land prices, zoning districts, designated FAR, frontage road widths
- MLIT, “Building Construction Starts Statistics” — Construction cost per tsubo by structure type
■ Laws and Municipal Handling Practices
- Building Standards Act Article 52 (FAR) / Building Standards Act Enforcement Order Article 135-18 (arterial road relaxation)
- Minato Ward, “Road Width Used for Calculating FAR” (updated May 20, 2026)
- Osaka City, “Method for Calculating FAR Based on Frontage Roads” (Osaka City Building Standards Act Handling Guidelines)
- Osaka City, “FAR Limits Based on Frontage Road Width and Fire Prevention Regulations under the Osaka City Building Standards Act Enforcement Ordinance”
- Tokyo Metropolitan Building Safety Ordinance Articles 9 and 10-3 (length of road frontage)
■ Industry Data
- Invincible Investment Corporation, GOP results for operated hotels (fiscal period ended December 2024) — basis for the GOP margin assumption