

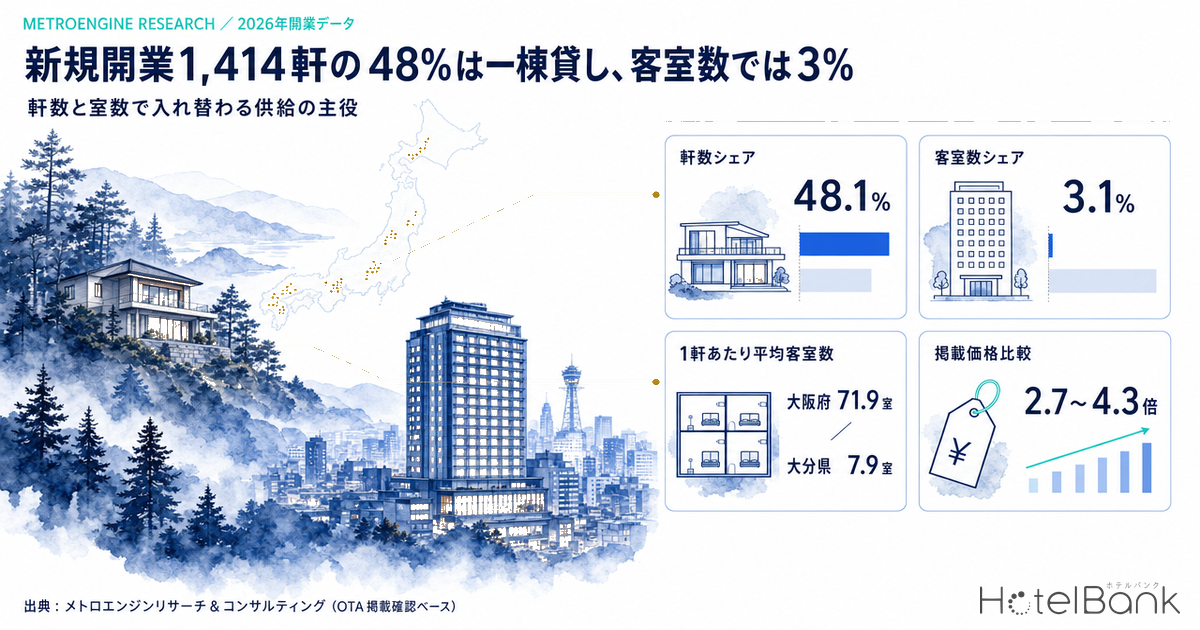
Counting new hotel openings by property and counting them by guest room produces two completely different pictures. Within the scope MetroEngines Research tracks, 1,414 lodging properties were confirmed to have opened in Japan in 2026, and 48.1% of them (680 properties) are vacation rental villas — whole-building rentals. Yet when the same 1,414 properties are recounted by room, the villa share shrinks to 3.1% (1,111 rooms). Conversely, hotel-type properties — business hotels, city hotels and resort hotels — account for only 22.5% (318 properties) by count, but 85.0% (30,890 rooms) by room. This article breaks down that reversal between property count and room count by category and by prefecture, compares it against the structure of existing stock, and explains why whole-building rentals show such high listed prices.
Metric Definitions Used in This Article
- Sample population: The lodging property master covering all 47 prefectures of Japan tracked by MetroEngines Research (based on confirmed OTA listings, N=77,802 properties / 2,167,562 rooms in total). This is not a complete census; it is limited to properties whose listings could be confirmed on OTAs. “Existing stock” in this article refers to this population. Of these, roughly 27,000 properties and about 1.26 million rooms can be confirmed as operating on OTAs; properties currently suspended from listing or operating seasonally are also included in the population.
- 2026 openings: Properties within the same population whose opening year is 2026 (N=1,414 properties / 36,338 rooms). Year-on-year comparisons use figures re-aggregated under identical extraction conditions.
- Room count: The sum of guest rooms recorded in the property master. Whole-building rentals are typically registered as 1–2 rooms per building, and actual guest capacity is not proportional to the room count. All room counts in this article are therefore presented as lower bounds (among 2026 openings, 8 of 1,414 properties = 0.6% have no registered room count).
- Listed price: The average across all plans of the selling prices published on OTAs. Per-room rate for two guests in one room (one building for whole-building rentals), tax included.
- ADR (estimated settled ADR): An estimated transacted rate (tax-excluded equivalent) calculated by applying category-specific adjustment coefficients to the lowest plan level each property publishes on OTAs. Cross-checked against property-level results disclosed by listed hotel REITs (91 properties, trailing three months), the median error is approximately 7%. It is an estimate and differs from each property’s actual transacted prices and accounting figures. Area-level ADR is the median of the target properties. It can only be calculated for validated categories (business, city, resort, ryokan and capsule) and is not applied to vacation rental villas, so only listed prices are used for whole-building rentals.
- Data source: MetroEngines Research & Consulting (based on confirmed OTA listings)
- — 48.1% (680) of the 1,414 properties confirmed to have opened in 2026 are vacation rental villas — whole-building rentals. Recount the same population by room and the villa share shrinks to 3.1% (1,111 rooms).
- — Hotel-type properties (business, city, resort and similar) are only 22.5% (318 properties) by count, but 85.0% (30,890 rooms) by room. The lead role in supply changes hands depending on which unit you count.
- — The same reversal occurs at prefecture level. Osaka ranks 12th by property count (42) but first by room count at 3,020 rooms. Rooms per property range from 71.9 in Osaka to 7.9 in Oita — a 9.1x spread.
- — Listed prices for whole-building rentals run 2.7–4.3x those of business hotels, but the unit differs: one building versus one room. Properties quoting prices for parties of five or more: 80.3% of villas versus 13.7% of business hotels.
- — What whole-building rental supply competes for is not total room inventory but group and multi-guest demand. Supply assessment needs to keep property count, room count and guest capacity as three separate readings.
48.1% of the 1,414 Properties Opened in 2026 Are Whole-Building Rentals — 3.1% by Room Count
Start with the category breakdown. Of the 1,414 properties confirmed to have opened in 2026, the largest category is vacation rental villas at 680 properties, or 48.1% of the total. Second are business hotels at 186 (13.2%), third hostels at 103 (7.3%). Read the property-count ranking alone and 2026 new supply looks like a market half made of whole-building rentals.
Sort by room count, however, and the ranking inverts completely. Business hotels lead with 18,927 rooms (52.1%), followed by resort hotels at 6,763 (18.6%) and city hotels at 4,851 (13.3%), while vacation rental villas fall to roughly sixth at 1,111 rooms (3.1%). Average rooms per property are 115.5 for city hotels and 101.8 for business hotels, against just 1.6 for villas and 1.8 for machiya townhouses. Which unit you count determines which segment leads supply.
Source: MetroEngines Research & Consulting (based on confirmed OTA listings, N=1,414 properties)
| Category | Properties | Property share | Rooms | Room share | Per property |
|---|---|---|---|---|---|
| Vacation rental villa | 680 | 48.1% | 1,111 | 3.1% | 1.6 rooms |
| Business hotel | 186 | 13.2% | 18,927 | 52.1% | 101.8 rooms |
| Hostel | 103 | 7.3% | 1,970 | 5.4% | 19.1 rooms |
| Resort hotel | 82 | 5.8% | 6,763 | 18.6% | 82.5 rooms |
| Guesthouse | 75 | 5.3% | 317 | 0.9% | 4.2 rooms |
| Cottage | 64 | 4.5% | 624 | 1.7% | 9.8 rooms |
| Ryokan | 49 | 3.5% | 731 | 2.0% | 14.9 rooms |
| Machiya townhouse | 43 | 3.0% | 79 | 0.2% | 1.8 rooms |
| City hotel | 42 | 3.0% | 4,851 | 13.3% | 115.5 rooms |
| Minshuku | 23 | 1.6% | 116 | 0.3% | 5.0 rooms |
| Total (all categories) | 1,414 | 100% | 36,338 | 100% | 25.7 rooms |
Source: MetroEngines Research & Consulting (based on confirmed OTA listings, N=1,414 properties / 36,338 rooms, lower bound)
Grouping the categories into three blocks makes the structure clearer still. Hotel types (business, city, resort, deluxe, capsule) are 318 properties = 22.5% and 30,890 rooms = 85.0%. Dispersed types including whole-building rentals (vacation rental villa, cottage, machiya townhouse, guesthouse, glamping, pension, minshuku, lodge, farm stay, auberge) are 924 properties = 65.3% and 2,496 rooms = 6.9%. The mid-tier — ryokan, hostels and similar — is 172 properties = 12.2% and 2,952 rooms = 8.1%. In other words, this is a two-layer structure in which two-thirds of properties are dispersed types while more than 80% of rooms are hotel types.
The ratio has moved one step further from the previous year. Re-aggregating 2025 openings under identical extraction conditions gives 1,743 properties / 41,227 rooms, of which villas were 748 = 42.9%. The property-count share has risen 5.2 points, from 42.9% to 48.1%. That said, because of the observation lead time discussed below, the absolute property and room figures for 2026 are still filling in, so it is appropriate to read this only as a change in composition rather than to compare absolute values year on year.
How far the answer moves when you change the unit (sensitivity)
| Question | Answered by property count | Answered by room count | Gap |
|---|---|---|---|
| The largest category among 2026 openings is | Vacation rental villa 48.1% | Business hotel 52.1% (villas 3.1%) | 15.5x difference in villa share |
| The weight of hotel types is | 22.5% | 85.0% | 3.8x |
| Which prefecture added more supply, Yamanashi or Osaka | Yamanashi (51 > 42 properties) | Osaka (3,020 > 434 rooms) | Conclusion reverses; 7.0x by room |
| Largest and smallest scale per property | — | Osaka 71.9 rooms / Oita 7.9 rooms | 9.1x |
Aggregated from the same population (2026 openings, N=1,414 properties / 36,338 rooms) with only the denominator changed. All rankings and shares are comparisons within this article’s aggregation scope and do not represent a complete census.
Osaka Averages 71.9 Rooms per Property, Oita 7.9 — Prefecture Rankings Flip Too
The same phenomenon appears at prefecture level. Ranked by property count, Hokkaido leads with 136 properties (9.6% of the total), followed by Okinawa at 87 (6.2%), Tokyo at 83 (5.9%), Shizuoka at 83 (5.9%) and Kyoto at 73 (5.2%). Osaka sits 12th here, with 42 properties (3.0%).
Sort by room count, though, and Osaka takes first place with 3,020 rooms — 8.3% of the total — ahead of Okinawa (2,902 rooms, 8.0%) and Hokkaido (2,703 rooms, 7.4%). Against a 3.0% property share, its room share is 8.3%, a gap of 5.3 points. Osaka’s 2026 openings average 71.9 rooms per property, and only 7 of its 42 properties (17%) are whole-building rentals or cottages. In other words, urban multi-room hotels are the main body of supply there.
Shizuoka and Kyoto swing the other way. Shizuoka’s property share of 5.9% compares with a room share of 3.1% (a gap of +2.8 points), and Kyoto’s 5.2% against 2.4% (+2.7 points). Yamanashi is 3.6% against 1.2% (+2.4 points), with 78% of its 51 properties being whole-building rentals or cottages. On average rooms per property, the spread between the largest — Osaka at 71.9 rooms — and the smallest — Oita at 7.9 rooms — is 9.1x. In Oita, 72% of the 39 properties are whole-building rentals or cottages.
Source: MetroEngines Research & Consulting (based on confirmed OTA listings, 2026 openings, top 22 prefectures by property count)
Source: MetroEngines Research & Consulting (based on confirmed OTA listings, 2026 openings, top 22 prefectures by property count)
| Prefecture | Properties | Property share | Rooms | Room share | Divergence | Per property | Whole-building rental / cottage ratio |
|---|---|---|---|---|---|---|---|
| Shizuoka | 83 | 5.9% | 1,118 | 3.1% | +2.8pt | 13.5 rooms | 69% |
| Kyoto | 73 | 5.2% | 888 | 2.4% | +2.7pt | 12.2 rooms | 21% |
| Yamanashi | 51 | 3.6% | 434 | 1.2% | +2.4pt | 8.5 rooms | 78% |
| Hokkaido | 136 | 9.6% | 2,703 | 7.4% | +2.2pt | 19.9 rooms | 69% |
| Nagano | 61 | 4.3% | 866 | 2.4% | +1.9pt | 14.2 rooms | 57% |
| Oita | 39 | 2.8% | 309 | 0.9% | +1.9pt | 7.9 rooms | 72% |
| Kagoshima | 39 | 2.8% | 363 | 1.0% | +1.8pt | 9.3 rooms | 77% |
| Kanagawa | 38 | 2.7% | 1,444 | 4.0% | -1.3pt | 38.0 rooms | 61% |
| Okinawa | 87 | 6.2% | 2,902 | 8.0% | -1.8pt | 33.4 rooms | 60% |
| Osaka | 42 | 3.0% | 3,020 | 8.3% | -5.3pt | 71.9 rooms | 17% |
Divergence = property share minus room share. Positive values mark prefectures that stand out more by property count; negative values mark those larger by room count. Source: MetroEngines Research & Consulting (based on confirmed OTA listings, N=1,414 properties)
This is where the practical implication comes in. Counting opening press releases and noting that “this prefecture gained X properties this year” tells you nothing about how much room inventory that added to your own catchment area. Yamanashi gaining 51 properties and Osaka gaining 42 amounts, measured in room inventory, to 434 rooms versus 3,020 — roughly a sevenfold difference. Conversely, in prefectures with many whole-building rentals, the smaller scale per property means locations scatter more finely. Whether those same 434 rooms sit in one large hotel or are split across more than 40 whole-building rentals dotted through resort and hot-spring districts changes the nature of how demand gets divided. The same question of how prefecture rankings move when you change the denominator of supply is taken up in Lodging Supply Denominator: 44,901 Simple Lodgings Move Kyoto 21st→5th.
The Same Structure Holds in Existing Stock — Ryokan Are 20.8% of Properties but 12.8% of Rooms
This two-layer structure is not confined to 2026’s new openings. Break down the existing stock of 77,802 properties / 2,167,562 rooms the same way and the largest category by property count is ryokan at 16,196 (20.8%), which by room count is 277,279 rooms (12.8%). Business hotels are 11,059 properties (14.2%) but 1,006,416 rooms (46.4%). Vacation rental villas rank third by property count at 9,302 = 12.0%, yet account for just 15,303 rooms = 0.7%.
Grouped into three blocks, existing stock is 15,379 properties = 19.8% / 1,481,568 rooms = 68.4% for hotel types, 33,065 = 42.5% / 165,275 rooms = 7.6% for dispersed types, and 29,358 = 37.7% / 520,719 rooms = 24.0% for the mid-tier. Compared with 2026’s new supply (hotel types 22.5% / 85.0%, dispersed types 65.3% / 6.9%), the room-based composition of stock and new supply looks quite similar, whereas on a property-count basis the dispersed share swings sharply from 42.5% to 65.3%. The reading is that what is growing in new openings is “dispersed types as property count,” while the weight of “hotel types as room count” has not changed much from the existing stock.
Source: MetroEngines Research & Consulting (based on confirmed OTA listings, existing stock N=77,802 properties / 2026 new supply N=1,414 properties)
It is also worth noting which prefectures already have a thick concentration of whole-building rentals. Counting the existing stock of vacation rental villas and cottages by prefecture gives Okinawa 1,921 properties, Hokkaido 1,012, Nagano 743, Shizuoka 651, Kyoto 631, Chiba 596 and Yamanashi 516. The 2026 openings stack on top of that: Hokkaido added 94, Shizuoka 57, Okinawa 52 and Yamanashi 40. Yamanashi’s 40 new properties against an existing 516 is an addition equal to 7.8% of existing stock. In prefectures where the number of whole-building rental units keeps rising within the same catchment area, area-level supply and demand needs to be measured by guest capacity rather than by property count. What exactly is stacking up where in Shizuoka is broken down to the Izu and Atami level in Shizuoka’s 67 New 2026 Hotels: 1,089 Rooms, 64% One-Room Villas.
Whole-Building Rentals List at 2.7–4.3x Business Hotels — But the Unit Differs
Layer price onto the property-count versus room-count story and another structure worth watching appears. Taking July 2026 listed prices (all-plan average, tax included) by category for prefectures thick in whole-building rentals, vacation rental villas come to ¥69,900 in Nagano (N=302), ¥55,500 in Hokkaido (N=455), ¥49,400 in Shizuoka (N=369), ¥45,700 in Yamanashi (N=345) and ¥44,900 in Okinawa (N=768). Listed prices for business hotels in the same prefectures are ¥16,100 in Nagano (N=171), ¥20,400 in Hokkaido (N=417) and ¥14,100 in Shizuoka (N=225) — a level gap of 2.7 to 4.3 times.
It is premature, however, to read this as “whole-building rentals command higher rates.” The unit of the listed price is one room for business hotels and one building for whole-building rentals. As noted above, whole-building rentals average 1.6 registered rooms and are sold as an entire building. So even though both figures sit in the same “per-room rate” column, they are not comparing the same thing.
| Prefecture | Vacation rental villa listed price (per building, tax incl.) |
Business hotel listed price (per room, tax incl.) |
Level ratio | Reference: business hotel estimated settled ADR |
|---|---|---|---|---|
| Nagano | ¥69,900 N=302 | ¥16,100 N=171 | 4.3x | ¥8,100 N=167 |
| Shizuoka | ¥49,400 N=369 | ¥14,100 N=225 | 3.5x | ¥7,300 N=221 |
| Yamanashi | ¥45,700 N=345 | ¥15,900 N=78 | 2.9x | ¥8,000 N=73 |
| Oita | ¥36,800 N=168 | ¥13,000 N=86 | 2.8x | ¥6,100 N=91 |
| Hokkaido | ¥55,500 N=455 | ¥20,400 N=417 | 2.7x | ¥11,200 N=432 |
| Okinawa | ¥44,900 N=768 | ¥16,700 N=209 | 2.7x | ¥9,500 N=195 |
| Osaka | ¥23,800 N=103 | ¥14,000 N=550 | 1.7x | ¥8,400 N=497 |
July 2026. Listed prices are the all-plan average, tax included, for two guests in one room (one building for villas). Estimated settled ADR can only be calculated for validated categories and is not applied to vacation rental villas. Source: MetroEngines Research
Source: MetroEngines Research (July 2026, listed prices. Villas per building, business hotels per room)
The difference in units can be checked from the guest-capacity side. Across Nagano, Gifu and Shizuoka, counting properties that quote a price by party size for a 19–21 September 2026 check-in, vacation rental villas quote prices at 665 properties for two guests, still 534 (80.3% of the two-guest base) for five guests, and 105 (15.8%) even for eight. Under the same conditions, business hotels quote 511 properties for two guests but only 70 (13.7%) for five and 3 (0.6%) for eight. Ryokan quote 1,217 for two guests, 718 (59.0%) for five and 30 (2.5%) for eight.
| Category | Quoting for 2 guests | Also for 5 | Also for 8 |
|---|---|---|---|
| Vacation rental villa | 665 | 534 (80.3%) | 105 (15.8%) |
| Ryokan | 1,217 | 718 (59.0%) | 30 (2.5%) |
| Business hotel | 511 | 70 (13.7%) | 3 (0.6%) |
Nagano, Gifu and Shizuoka, check-in 19–21 September 2026. Figures in parentheses are ratios against the number of properties quoting for two guests. Source: MetroEngines Research
Eight in ten whole-building rentals quote prices for parties of five or more. The per-building listed price comes out high because the guest capacity is correspondingly large, not because the per-person level is high. Count supply by room and it looks small; look at price per room and it looks large — whole-building rentals are a category that presents itself in these two contradictory ways.
What This Means for Existing Properties — You Share Groups, Not Rooms
So how can an existing property use this structure? What the figures so far show is that growth in whole-building rental supply overlaps with a specific demand segment rather than with total room inventory. Against an 80.3% rate of quoting for five or more guests among whole-building rentals, business hotels sit at 13.7%. The occasions on which the two compete directly for the same booking are limited. Where they overlap is family, group and multi-guest stay demand — territory in which ryokan (59.0% for five or more) have traditionally been strong.
Accordingly, the more whole-building rental units a prefecture is adding, the more room existing properties have to make explicit why they should be chosen for group demand. If you have something whole-building rentals find hard to provide, that is where the headroom lies. Meal service, large communal baths and hot springs, pickup and drop-off, room combinations that work for multi-generation stays, and responsiveness to detailed same-day requests are not things that automatically increase as unit counts rise. In a catchment like Yamanashi, where 40 properties a year are added on top of an existing stock of 516 whole-building rentals, the design of group-oriented plans and of proposals combining multiple rooms can translate directly into revenue opportunity.
The other point is how growth in property count affects demand-supply estimates. Whole-building rentals average 1.6 rooms each and, unlike large properties, their inventory release is harder to read. When judging area supply and demand, it is practical to convert opening news into a scale of guest capacity rather than taking property counts at face value as inventory growth. Hokkaido’s 136 openings in 2026 amount to 2,703 rooms — below Osaka’s 42 properties at 3,020 rooms. The number of news items and the volume of inventory entering a catchment area are not proportional. Rankings of supply pressure that compare added rooms against existing stock are compiled in Hotel Supply Pressure Ranking 2026-2027: Ozu Kumamoto Tops at 30.8%.
Data Assumptions and Limitations — Sample Population, Observation Lead Time, Lower Bounds
Three assumptions underlie this article’s aggregation. They are stated explicitly to avoid misreading.
First, the population is based on confirmed OTA listings and is not a complete census. The lodging property master covering all 47 prefectures tracked by MetroEngines Research holds 77,802 properties (2,167,562 rooms in total), of which roughly 27,000 properties and about 1.26 million rooms can be confirmed as operating on OTAs. Ryokan, minshuku and simple lodgings not listed on OTAs are not included. All property and room counts are therefore figures “within the scope MetroEngines Research tracks.”
Second, the monthly opening counts for 2026 are affected by observation lead time. Because OTA listings appear several months before opening, the most recent and subsequent months structurally come out low. The monthly breakdown for 2026 is 241 properties in January, 161 in February, 197 in March, 209 in April, 155 in May, 155 in June, 164 in July and 71 in August, then thins abruptly to 20 in September, 21 in October, 7 in November and 13 in December. This does not mean supply disappears; the listings have simply not appeared yet. In fact, articles in which this publication aggregated the same data at different points in time reported 2026 openings as 556 properties and later as 1,351, and the figures have grown over time. The 1,414 here is likewise an observation at the current point and will rise further through the rest of this year and into next. That is precisely why absolute-value comparisons within the year should be avoided in favour of reading composition.
How far the observation could fill in — adjustment range
Put a range around “will rise further.” For 2026, 1,282 properties are observed in total for January–July, while August–December currently stands at just 132. Re-aggregated on identical conditions, 2025 finished with 1,096 properties in January–July against 648 in August–December (59.1% of the January–July figure). Applying that 2025 monthly distribution to 2026’s January–July actuals gives roughly 2,040 properties for the full year, and extending the January–July monthly average of 183 properties gives roughly 2,198. In other words, it is reasonable to read the current 1,414 as sitting at a point that will eventually fill in to about 2,000–2,200 properties (+45–55% versus now).
This is not a forecast of openings but an adjustment range extrapolated mechanically from how observation fills in given listing delays. The actual landing point depends on listing timing and updates to the population. Source: MetroEngines Research & Consulting (based on confirmed OTA listings, 2026 N=1,414 properties / 2025 N=1,743 properties)
Third, all room counts are lower bounds. Only 8 of the 1,414 properties opened in 2026 (0.6%) have no registered room count, but whole-building rentals are typically registered as 1–2 rooms per building in the first place, and capacity is not proportional to room count. The 36,338 rooms is “the sum of registered rooms,” not the ceiling of added lodging capacity. The party-size quoting rates in the previous section were included as a supplementary indicator to compensate for that difference.
⚠ Note on prices for future dates: Among the listed prices and estimated settled ADR in this article, levels from August 2026 onward are estimates based on selling prices published on OTAs at the time of the survey and will fluctuate as the check-in date approaches. Prices in the main text use, as a rule, July 2026 values for which results are settled. The party-size quoting rates are a point-in-time snapshot for a 19–21 September 2026 check-in.
Conclusion
Of the 1,414 properties confirmed to have opened in 2026, 48.1% are whole-building rentals — but 3.1% by room count. Hotel types are 22.5% by property and 85.0% by room. Change nothing but the unit of counting and the lead role changes hands. The same happens at prefecture level: Osaka ranks 12th by property count yet first by room count, while Shizuoka, Kyoto and Yamanashi look larger by property count. Average rooms per property range 9.1x, from 71.9 in Osaka to 7.9 in Oita.
Break existing stock down on the same measures and the room-based composition is similar between stock and new supply; what is changing is the property-based share of dispersed types (42.5% → 65.3%). Whole-building rentals list at 2.7–4.3x business hotels because the unit is one building, and behind that sits the capacity difference captured by the 80.3% rate of quoting for parties of five or more. When assessing supply, read property count, room count and guest capacity as three separate things. That is this article’s practical conclusion.
Related Reading
- Vacation Rentals Take 45% of Japan’s 2026 New Hotel Openings (247 Villas)
- Japan 2026: 1,242 Openings, 33,749 Rooms — 47% Villas, 42% Business
- Lodging Supply Denominator: 44,901 Simple Lodgings Move Kyoto 21st→5th
- Hotel Supply Pressure Ranking 2026-2027: Ozu Kumamoto Tops at 30.8%
- Shizuoka’s 67 New 2026 Hotels: 1,089 Rooms, 64% One-Room Villas
References and Sources
■ Data sources
The lodging property master for all 47 prefectures of Japan held by MetroEngines Research & Consulting (based on confirmed OTA listings, N=77,802 properties / 2,167,562 rooms in total). Within it, properties with an opening year of 2026 (N=1,414 properties / 36,338 rooms) and 2025 openings (N=1,743 properties / 41,227 rooms) were re-aggregated under identical extraction conditions. Listed prices are OTA-published selling prices as of July 2026 (all-plan average, two guests in one room / one building for whole-building rentals, tax included); the party-size quoting data is a snapshot for a 19–21 September 2026 check-in.
■ Calculation assumptions
Property shares use 1,414 properties as the denominator and room shares 36,338 rooms. The three groups are hotel types (business, city, resort, deluxe, capsule), dispersed types (vacation rental villa, cottage, machiya townhouse, guesthouse, glamping, pension, minshuku, lodge, farm stay, auberge) and the mid-tier (ryokan, hostels and similar). Divergence is the point difference of “property share minus room share.” The observation adjustment range was calculated two ways: applying the 2025 monthly distribution (August–December at 59.1% of January–July) to 2026’s January–July actual of 1,282 properties for the mid value, and extending the January–July monthly average of 183 properties for the upper value. Estimated settled ADR is an estimate applying category-specific adjustment coefficients to the lowest plan level; cross-checked against property-level disclosures by listed hotel REITs (91 properties, trailing three months), the median error is approximately 7%.
■ Limitations and caveats
The population is limited to properties whose OTA listings could be confirmed and is not a complete census. Ryokan, minshuku and simple lodgings not listed on OTAs are excluded. All room counts are lower bounds; because whole-building rentals are typically registered as 1–2 rooms per building, guest capacity is not proportional to room count. The most recent months of 2026 come out structurally low because of observation lead time, so absolute-value comparisons within the year are avoided in favour of composition. Because the unit of listed prices mixes one room and one building depending on category, the level ratio cannot be read directly as a difference in unit rates. Estimated settled ADR can only be calculated for validated categories and is not applied to vacation rental villas.
■ Supply and price data
- MetroEngines Research & Consulting — lodging property master (based on confirmed OTA listings, 47 prefectures of Japan, N=77,802 properties / 2,167,562 rooms), 2026 openings N=1,414 properties / 36,338 rooms, 2025 openings N=1,743 properties / 41,227 rooms
- MetroEngines Research — listed prices (all-plan average, tax included), estimated settled ADR (median error approximately 7% when cross-checked against property-level results disclosed by listed hotel REITs, 91 properties, trailing three months), party-size quoting status (Nagano, Gifu and Shizuoka, check-in 19–21 September 2026)
■ Government statistics and public data
- Japan Tourism Agency, “Overnight Travel Statistics Survey”
- Japan Tourism Agency, “Overnight Travel Statistics Survey (May 2026 second preliminary, June 2026 first preliminary)” press release
- Japan Tourism Agency, “Overnight Travel Statistics Survey (April 2026 second preliminary, 2025 annual figures, final)” press release
- Ministry of Land, Infrastructure, Transport and Tourism, “Statistics on Building Construction Starts”
■ Comparison with earlier aggregation points
- HotelBank, “Vacation Rentals Take 45% of Japan’s 2026 New Hotel Openings (247 Villas)” (aggregated when 2026 openings stood at 556 properties)
- HotelBank, “A 1-room lodging business licence has been in force since 2018” (aggregated when 2026 openings stood at 1,351 properties)