

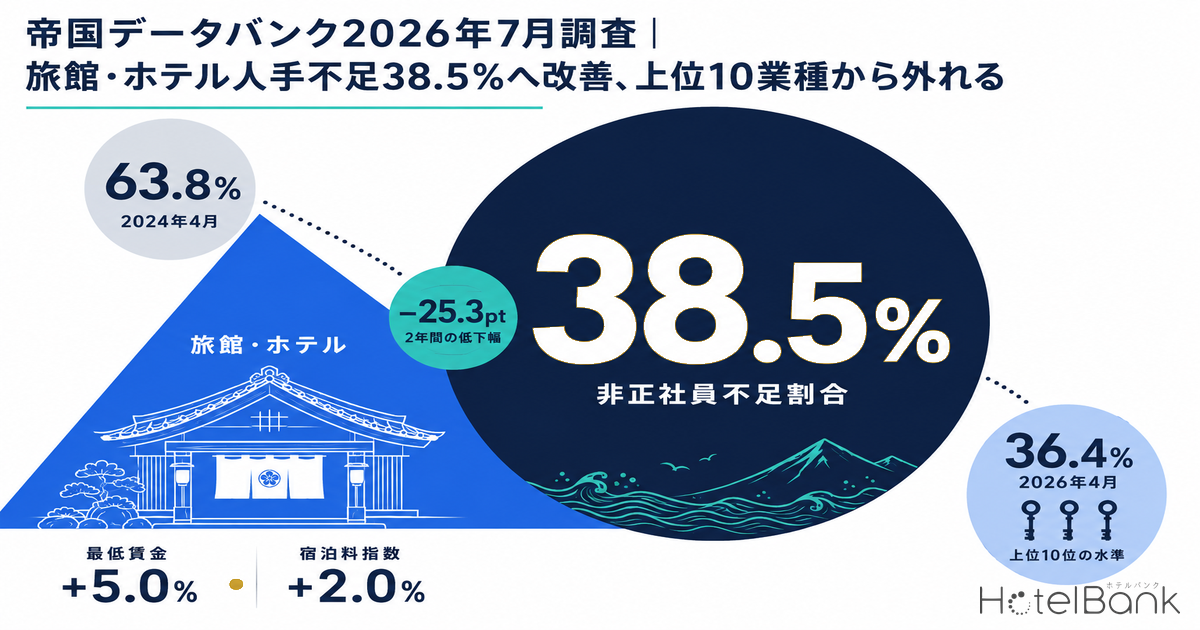
In Teikoku Databank’s “Survey on Corporate Labor Shortages (July 2026),” released on August 17, 2026, the share of companies reporting a shortage of non-regular employees came to 28.8%, staying below 30% for 16 consecutive months since April 2025. Turning to the lodging sector, the most recent survey to disclose figures by industry — the April 2026 round — put the non-regular staff shortage rate for “ryokan and hotels” at 38.5%. That is the first reading in the 30% range since February 2022, four years and two months earlier, and a 25.3-point drop from 63.8% in April 2024. This article traces what produced that improvement using primary statistics, and quantifies how much headroom remains for lodging operators across three dimensions: occupancy, property scale, and rate.
Metric Definitions Used in This Article
- Labor shortage rate: In Teikoku Databank’s survey, the share of companies answering that regular (or non-regular) employees are “in short supply.” Based on the firm’s monthly survey.
- OCC (occupancy rate): The share of rooms sold against total rooms in an area (an estimate based on OTA-listed inventory). In this article it is used only at the prefecture × property-type level; occupancy for individual properties is not calculated. It is an estimate derived from how listed OTA inventory is absorbed, and differs from a property’s actual overall occupancy.
- Listed price: Per-room rate for double occupancy (tax included).
- Data sources: Teikoku Databank; Ministry of Health, Labour and Welfare; e-Stat (Statistics Bureau of Japan); MetroEngines Research
- — 38.5%——the non-regular staff shortage rate for ryokan and hotels. Down 25.3 points from 63.8% in April 2024, back in the 30% range for the first time in four years and two months.
- — Off the top-10 list. In the July 2026 survey the 10th-ranked industry stood at 36.4%, placing ryokan and hotels below that line.
- — Improvement came from both supply and demand. The productivity gains from digitalization and spot work are an asset that stays inside the property.
- — Up to 7.5 points——estimated OCC for ryokan trails business hotels in all eight major prefectures surveyed, leaving room to lift occupancy.
- — The break-even point is a 40.0% labor cost ratio. Whether a 5.0% minimum-wage increase can be absorbed by a 2.0% rise in room rates flips sign depending on your own labor cost ratio.
Non-Regular Staff Shortages at Ryokan and Hotels Fell 25.3 Points in Two Years
Start with the numbers. According to Teikoku Databank’s April 2026 survey (fielded April 16–30, 2026; 23,083 companies targeted, 10,538 valid responses, a 45.7% response rate), “ryokan and hotels” ranked 10th among industries with high non-regular staff shortage rates, at 38.5%. The firm noted that “‘ryokan and hotels,’ once at the top, also came in at 38.5% — back in the 30% range for the first time since February 2022, four years and two months ago.” Lined up against 63.8% in April 2024 and 51.8% in April 2025, that is a 25.3-point decline over two years. Over the same period, “restaurants” moved 74.8% → 65.3% → 59.1%, a 15.7-point drop, and “maintenance, security and inspection” 57.8% → 56.4% → 55.5%, a decline of just 2.3 points. The fall in lodging stands out as markedly the largest among major industries.
Source: Compiled by the HotelBank Editorial Team from Teikoku Databank, “Survey on Corporate Labor Shortages,” April rounds of each year
In the latest July 2026 survey (fielded July 17–31, 2026; 22,350 companies targeted, 10,518 valid responses, a 47.1% response rate), “ryokan and hotels” does not appear among the top 10 industries for non-regular staff shortages. Tenth place in that table goes to “specialty retail” at 36.4%. In other words, as of July 2026 ryokan and hotels had moved below the 38.5% recorded in April, to a level that no longer places them in the top 10. In the same survey “restaurants” led at 57.7% (down 4.1 points year on year), yet stayed under 60% for a fourth consecutive month from April. Lodging and food service — the two areas exposed to the fiercest hiring competition since the pandemic — are both settling down together.
| Rank | Industry (non-regular staff) | July 2024 | July 2025 | July 2026 |
|---|---|---|---|---|
| 1 | Restaurants | 67.5% | 61.8% | 57.7% |
| 2 | Maintenance, security and inspection | 55.3% | 55.1% | 56.8% |
| 2 | Staffing and recruitment | 58.6% | 63.3% | 56.8% |
| 4 | Leisure services | 40.5% | 47.1% | 54.1% |
| 9 | Transport and warehousing | 37.8% | 40.4% | 39.5% |
| 10 | Specialty retail | 37.6% | 36.1% | 36.4% |
| Outside | Ryokan and hotels (April 2026: 38.5%) | — | — | Outside top 10 |
Source: Compiled by the HotelBank Editorial Team from Teikoku Databank, “Survey on Corporate Labor Shortages (July 2026)” (industries with 20 or more respondents; 10,518 valid responses)
What Worked — Three Factors Cited by the Survey Publisher
In the April survey, Teikoku Databank described the backdrop to the simultaneous improvement at restaurants and at ryokan and hotels as follows: “productivity gains from the spread of digitalization and spot work, along with visitor numbers settling down amid high prices and a decline in Chinese tourists.” In short, the supply side (people became more productive) and the demand side (peak spikes softened) moved at the same time.
What matters here is that these two carry entirely different meanings for a lodging business. Productivity gains accumulate as an asset inside the property; a settling of visitor numbers is a swing in the external environment. The more a property has benefited from the former, the more rooms it can capture when demand next returns. Across all industries, labor-shortage bankruptcies reached 227 cases in the first half of 2026 — a record for any first half — so the improvement is far from uniform by sector. While lodging sits on the improving side, the question is how much of that internal asset it can build up. On the separate question of securing staff over the medium to long term, Japan’s Specified Skilled Worker framework for the lodging sector is undergoing changes on the institutional side that bear watching.
Occupancy Headroom — a Gap of Up to 7.5 Points Between Ryokan and Business Hotels
How does the easing of shortages show up in actual selling power? Looking at estimated OCC for July 2026 compiled by MetroEngines Research (based on OTA-listed inventory) by property type, business hotels outrank ryokan in all eight major prefectures surveyed. The widest gap is in Osaka (business hotels 84.7% vs. ryokan 77.2%, a 7.5-point spread), followed by Shizuoka (87.7% / 80.5%, 7.2 points), Kanagawa (87.7% / 80.8%, 6.9 points) and Hokkaido (94.2% / 87.6%, 6.6 points). At the other end, Kyoto is nearly level at 83.4% / 83.1%, as is Okinawa at 91.6% / 91.4%, and Tokyo shows only a narrow gap at 93.2% / 90.1%.
Source: Compiled by MetroEngines Research and the HotelBank Editorial Team (July 2026; estimates based on OTA-listed inventory; N = 2,709 business hotels and 1,282 ryokan across the eight prefectures)
Behind this gap lies a difference in how many rooms a single property carries. Among the properties we track where occupancy can be confirmed, business hotels number 6,389 properties with 644,066 rooms, averaging 100.8 rooms; ryokan number 7,741 properties with 179,897 rooms, averaging 23.2 rooms. Work that arises per property rather than per room — staffing the front desk, serving breakfast — does not scale with room count, so the fewer the rooms, the higher the staffing density per room. That ryokan occupancy runs a few points short of business hotels also means, read the other way, that room remains to sell more inventory as staffing falls into place. With the sense of shortage now down in the 30% range, this is a phase in which that room can more readily be converted into occupancy. How widely operators had been capping the number of rooms they put on sale because of staffing constraints is a related question we have analyzed separately.
| Property type | Properties | Total rooms | Average rooms | Share with 50 rooms or fewer |
|---|---|---|---|---|
| Ryokan | 7,741 | 179,897 rooms | 23.2 rooms | 90.8% |
| Business hotels | 6,389 | 644,066 rooms | 100.8 rooms | 35.6% |
| Resort hotels | 1,226 | 94,357 rooms | 77.0 rooms | 56.3% |
| City hotels | 1,102 | 176,313 rooms | 160.0 rooms | 18.0% |
| Capsule hotels | 236 | 30,453 rooms | 129.0 rooms | 15.3% |
| Deluxe hotels | 110 | 29,079 rooms | 264.4 rooms | 23.6% |
Source: MetroEngines Research (N = 16,804 properties, 1,154,165 rooms; operating properties with a known room count)
Where Spot Work and Labor-Saving Pay Off — 61% of Properties Have 50 Rooms or Fewer
The publisher put “the spread of digitalization and spot work” at the top of its list of improvement factors — but in which size bracket does that pay off most? Splitting properties by room-count range makes the structure clear. Properties with 50 rooms or fewer number 10,254 and account for 61.0% of the total, yet they hold just 205,919 rooms, or 17.8% of all rooms. Properties above 151 rooms, by contrast, are only 2,202 properties, or 13.1%, but hold 547,942 rooms, or 47.5%. The 51–150 room bracket sits in between at 4,348 properties (25.9%) and 400,304 rooms (34.7%).
Source: Compiled by MetroEngines Research and the HotelBank Editorial Team (N = 16,804 properties)
This asymmetry determines which measures to choose. In the 50-rooms-or-fewer bracket, the small room count per property means a single unfilled position translates directly into fewer sellable rooms. Here, approaches that “adjust volume on a daily basis” — spot work that covers only the busiest dates — deliver a large return relative to the outlay. In the above-151-room bracket, where 13.1% of properties hold 47.5% of the rooms, installing a single fixed-cost labor-saving investment such as a self check-in kiosk or a housekeeping management system reaches an order of magnitude more rooms. Put differently, under the same heading of “labor saving,” properties with 50 rooms or fewer are controlling variable costs while those above 151 rooms are investing in fixed costs — the character of the move reverses.
The middle 51–150 room bracket accounts for roughly 30% of both properties and rooms, and is the zone where both approaches mesh. With the sense of shortage falling into the 30% range in 2026, properties in this bracket are entering a stage where management resources once spent simply on securing people can be redirected toward staffing design and capital investment.
Absorption Capacity on the Rate Side — a 5.0% Minimum-Wage Rise Against a 2.0% Gain in the Accommodation Index
Staffing may have become easier to secure, but labor costs themselves are rising. According to the Ministry of Health, Labour and Welfare, recommendations for fiscal 2026 regional minimum wages have now been issued for all 47 prefectures, with a national weighted average of ¥1,177. That is a ¥56 increase from ¥1,121 the previous year, or +5.0%. The ministry calls it “the second-largest increase since the benchmark system began in fiscal 1978.” Increases range from ¥54 to ¥65 across the 47 prefectures, with a high of ¥1,280 and a low of ¥1,085 — a ratio of 84.8% (up from 83.4% the previous year), improving for a 12th consecutive year. Effective dates fall in sequence between October 1 and December 2, 2026, a spread of up to two months depending on the prefecture.
Set that against the rate side. Within the Statistics Bureau’s Consumer Price Index (2020 base, nationwide), the “accommodation” component stood at 169.1 in July 2026, up 2.0% year on year. After peaking at +9.3% in November 2025, growth has eased through 2026: +5.9% in January, +5.0% in March, +4.6% in April and +3.1% in June. For three years, rate increases served as the vessel absorbing rising labor costs; that momentum has now entered a phase where it runs below the pace of minimum-wage growth.
Source: Compiled by the HotelBank Editorial Team from the Statistics Bureau of Japan, “Consumer Price Index” (2020 base, nationwide, accommodation component; e-Stat)
Comparing these two growth rates head-on does not by itself say anything about profit and loss. The minimum wage applies to a portion of labor cost, while accommodation rates apply to total revenue. Place a labor cost ratio against revenue, convert both into the same “share of revenue (pt)” terms, and it becomes visible where they balance.
| Labor cost ratio (vs. revenue) | Added burden from +5.0% labor cost | Added revenue from +2.0% rates | Net |
|---|---|---|---|
| 20% | +1.00pt | +2.00pt | +1.00pt of headroom |
| 25% | +1.25pt | +2.00pt | +0.75pt of headroom |
| 30% | +1.50pt | +2.00pt | +0.50pt of headroom |
| 35% | +1.75pt | +2.00pt | +0.25pt of headroom |
| 40% | +2.00pt | +2.00pt | ±0.0pt (break-even) |
| 45% | +2.25pt | +2.00pt | −0.25pt shortfall |
Estimated by the HotelBank Editorial Team from the Ministry of Health, Labour and Welfare’s “Recommendations on the Fiscal 2026 Revision of Regional Minimum Wages” and the Statistics Bureau’s “Consumer Price Index” (accommodation). A simplification that assumes total labor cost rises at the same rate as the minimum wage, holding rooms sold and room mix unchanged.
The break-even point is a labor cost ratio of 40.0%. At properties below that line, the added revenue from a 2.0% rate increase exceeds the added burden of a 5.0% rise in labor costs. A 30% labor cost ratio leaves 0.50pt of headroom; even 35% leaves 0.25pt. Above 40%, rate growth alone cannot absorb the increase. Lined up as growth rates, +5.0% and +2.0% look like a 3.0-point gap; in profit-and-loss terms the difference is far smaller, and its sign even flips from one property to the next. Where your own labor cost ratio sits on this table determines how urgently you need measures beyond rate.
This is where the easing of the labor shortage matters. If labor costs rise 5.0% in a phase when rate growth is slowing, what closes the gap is the number of rooms one person can cover — that is, productivity. In spring 2024, when the shortage rate stood at 63.8%, the prior question was simply whether anyone could be hired at all, and the conditions for designing staffing were hard to assemble. Now that it has fallen to 38.5%, operators can secure the headcount they need and then choose “how many people to place where.” Designing for profit without leaning on rate alone has, for the first time in a while, returned as a realistic option. Prefecture-by-prefecture revision amounts and effective dates for the minimum wage are set out in our article on Japan Minimum Wage 2026: Chiba & Aichi ¥1,195, Oct 1-15 Rollout.
Conclusion — How to Use a Phase of Improvement
To summarize. First, the non-regular staff shortage rate for ryokan and hotels fell 25.3 points, from 63.8% in April 2024 to 38.5% in April 2026, returning to the 30% range for the first time in four years and two months. In the July 2026 survey it dropped out of the top 10 industries (10th place at 36.4%), so the level has fallen further still. Second, the survey publisher attributes the improvement to productivity gains from digitalization and spot work, plus a settling of visitor numbers; the former is an asset that stays inside the property. Third, estimated OCC shows ryokan trailing business hotels in all eight major prefectures surveyed, and given an average scale of 23.2 rooms, room remains to sell more inventory as staffing falls into place. Fourth, the character of what works reverses between the 50-rooms-or-fewer bracket, which holds 61.0% of properties, and the above-151-room bracket, which holds 47.5% of rooms. Fifth, the minimum wage takes effect at +5.0% from October 2026 while growth in the accommodation index has eased to +2.0%, raising the value of having a vessel other than rate.
A phase in which the sense of shortage recedes is time in which effort once poured into hiring can be redirected into staffing and equipment. How that time is used will show up as a difference in the number of rooms an operator can capture when demand next picks up.
Related Articles
- Japan Minimum Wage 2026: Chiba & Aichi ¥1,195, Oct 1-15 Rollout
- Only Hotels That Capture Demand Survive: 2026’s Occupancy Ceiling
- Cleaning Dispatch Rate Surge & Mid-Size Hotel Pressure: 2026 H2 Polarization
- Japan Ends the ¥1.06M Wage Threshold Oct 2026: Hotel Shift Design
References and Sources
- Teikoku Databank, “Survey on Corporate Labor Shortages (July 2026)” (released August 17, 2026)
- Teikoku Databank, “Survey on Corporate Labor Shortages (April 2026)” (released May 19, 2026)
- Ministry of Health, Labour and Welfare, “Recommendations on the Fiscal 2026 Revision of Regional Minimum Wages”
- Ministry of Health, Labour and Welfare, “Benchmarks for the Fiscal 2026 Revision of Regional Minimum Wages”
- e-Stat, Portal Site of Official Statistics of Japan — Statistics Bureau, “Consumer Price Index” (2020 base, nationwide, accommodation; table ID: 0003427113)
- Teikoku Databank, “Bankruptcy Tally, First Half of 2026 (January–June)” (released July 8, 2026; 227 labor-shortage bankruptcies)
- MetroEngines Research — estimated OCC by property type (July 2026, based on OTA-listed inventory; N = 2,709 business hotels and 1,282 ryokan across the eight prefectures) and the mix of properties and rooms (N = 16,804 properties, 1,154,165 rooms)
■ Data Sources
Labor shortage rates come from Teikoku Databank’s monthly survey (July 2026 round: 22,350 companies targeted, 10,518 valid responses; April 2026 round: 23,083 companies targeted, 10,538 valid responses). Minimum wages come from the Ministry of Health, Labour and Welfare’s recommendations. The accommodation index comes from the Statistics Bureau’s Consumer Price Index (2020 base, nationwide). Estimated OCC and the mix of properties and rooms come from MetroEngines Research (based on OTA-listed inventory, as of July 2026).
■ Estimate Assumptions
The absorption-capacity estimate is a simplification that assumes total labor cost rises at the same rate as the minimum wage (+5.0%) and that room rates rise at the same rate as the accommodation component of the Consumer Price Index (+2.0%). Rooms sold, room mix and occupancy are held unchanged, and cost items other than labor are not considered. The 40.0% break-even labor cost ratio is derived from 2.0 ÷ 5.0.
■ Limitations and Caveats
The minimum-wage increase applies to wages near the minimum, so total labor cost does not necessarily rise at the same rate. Effective dates vary by prefecture by up to two months. The April 2026 round is the most recent disclosure of shortage rates by industry, and the level for ryokan and hotels as of July 2026 has not itself been published. Estimated OCC is an estimate based on how listed OTA inventory is absorbed, and differs from a property’s actual overall occupancy.