

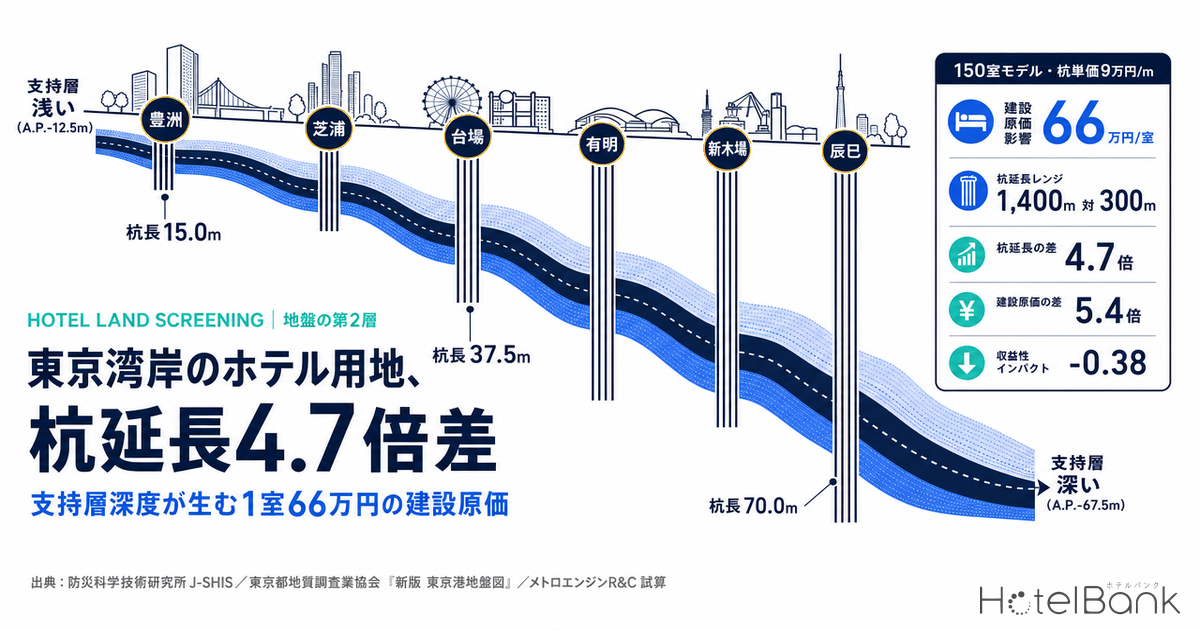
When ground conditions are screened for a hotel site, most practitioners stop at a binary judgment — shaky or not shaky. But what shows up in the pre-construction estimate is not how much the ground shakes; it is how many metres below grade the hard stratum sits. Piles do not work unless they reach the bearing stratum. The depth at which that stratum appears therefore converts directly into pile length, and from there into construction cost. Using surface-ground data from the National Research Institute for Earth Science and Disaster Resilience and the bearing-stratum depths published for the Tokyo waterfront by the Association of Tokyo Geological Survey Companies, this article quantifies how pile length can differ by as much as 4.7x within the same category of “reclaimed land”, and estimates what that means per room for a 150-room model hotel.
How this article differs in scope from our earlier work
This article deals only with the foundation method at new construction — the cost fixed before groundbreaking. Flood and inundation risk for existing buildings and disaster-mitigation capex, insurance opex during the holding period, and the permits and earthwork costs involved in moving soil are treated in separate articles in this location-risk series. This article does not touch disaster capex, insurance premiums or earthwork costs; it narrows to a single point — bearing-stratum depth and pile length.
Metric Definitions Used in This Article
- ADR (average daily rate): an estimated settled rate (tax-excluded equivalent) calculated by applying a segment-specific adjustment coefficient to the lowest published plan level each property lists on OTAs and other channels (two guests per room, per-room price, tax included). Cross-checked against per-property results disclosed by listed hotel REITs (91 properties, most recent 3 months), the median error is approximately 7%. These are estimates and differ from each property’s actual transaction prices and accounting figures. Area-level ADR is the median of the properties covered (the level of a typical property in that area).
- AVS30 (average S-wave velocity in the top 30m): the average S-wave velocity (m/s) from the surface to a depth of 30m. The lower the value, the softer the surface ground and the more seismic motion is amplified. Amplification factor is the ratio of peak ground velocity at the surface to that at engineering bedrock. Both are published values from the NIED J-SHIS surface-ground dataset (250m mesh).
- Bearing stratum: a stratum with an N-value of 50 or above, capable of supporting the foundations of a large structure. Elevations are given relative to Arakawa Peil (A.P.), the mean sea level datum of Tokyo Bay.
- Data sources: MetroEngines Research & Consulting (ADR); National Research Institute for Earth Science and Disaster Resilience, J-SHIS (surface ground); Association of Tokyo Geological Survey Companies / Bureau of Port and Harbor, Tokyo Metropolitan Government, “New Edition: Ground Map of the Port of Tokyo” (bearing-stratum depth).
- — Shakiness shows no meaningful gap — average S-wave velocity in the top 30m across 11 Tokyo Bay waterfront districts runs 151.4–160.4 m/s, a spread of just 1.06x. First-pass screening drops them all into the same “soft ground” box.
- — Bearing-stratum depth differs by 5.4x — across those same 11 districts, the bearing stratum appears anywhere from A.P. -12.5m to -67.5m. Its correlation with AVS30 is -0.38: shakiness does not predict pile length.
- — Pile length is 300m versus 1,400m — in a 150-room, 5,400m² model (20 cast-in-place piles), the gap is 4.67x, or 1,100m in absolute terms. Pile cost per room splits into ¥180,000 versus ¥840,000 (at ¥90,000/m).
- — A ¥440,000–880,000 per-room cost gap — the range when pile unit price is varied from ¥60,000 to ¥120,000/m. As a share of total construction cost, 1.27%–5.93%. The mid-case ¥660,000 equals 2.7% of the ¥24.14M median per-room acquisition price of Tokyo properties held by listed hotel REITs.
- — Worth adding one column to the screening sheet — bearing-stratum depth can be pulled from public data, yet most screening sheets have no column for it. Shakiness (layer 1) and bearing-stratum depth (layer 2) are separate data feeding separate decisions, and should be held separately.
The first-pass screening layer — 24 submarkets ranked by microtopography and surface S-wave velocity
Start with the public data actually usable at the entrance to site screening. J-SHIS, the Japan Seismic Hazard Information Station run by the National Research Institute for Earth Science and Disaster Resilience, divides the country into a 250m mesh and publishes, for each cell, the microtopographic classification and average S-wave velocity in the top 30m (AVS30), along with the Amplification factor relative to engineering bedrock. Because a set of coordinates is all it takes, it suits first-pass screening at the stage where dozens of candidate sites are still in play.
The chart below shows the results for 24 major hotel-cluster submarkets nationwide, ordered from the lowest — that is, softest — end.
The ordering follows a clear logic. The softest is Kinshicho in Tokyo (reclaimed farmland, 151.7 m/s), followed by Makuhari New City in Chiba, and Toyosu, Ariake, Odaiba and Shibaura in Tokyo — Tokyo Bay landfill occupies the bottom of the table. At the hard end sit Sakae in Nagoya (gravelly plateau, 294.9 m/s), Sannomiya in Kobe (alluvial fan, 293.9 m/s) and Tennoji in Osaka (gravelly plateau, 272.0 m/s). On amplification factor, Kinshicho’s 2.28 against Sakae’s 1.30 means surface shaking differs by 1.75x for the same seismic input.
Notably, central Osaka and Nagoya cannot be sorted by whether a site is on the waterfront. Umeda in Osaka is inland but sits on delta and coastal lowland at 167.6 m/s, and Nagoya’s Meieki is on a natural levee at 168.8 m/s — both softer than the reclaimed land of Minato Mirai in Yokohama (174.4 m/s). A prime location in front of a terminal station has no correlation whatsoever with firm ground.
| Submarket | microtopographic classification | AVS30 (m/s) | Amplification factor | Classification group |
|---|---|---|---|---|
| Kinshicho, Tokyo | Reclaimed farmland | 151.7 | 2.28 | Landfill / reclaimed farmland |
| Makuhari New City, Chiba | Landfill | 153.3 | 2.26 | Landfill / reclaimed farmland |
| Toyosu, Tokyo | Landfill | 153.6 | 2.26 | Landfill / reclaimed farmland |
| Ariake, Tokyo | Landfill | 154.3 | 2.25 | Landfill / reclaimed farmland |
| Odaiba, Tokyo | Landfill | 154.6 | 2.25 | Landfill / reclaimed farmland |
| Shibaura / Hamamatsucho, Tokyo | Landfill | 155.5 | 2.24 | Landfill / reclaimed farmland |
| Kannai, Yokohama | Delta / coastal lowland | 159.4 | 2.19 | Delta / lowland / valley floor |
| Umeda, Osaka | Delta / coastal lowland | 167.6 | 2.10 | Delta / lowland / valley floor |
| Meieki, Nagoya | Natural levee | 168.8 | 2.09 | Delta / lowland / valley floor |
| Minato Mirai, Yokohama | Landfill | 174.4 | 2.03 | Landfill / reclaimed farmland |
| Konohana (Sakurajima), Osaka | Reclaimed farmland | 178.9 | 1.98 | Landfill / reclaimed farmland |
| Nanko ATC, Osaka | Landfill | 181.1 | 1.96 | Landfill / reclaimed farmland |
| Tenjin, Fukuoka | Sand dune | 194.5 | 1.85 | Sandbar / sand dune |
| Hakata Station, Fukuoka | Delta / coastal lowland | 195.9 | 1.84 | Delta / lowland / valley floor |
| Shibuya, Tokyo | Valley-floor lowland | 200.4 | 1.80 | Delta / lowland / valley floor |
| Akasaka, Tokyo | Loam plateau | 253.8 | 1.47 | Plateau / alluvial fan |
| Nishi-Shinjuku, Tokyo | Loam plateau | 258.1 | 1.45 | Plateau / alluvial fan |
| Asakusa, Tokyo | Sandbar / gravel bar | 260.2 | 1.44 | Sandbar / sand dune |
| Ueno, Tokyo | Sandbar / gravel bar | 260.2 | 1.44 | Sandbar / sand dune |
| Yaesu, Tokyo | Sandbar / gravel bar | 260.2 | 1.44 | Sandbar / sand dune |
| Namba, Osaka | Sandbar / gravel bar | 260.2 | 1.44 | Sandbar / sand dune |
| Tennoji, Osaka | Gravelly plateau | 272.0 | 1.39 | Plateau / alluvial fan |
| Sannomiya, Kobe | Alluvial fan | 293.9 | 1.30 | Plateau / alluvial fan |
| Sakae, Nagoya | Gravelly plateau | 294.9 | 1.30 | Plateau / alluvial fan |
What screening flattens out — a 5.4x depth gap inside “reclaimed land”
Here is the core of it. Look only at surface S-wave velocity and the Tokyo Bay landfill looks monolithic. Among the 11 waterfront districts covered below: Tokai–Haneda in Ota 160.4, Shibaura–Konan in Minato 156.2, Takeshiba–Shibaura Pier in Minato 155.5, Ariake / Aomi in Koto and Odaiba in Minato 154.4, Shin-Kiba–Arakawa river mouth in Koto 153.3, Shiohama–Edagawa in Koto 151.4 — a max-to-min ratio of only 1.06x. Bundling these into a single “soft ground” box at first-pass screening is a natural call, and that is what happens in practice.
Overlay the waterfront bearing-stratum data published by the Association of Tokyo Geological Survey Companies (originally from the Tokyo Metropolitan Government Bureau of Port and Harbor’s “New Edition: Ground Map of the Port of Tokyo”), however, and an entirely different picture appears. The association compiles, district by district along the waterfront, the type and appearance elevation of competent bearing strata (the basal gravel bed of the alluvium, buried-terrace gravel, the Tokyo Gravel Formation, the Edogawa Formation and the Kazusa Group, all showing N-values of 50 or above). Those values run A.P. -5 to -20m for the upper sandy soil layer of the Edogawa Formation under Harumi–Kachidoki in Chuo and Toyosu in Koto, against A.P. -65 to -70m for the basal alluvial gravel bed under Tatsumi, Shiomi, Shin-Kiba and Wakasu in Koto and Shinonome 1–2 chome.
Taking representative values (the midpoint of each range), there is a 5.4x spread, from A.P. -12.5m to A.P. -67.5m. And these sites are within a few kilometres of one another, all of them “Tokyo Bay landfill”, and AVS30 cannot tell them apart. Plotted against each other, the relationship looks like this.
Every point falls within a narrow 151.4–160.4 m/s band on the horizontal axis, while the vertical axis stretches from 12.5m to 67.5m. The correlation coefficient is -0.38 — directionally a weak tendency for districts with higher AVS30 (slightly firmer surface ground) to have a shallower bearing stratum, but with almost no power to explain the variance in depth. A shakiness metric does not predict pile length. That is only to be expected: AVS30 is an average picture of the top 30m and says nothing about what lies beneath. On a site where the bearing stratum sits at A.P. -67.5m, the softness of the upper 30m is barely different from a site where it sits at -12.5m.
Mapped, the distribution of depth follows neither distance from the shoreline nor the age of the reclamation. Toyosu (A.P. -5 to -20m) and Tatsumi / Shinonome (A.P. -65 to -70m) sit adjacent across a single canal, while Odaiba and Ariake, furthest out into the bay, fall in the middle at A.P. -20 to -50m. This reflects the shape of an old buried valley beneath the fill — something unreadable from the surface.
Converting to pile length — 300m versus 1,400m in a 150-room model
To convert depth into cost, it is more accurate to pass through pile length (m), a physical quantity, first. The following model building is set out with its assumptions stated explicitly.
Model building
Limited-service hotel, 150 rooms, gross floor area 5,400m² (36m²/room), building footprint 620m², 11 storeys above ground.
Foundation type
Cast-in-place concrete piles, one pile per column. A 6.4m × 6.4m column grid gives 20 piles.
Pile length calculation
Planned ground level A.P. +3.5m, footing base GL -3.0m, embedment into the bearing stratum 2.0m. Pile length = absolute value of bearing-stratum depth + 2.5m.
The table below applies those assumptions to calculate pile length and total pile length by district. Total pile length is 20 piles × pile length; the per-room figure is shown alongside.
| District | Bearing stratum | Appearance elevation | Pile length | Total pile length | Per room | Pile cost / room | Share of total construction cost |
|---|---|---|---|---|---|---|---|
| Harumi–Kachidoki (Chuo) / Toyosu (Koto) | Edogawa Fm., upper sandy soil layer | A.P. -5 to -20m | 15.0m | 300m | 2.00m | ¥180,000 | 1.27% |
| Shibaura–Konan–Shinagawa Pier (Minato) | Tokyo Gravel Formation | A.P. -10 to -20m | 17.5m | 350m | 2.33m | ¥210,000 | 1.48% |
| Takeshiba Pier–Shibaura Pier (Minato) | Edogawa Fm., upper sandy soil layer | A.P. -10 to -25m | 20.0m | 400m | 2.67m | ¥240,000 | 1.70% |
| Tokai (Ota)–Tokyo International Airport | Edogawa Fm. (alternating sandy and cohesive soils) | A.P. -15 to -40m | 30.0m | 600m | 4.00m | ¥360,000 | 2.54% |
| Higashi-Shinagawa–Yashio–Oi Pier (Shinagawa) | Tokyo Gravel Formation | A.P. -20 to -30m | 27.5m | 550m | 3.67m | ¥330,000 | 2.33% |
| Ariake / Aomi (Koto) and Odaiba (Minato) | Tokyo Gravel Formation | A.P. -20 to -50m | 37.5m | 750m | 5.00m | ¥450,000 | 3.18% |
| Shiohama–Edagawa (Koto) | Buried-terrace deposits / Kazusa Group | A.P. -30 to -50m | 42.5m | 850m | 5.67m | ¥510,000 | 3.60% |
| Rinkaicho, Kasai (Edogawa) | Tokyo Gravel Formation | A.P. -45 to -50m | 50.0m | 1,000m | 6.67m | ¥600,000 | 4.24% |
| Shin-Kiba area–Arakawa river mouth (Koto) | Buried-terrace deposits / Edogawa Fm. | A.P. -45 to -60m | 55.0m | 1,100m | 7.33m | ¥660,000 | 4.66% |
| Tatsumi, Shiomi, Shin-Kiba, Wakasu, Shinonome (Koto) | Basal gravel bed of the alluvium | A.P. -65 to -70m | 70.0m | 1,400m | 9.33m | ¥840,000 | 5.93% |
At the shallowest — Harumi–Kachidoki and Toyosu — a 15.0m pile length gives 300m of total pile, just 2.00m per room. At the deepest — Tatsumi, Shiomi, Shin-Kiba, Wakasu and Shinonome — 70.0m piles give 1,400m in total, 9.33m per room. That is 4.67x as a ratio and 1,100m in absolute terms. Those 1,100m flow through to excavation volume, rebar tonnage, concrete volume and construction days alike.
Converting to yen — ¥440,000–880,000 per room, 3 to 6 points of total construction cost
From here, unit-price assumptions enter, so the results are presented as a sensitivity analysis rather than a single assertion. Construction unit prices for cast-in-place concrete piles swing widely with pile diameter, method, project scale and the presence of subsurface obstructions, so quoting one market price would be meaningless. Three levels — ¥60,000/m, ¥90,000/m and ¥120,000/m — are applied to all 10 districts to show how pile cost per room moves.
| District | Total pile length | At ¥60,000/m | At ¥90,000/m | At ¥120,000/m |
|---|---|---|---|---|
| Harumi–Kachidoki (Chuo) / Toyosu (Koto) | 300m | ¥120,000 | ¥180,000 | ¥240,000 |
| Shibaura–Konan–Shinagawa Pier (Minato) | 350m | ¥140,000 | ¥210,000 | ¥280,000 |
| Takeshiba Pier–Shibaura Pier (Minato) | 400m | ¥160,000 | ¥240,000 | ¥320,000 |
| Tokai (Ota)–Tokyo International Airport | 600m | ¥240,000 | ¥360,000 | ¥480,000 |
| Higashi-Shinagawa–Yashio–Oi Pier (Shinagawa) | 550m | ¥220,000 | ¥330,000 | ¥440,000 |
| Ariake / Aomi (Koto) and Odaiba (Minato) | 750m | ¥300,000 | ¥450,000 | ¥600,000 |
| Shiohama–Edagawa (Koto) | 850m | ¥340,000 | ¥510,000 | ¥680,000 |
| Rinkaicho, Kasai (Edogawa) | 1,000m | ¥400,000 | ¥600,000 | ¥800,000 |
| Shin-Kiba area–Arakawa river mouth (Koto) | 1,100m | ¥440,000 | ¥660,000 | ¥880,000 |
| Tatsumi, Shiomi, Shin-Kiba, Wakasu, Shinonome (Koto) | 1,400m | ¥560,000 | ¥840,000 | ¥1,120,000 |
| Deepest district − shallowest district | 1,100m | ¥440,000 | ¥660,000 | ¥880,000 |
The gap between the shallowest and deepest districts is ¥440,000 per room at ¥60,000/m, ¥660,000 at ¥90,000/m and ¥880,000 at ¥120,000/m. Per building, that is ¥66M to ¥132M. Against a total construction cost of ¥2.12B, pile work alone moves across a 4.7-point band, from 1.27% to 5.93%.
A comparison helps put that magnitude in context. Dividing the acquisition prices of the 300 domestic properties held by seven listed hotel REITs by room count gives a median of ¥20.51M per room; narrowing to the 51 properties inside Tokyo gives ¥24.14M (ownership master as of August 31, 2026). The ¥660,000 per-room gap estimated at ¥90,000/m equals 2.7% of that Tokyo median acquisition price.
Look at it from the revenue side as well. Estimated settled ADR for Koto ward compiled by MetroEngines Research is ¥13,800 as a 12-month median from September 2025 to August 2026 (N=41 properties). At that rate, ¥660,000 per room is roughly 48 room-nights of revenue. For reference, estimated settled ADR over the same period is ¥19,100 in Chuo (N=151 properties), ¥17,900 in Minato (N=130), ¥13,000 in Shinagawa (N=35), ¥12,100 in Ota (N=57) and ¥11,300 in Edogawa (N=18). Among the waterfront wards, the relatively high-rate Chuo and Minato also sit on the shallower side of the bearing stratum — higher rates and lighter foundation costs pulling in the same direction.
In a rising construction-cost market, this gap means something different
What matters more than the absolute size of the pile cost is that it lands in the middle of a broad rise in construction costs. Hotel construction costs based on the MLIT housing-start statistics rose 41% in two years, from ¥1.38M per tsubo in 2022 to ¥1.95M in 2024, and stayed high through 2025 at an all-structures average of ¥1.952M and ¥2.405M for steel-frame construction. We have back-calculated the actual per-room construction cost from planning data in separate work, and tested from housing-start statistics how far the choice of structural system moves the unit cost. When the denominator is swelling, the extra burden of choosing a site with a deep bearing stratum grows heavier in absolute terms year after year, even at an unchanged percentage.
Put the other way round, this is also a market in which selection pays. Among candidate sites in the same waterfront area, the same zoning district and the same walking-distance band, choosing the shallower side compresses total pile length to a fraction. Unlike land price or station distance — variables everyone looks at — bearing-stratum depth is barely examined at the early screening stage. It is one of the few levers still movable before groundbreaking. Other variables change construction conditions through site selection alone, such as the parking spaces required by municipal ordinance, which we have set out separately.
Putting it into site screening — three layers
Layer 1: microtopography and AVS30
The stage with dozens of candidate sites. Coordinates alone pull the data instantly, anywhere in Japan. Candidates falling on landfill, reclaimed farmland, delta or back marsh should be held on the assumption that they advance to the next layer. Cutting them mechanically here also cuts good sites with a shallow bearing stratum.
Layer 2: bearing-stratum depth by district
The stage with the field narrowed to a dozen or so. For the Tokyo waterfront, use district-level data from the “New Edition: Ground Map of the Port of Tokyo” family; for other cities, municipal ground maps and published borehole logs. Confirm the type and appearance elevation of the bearing stratum. This is where the order of magnitude of pile length is set.
Layer 3: on-site boreholes
The purchase-offer and schematic-design stage. District data are area-level representative values, and the bearing stratum undulates even within one district. Fixing pile length, and confirming subsurface obstructions and buried valleys, can only be done at this layer. The layer-2 value is the expectation you carry into that investigation.
The practical point comes down to not confusing layers 1 and 2. Layer 1 looks at how the ground shakes in an earthquake, and feeds discussions of insurance premiums, structural design and business continuity planning. Layer 2 looks at the foundation method and its cost. They are different data driving different decisions. As shown here, on Tokyo Bay landfill the layer-1 metric barely moves while layer 2 moves by 5.4x — so layer 1 cannot stand in for layer 2.
Assumptions and limitations of the estimates
- Bearing-stratum appearance elevations are district-level ranges published by the Association of Tokyo Geological Survey Companies, not values for individual sites. Pile lengths here are representative calculations using range midpoints. Actual design requires confirmation by on-site boreholes.
- The 20-pile count, the pile-length formula and the building conditions of 5,400m² and 150 rooms are all model assumptions. Changing the structural system, storey count, column span or pile diameter changes total pile length.
- The ¥60,000–120,000/m pile unit-price range is an assumption for sensitivity analysis and does not represent any specific market price or quotation level. All amounts are estimates.
- This article covers only the cost of the foundation method. It excludes liquefaction countermeasures, earth retaining, removal of subsurface obstructions, groundwater measures, disaster-prevention equipment and insurance premiums. Because landfill, reclaimed farmland and delta are microtopographic classifications prone to liquefaction, an actual business plan would carry these as separate line items.
- The denominator for the share of total construction cost assumes ¥1.3M per tsubo (5,400m² gross floor area ≈ 1,634 tsubo, ¥2.12B). Substituting the 2025 housing-start statistics level (¥1.952M per tsubo, all-structures hotel average) as the denominator puts the same pile cost at 0.85%–3.95%. The absolute figures for total pile length and pile cost are unaffected by the choice of denominator.
- AVS30 and amplification factors are representative values for a 250m mesh. Local ground variation within a cell is not represented.
Conclusion
Ground assessment for a hotel site needs to be handled as two separate layers: shakiness, and bearing-stratum depth. Rank 24 submarkets nationwide by surface S-wave velocity and the Tokyo Bay landfill clusters at almost identical values, landing in a single box at first-pass screening. Yet across those same 11 districts the bearing stratum appears anywhere from A.P. -12.5m to A.P. -67.5m, a 5.4x spread, and the correlation between the two is only -0.38.
Converting that depth gap into pile length for a 150-room, 5,400m² model gives 300m against 1,400m — a 4.67x difference. Varying the pile unit price across ¥60,000–120,000/m produces ¥440,000–880,000 per room, or 1.27% to 5.93% of total construction cost. At the ¥90,000/m mid-case, ¥660,000 per room equals 2.7% of the ¥24.14M median per-room acquisition price of Tokyo properties held by listed hotel REITs, and roughly 48 room-nights at Koto ward’s estimated settled ADR.
Land price, station distance and floor-area ratio are numbers everyone sees once the candidates are lined up. Bearing-stratum depth can be pulled from public data, and still most screening sheets have no column for it. As a cost that can be moved before groundbreaking, it is well worth one more column.
Related reading
References and Sources
■ Data sources
Surface ground data (microtopographic classification, average S-wave velocity in the top 30m, amplification factor) were taken from NIED J-SHIS published 250m-mesh values at each submarket’s representative coordinates (24 submarkets nationwide, 11 Tokyo Bay waterfront districts). Bearing-stratum types and appearance elevations are district-level published values from the Association of Tokyo Geological Survey Companies, “Bearing Ground of the Tokyo Waterfront” (March 2023, originally from the Tokyo Metropolitan Government Bureau of Port and Harbor, “New Edition: Ground Map of the Port of Tokyo”). Estimated settled ADR is the 12-month median for Tokyo’s 23 wards from September 2025 to August 2026, compiled by MetroEngines Research & Consulting. Per-room acquisition price is calculated by dividing acquisition price by room count using the ownership master for seven listed hotel REITs (300 domestic properties, snapshot as of August 31, 2026). Construction cost levels are from the MLIT “Statistical Survey on Building Construction Starts” and the Construction Price Research Institute “Building Cost Index”.
■ Estimation assumptions
The model building is a limited-service hotel with 150 rooms, gross floor area 5,400m² (36m²/room), building footprint 620m² and 11 storeys above ground. Foundations are cast-in-place concrete piles, one pile per column, with a 6.4m × 6.4m column grid giving 20 piles. Pile length = absolute value of bearing-stratum appearance depth + 2.5m (planned ground level A.P. +3.5m, footing base GL -3.0m, embedment into the bearing stratum 2.0m). Bearing-stratum depth uses the midpoint of each district-level range. Pile cost is tested at three unit-price levels — ¥60,000 / ¥90,000 / ¥120,000 per m (materials and labour) — with ¥90,000/m as the representative value used in the text. The denominator for total construction cost is ¥1.3M per tsubo × 5,400m² gross floor area (approx. 1,634 tsubo) = ¥2.12B (¥14.16M per room).
■ Limitations and caveats
Bearing-stratum appearance elevations are district-level ranges, not values for individual sites. Actual design requires confirmation by on-site boreholes, and the bearing stratum undulates even within a single district. Pile count, the pile-length formula and building conditions are all model assumptions; changing the structural system, storey count, column span or pile diameter changes total pile length. The pile unit-price range is an assumption for sensitivity analysis and does not represent any specific market price or quotation level; all amounts are estimates. This article covers only the cost of the foundation method and excludes liquefaction countermeasures, earth retaining, removal of subsurface obstructions, groundwater measures, disaster-prevention equipment and insurance premiums. The share of total construction cost depends on the choice of denominator: using the 2025 housing-start statistics level (¥1.952M per tsubo, all-structures hotel average) puts the same pile cost at 0.85%–3.95% (absolute figures for total pile length and pile cost are unchanged). AVS30 and amplification factors are representative values for a 250m mesh and do not capture local ground variation within a cell. Estimated settled ADR is an estimate derived by applying segment-specific adjustments to published prices, and differs from each property’s actual transaction prices and accounting figures.
■ Market data
- MetroEngines Research & Consulting — estimated settled ADR (Tokyo’s 23 wards, September 2025 to August 2026); REIT ownership master (300 domestic properties, snapshot as of August 31, 2026)
■ Ground and geological data
- National Research Institute for Earth Science and Disaster Resilience, “J-SHIS (Japan Seismic Hazard Information Station)” surface-ground data (microtopographic classification, AVS30, amplification factor, 250m mesh)
- Association of Tokyo Geological Survey Companies, “The Ground Environment of the Tokyo Waterfront — Bearing Ground of the Tokyo Waterfront” (March 1, 2023) / originally from the Tokyo Metropolitan Government Bureau of Port and Harbor, “New Edition: Ground Map of the Port of Tokyo”
■ Construction costs and public statistics
- Ministry of Land, Infrastructure, Transport and Tourism, “Statistical Survey on Building Construction Starts” (hotel construction cost per tsubo, by structural system)
- Construction Price Research Institute, “Building Cost Index”
- AQUA, “What Does a Hotel Cost to Build? Cost per Tsubo and the Breakdown of Construction Costs” (earthwork, foundations, piling and frame account for 15–25% of total construction cost)